Image Classification Model Monitoring
In the context of image classification, model monitoring involves regularly testing the model's performance on a set of validation images that are separate from the training dataset. By doing so, we can identify any drift in the model's performance over time, such as a decrease in accuracy due to changes in the input data or the underlying distribution of the data.To monitor an image classification model, we can use several metrics to assess its performance, such as accuracy, precision, recall, and F1-score. These metrics are calculated by comparing the model's predicted class labels with the actual class labels of the validation images.
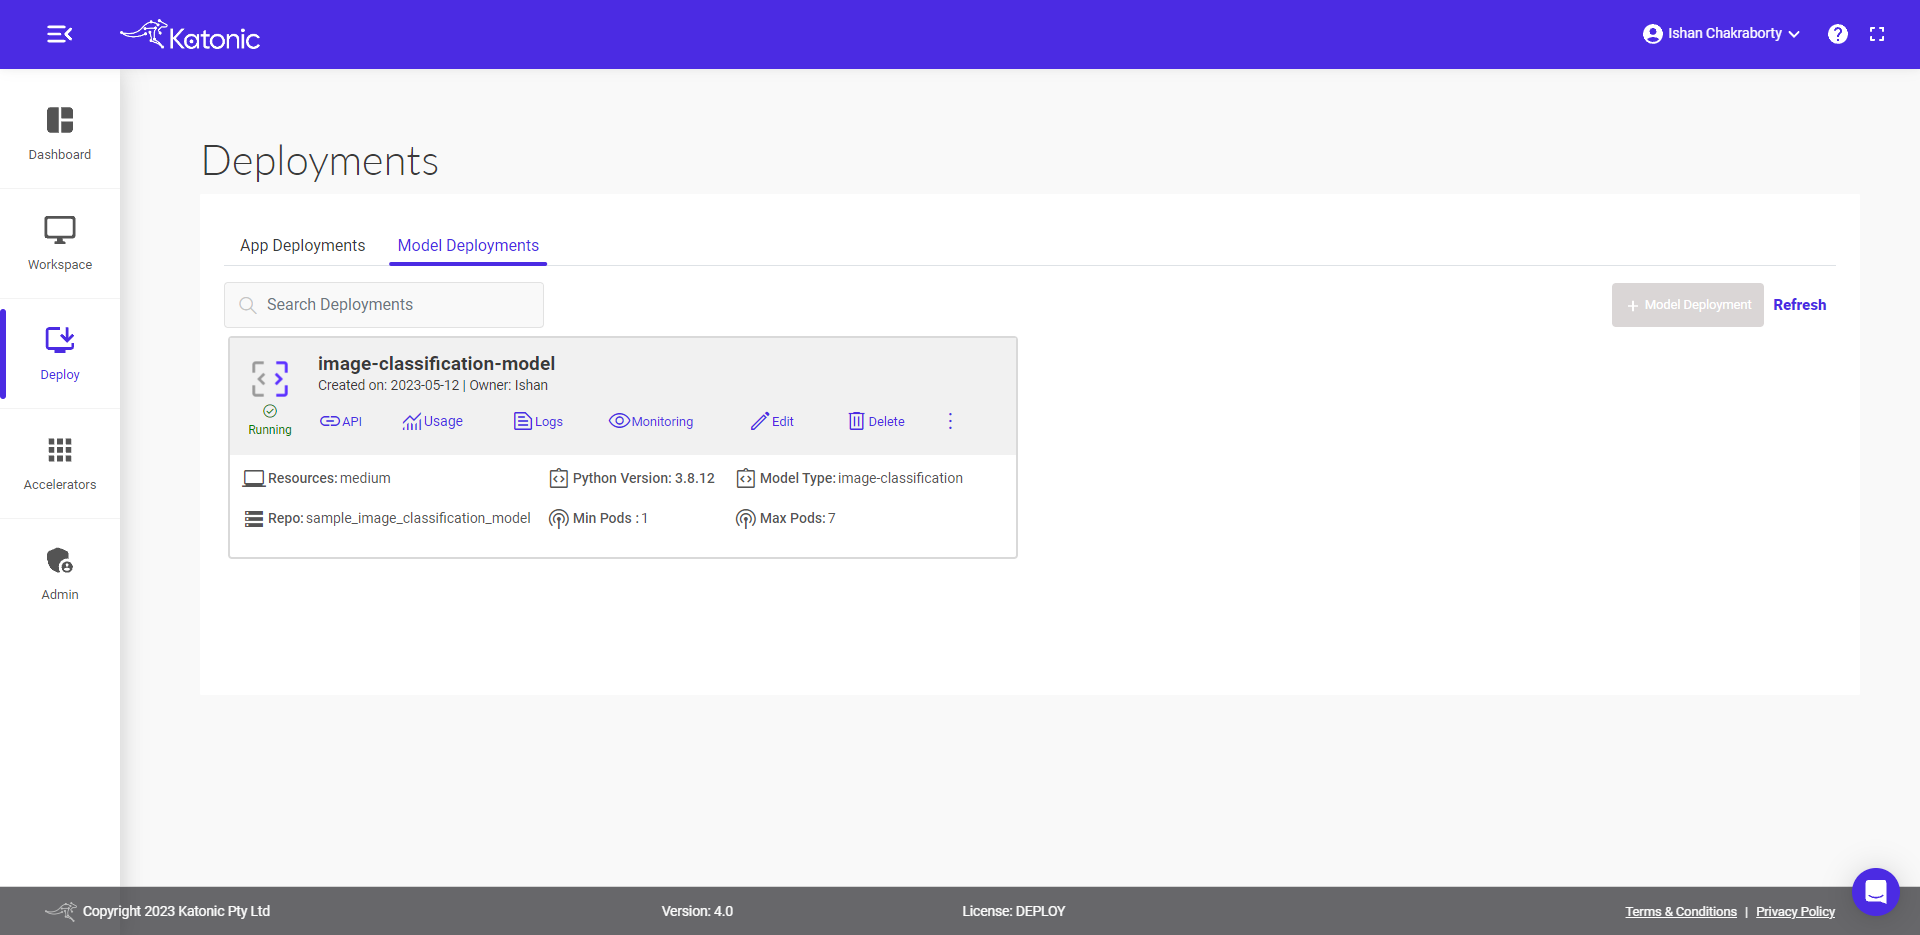
For Image Classification monitoring dashboard

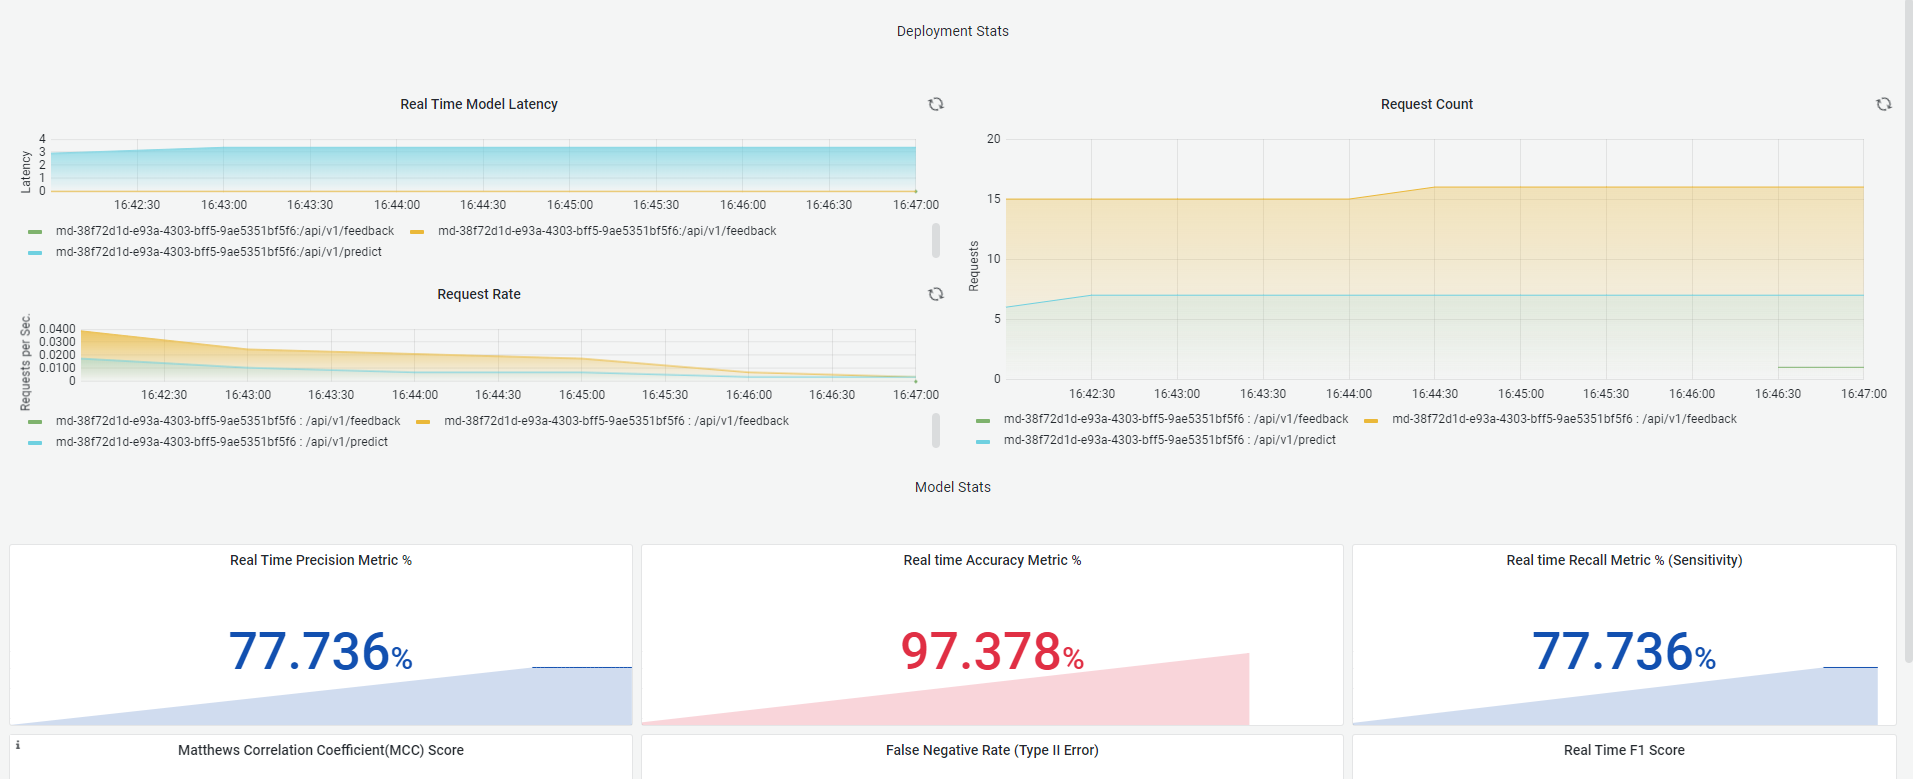
Metrics for monitoring Image Classification models
1. Accuracy
Accuracy is a commonly used metric to evaluate the performance of an image classification model. It measures the percentage of correctly classified images out of the total number of images in the dataset.
2. Precision
Precision is another commonly used metric to evaluate the performance of an image classification model, especially when dealing with imbalanced datasets. It measures the fraction of true positive classifications out of all the positive classifications made by the model.
In image classification, precision can be defined as the number of correctly classified positive images divided by the total number of images classified as positive by the model.
3. Recall
In image classification, recall can be defined as the number of correctly classified positive images divided by the total number of actual positive images in the dataset.
However, as with precision, recall alone may not be enough to evaluate the overall performance of a model, and it should be used in conjunction with other metrics such as precision and F1 score to get a better understanding of the model's performance.
4. F1 score
The F1 score is a commonly used metric for evaluating the performance of image classification models. It is the harmonic mean of precision and recall, which provides a single score that takes into account both metrics. The F1 score ranges from 0 to 1, where 1 indicates perfect precision and recall, and 0 indicates poor performance.
5. Matthews Correlation Coefficient (MCC)
The Matthews Correlation Coefficient (MCC) is a metric that is commonly used to evaluate the performance of classification models, including image classification models. It takes into account true positives, true negatives, false positives, and false negatives, and provides a balanced measure of the quality of the classification.
6. F2 Score
The F2 score is another evaluation metric used for classification problems, similar to the F1 score. However, the F2 score places more weight on recall than precision, which is useful in situations where recall is more important than precision.
7. False Negative Rate (FNR)
False Negative Rate (FNR) is the proportion of actual positive instances that are incorrectly predicted as negative by the model. In image classification, FNR indicates the fraction of positive samples that are misclassified as negative by the model.
8. False Positive Rate (FPR)
False Positive Rate (FPR) is the proportion of actual negative instances that are incorrectly predicted as positive by the model. In image classification, FPR indicates the fraction of negative samples that are misclassified as positive by the model.
9. True Negative Rate (TNR)
True Negative Rate (TNR), also known as specificity, is the proportion of actual negative instances that are correctly predicted as negative by the model. In image classification, TNR indicates the fraction of negative samples that are correctly classified as negative by the model.
10. Negative Predictive Value (NPV)
Negative Predictive Value (NPV) is the proportion of negative predictions that are actually negative. In image classification, NPV indicates the fraction of negative predictions that are correctly classified as negative by the model.
11. False Discovery Rate (FDR)
False Discovery Rate (FDR) is the proportion of positive predictions that are actually negative. In image classification, FDR indicates the fraction of positive predictions that are incorrect and wrongly classified as positive by the model.
For Feedback input:
{
    "predicted_label": [1,1,1,1,0,0,0,0,1,0,1,0],
    "true_label": [1,1,0,1,0,1,0,0,1,0,1,0]
}

# Both the input has to be a 1d array or list.