Agent overview
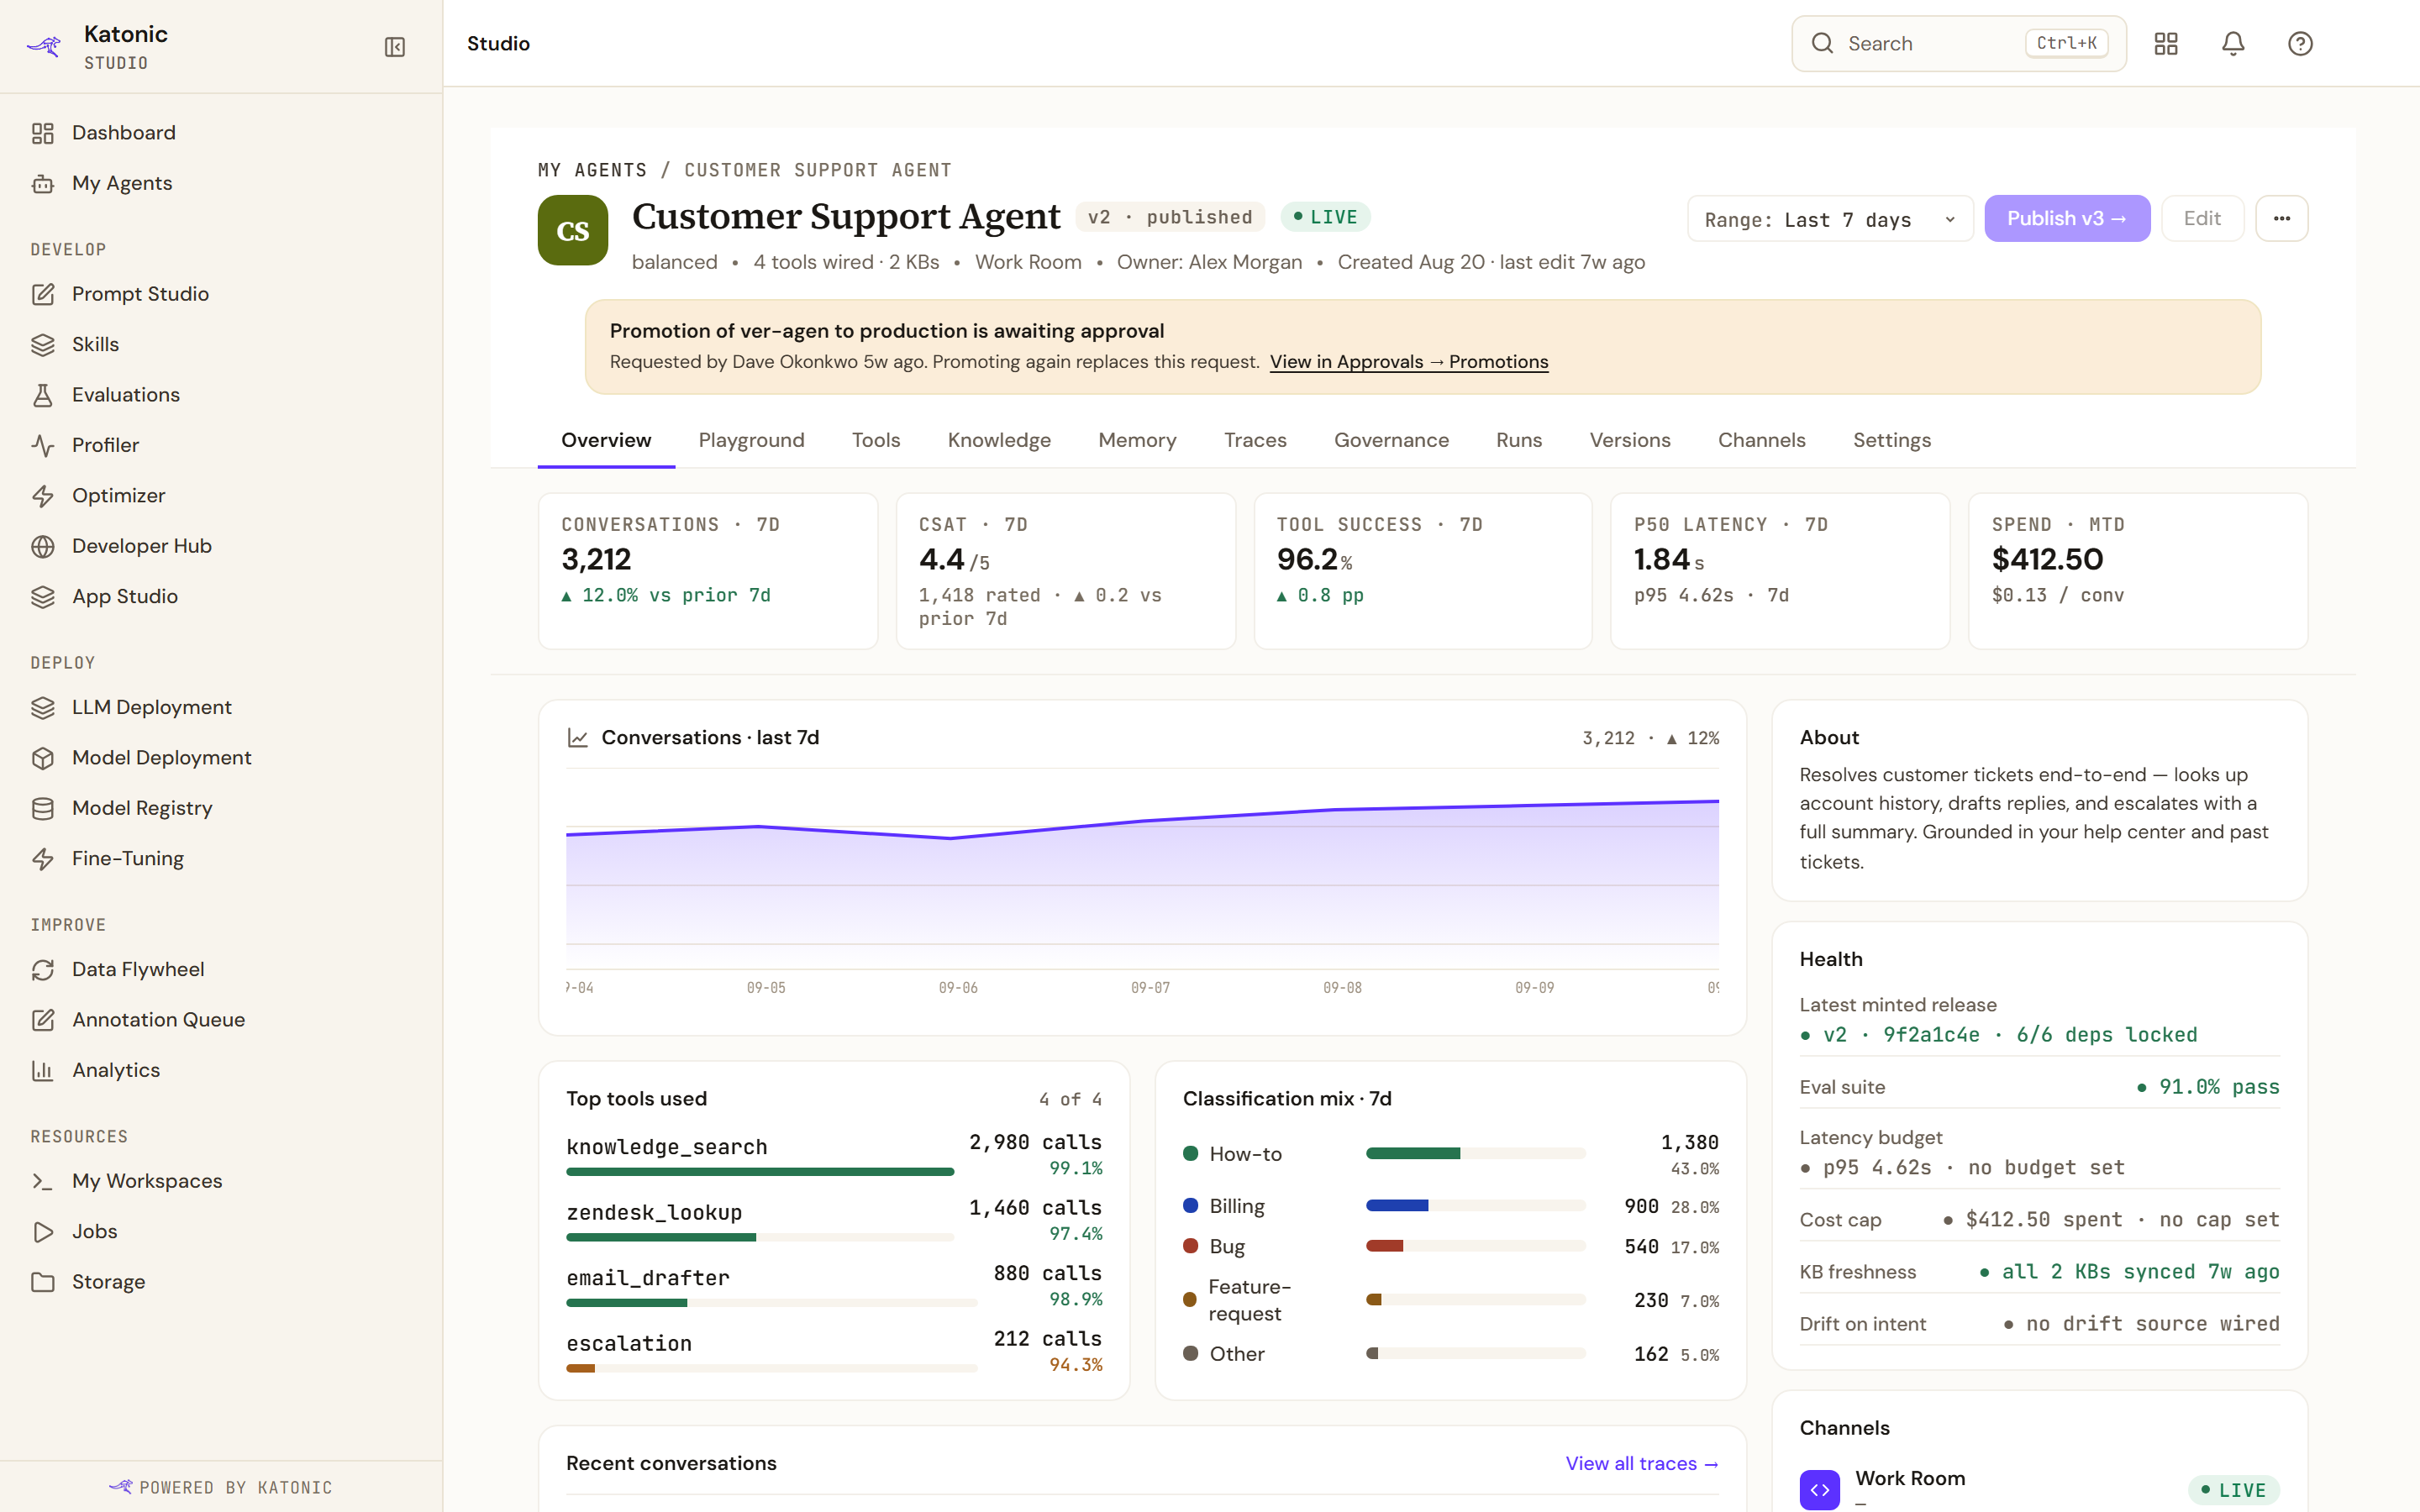
The Overview tab answers whether the agent is working and what it is costing, over a window you pick in the header.
Who can use it: anyone who can open the agent.
The five figures
| Figure | What it is |
|---|---|
| Conversations | Sessions in the window, with the change against the window before |
| Quality | The evaluation result, named for whatever measure produced it |
| Tool success | The share of tool calls that succeeded, with the change in points |
| p50 latency | The median, with the 95th percentile beside it |
| Spend | Month-to-date, with the cost per conversation |
The quality tile renames itself for the measure behind it, so it can read as groundedness, thumbs, satisfaction or simply quality. Read the label, not the position.
The spend tile says no billing source wired rather than showing a zero when nothing is metering.
The range picker offers the last hour, day, week, fortnight or month, and defaults to a week.
Traffic and tools
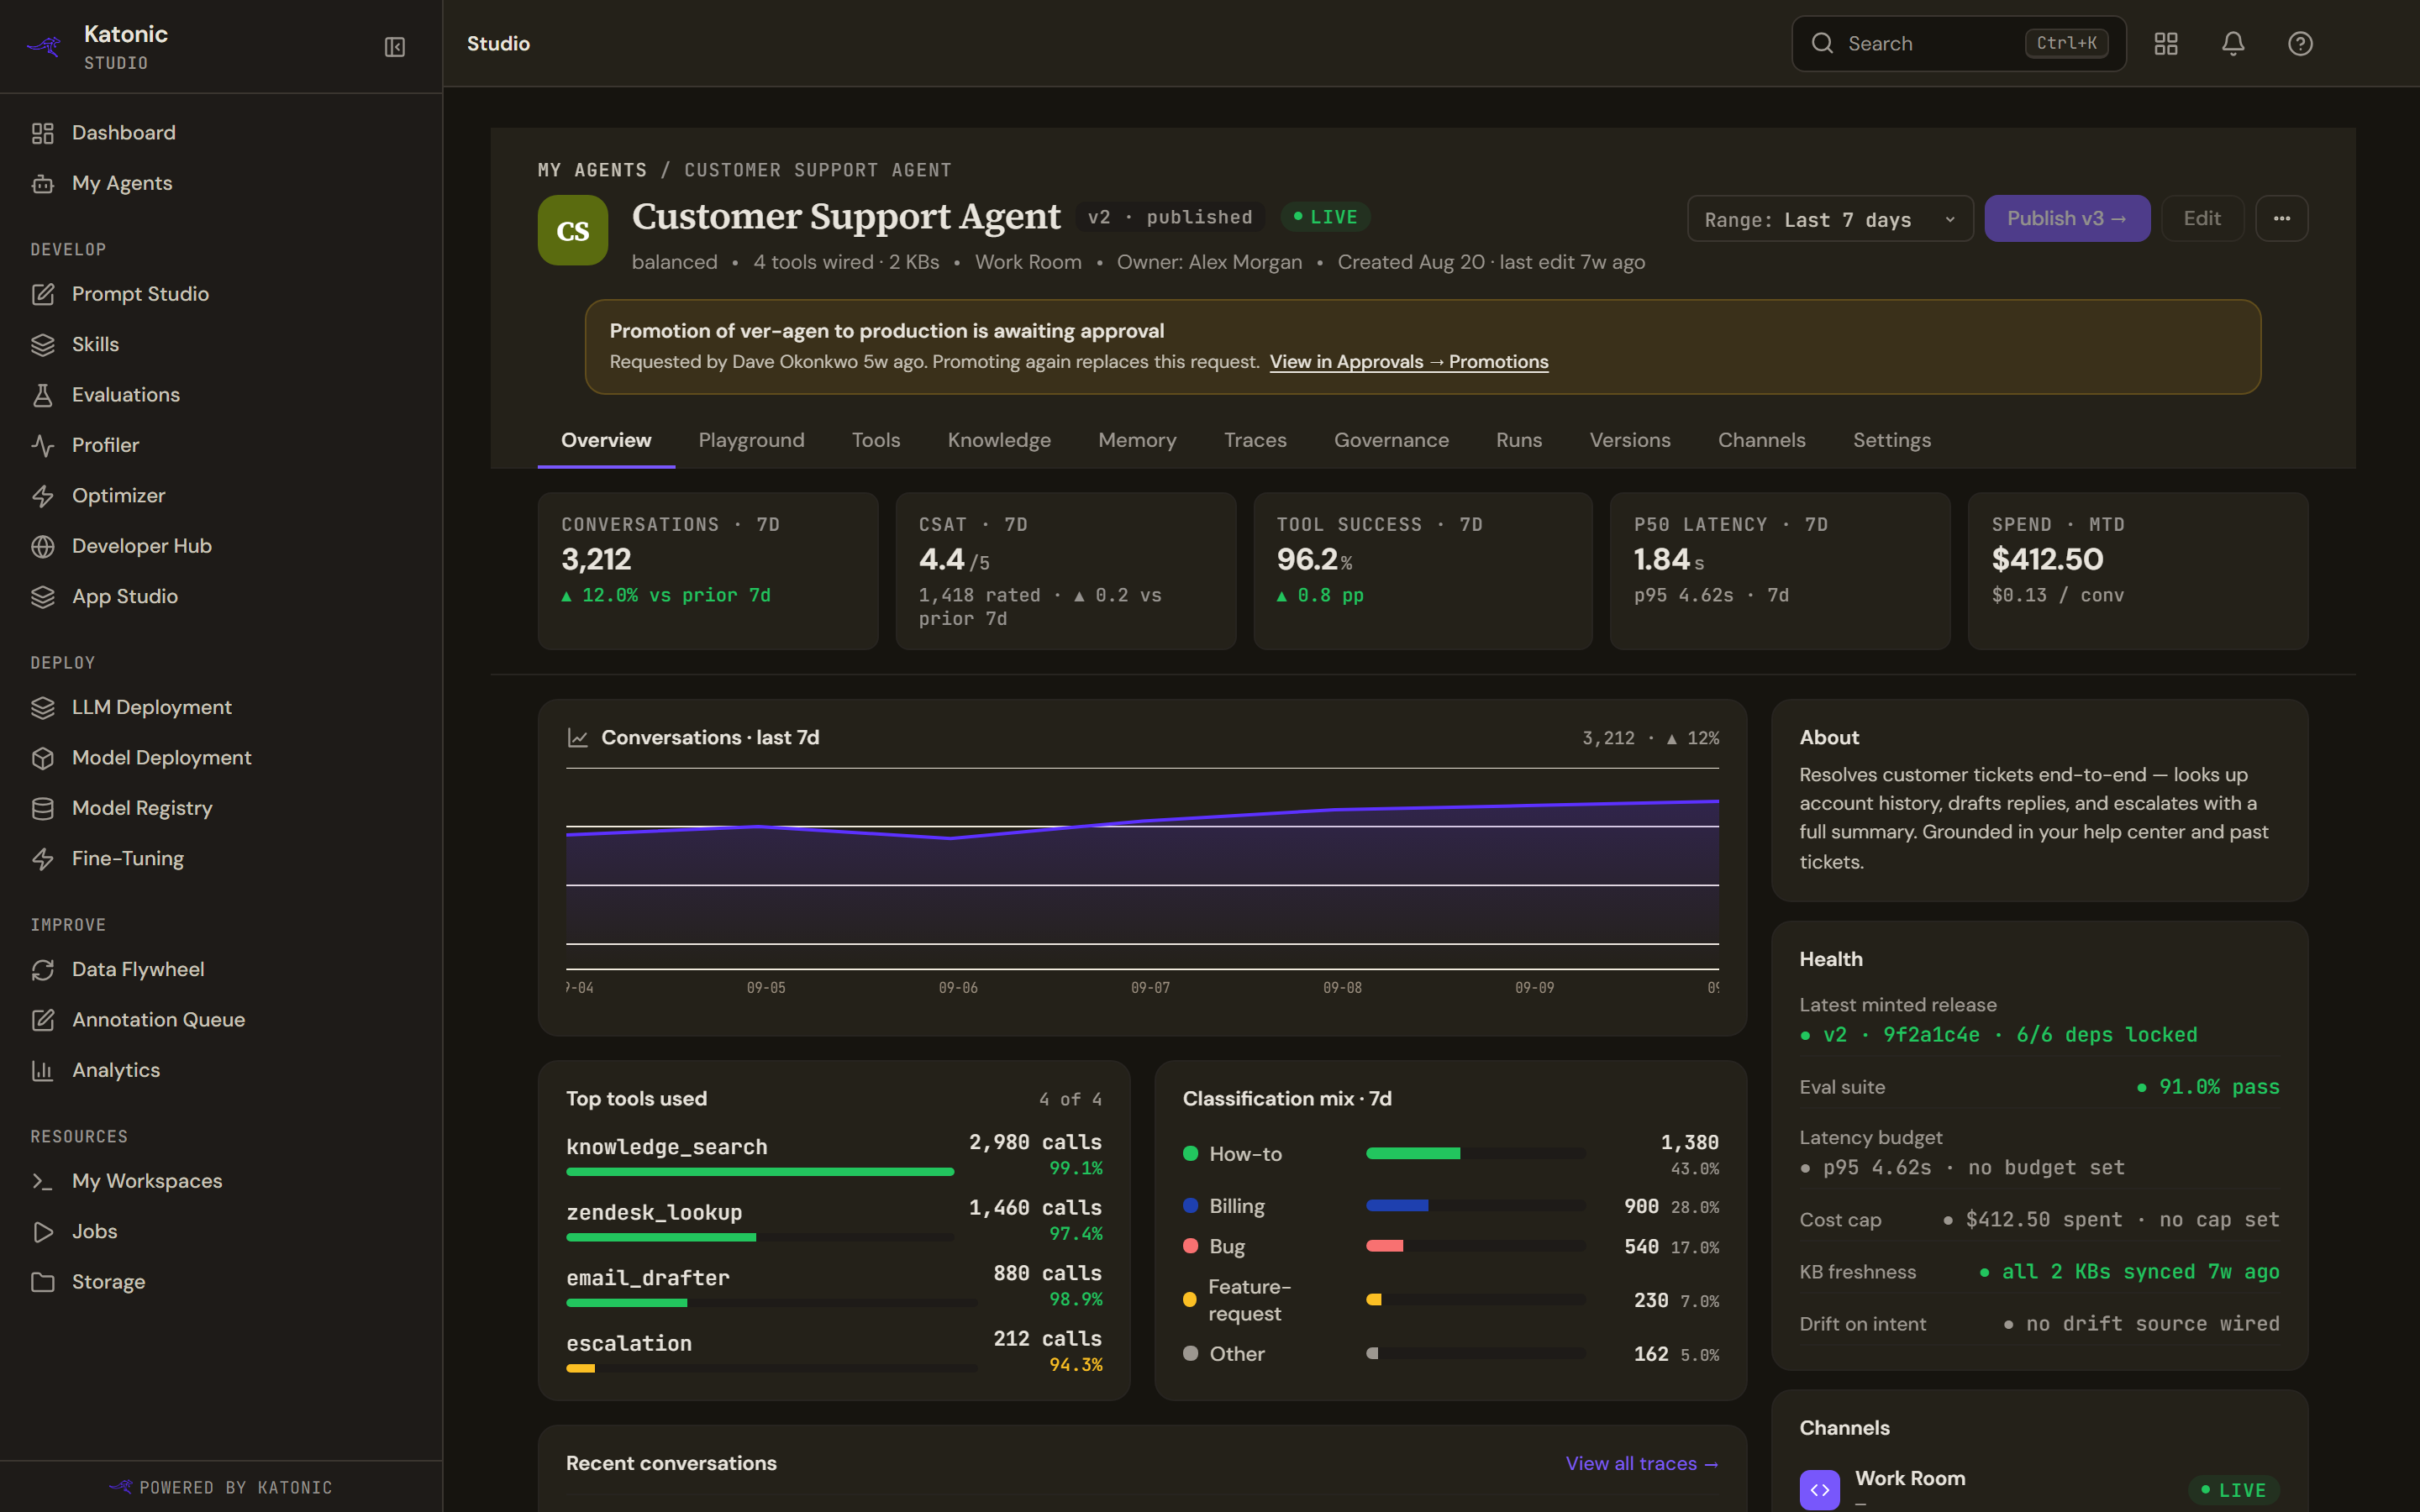
The chart plots conversations across the window. Top tools used ranks the tools by calls with their success rates.
Classification mix will be empty. No classifier is wired for any agent today, so the card says so rather than showing an empty chart.
Recent conversations lists the last sessions with their classification, turns, latency and outcome. Selecting one opens it in the Traces tab.
The health rail
Six rows, and it is worth knowing which of them can actually say something.
| Row | What it can report |
|---|---|
| Release | The release it was minted from, or that none was |
| Eval suite | A pass rate, or that no evaluation has run |
| Latency budget | The measured p95, and that no budget is set |
| Cost cap | The measured spend, and that no cap is set |
| KB freshness | When the attached knowledge bases last synced |
| Drift on intent | Nothing, ever |
Latency budget and cost cap have no setting anywhere to configure, so those rows report a measurement and state plainly that nothing is bounding it. They are deliberately neutral rather than green.
Drift on intent always reads that no drift source is wired. There is no monitoring service behind it.
The cost row adds unpriced with a count when the gateway could not price some calls. Read that as the spend being a floor.
Channels and activity
Channels lists where the agent answers, taken from the agent's own surfaces, with a live or draft pill. There are no per-channel figures anywhere in the platform, so the line under each reads as a dash.
Activity is the last few publishes, with who made each and when.