Agent performance
The Agents tab is the one that answers whether an agent is working, rather than what it cost.
The matrix
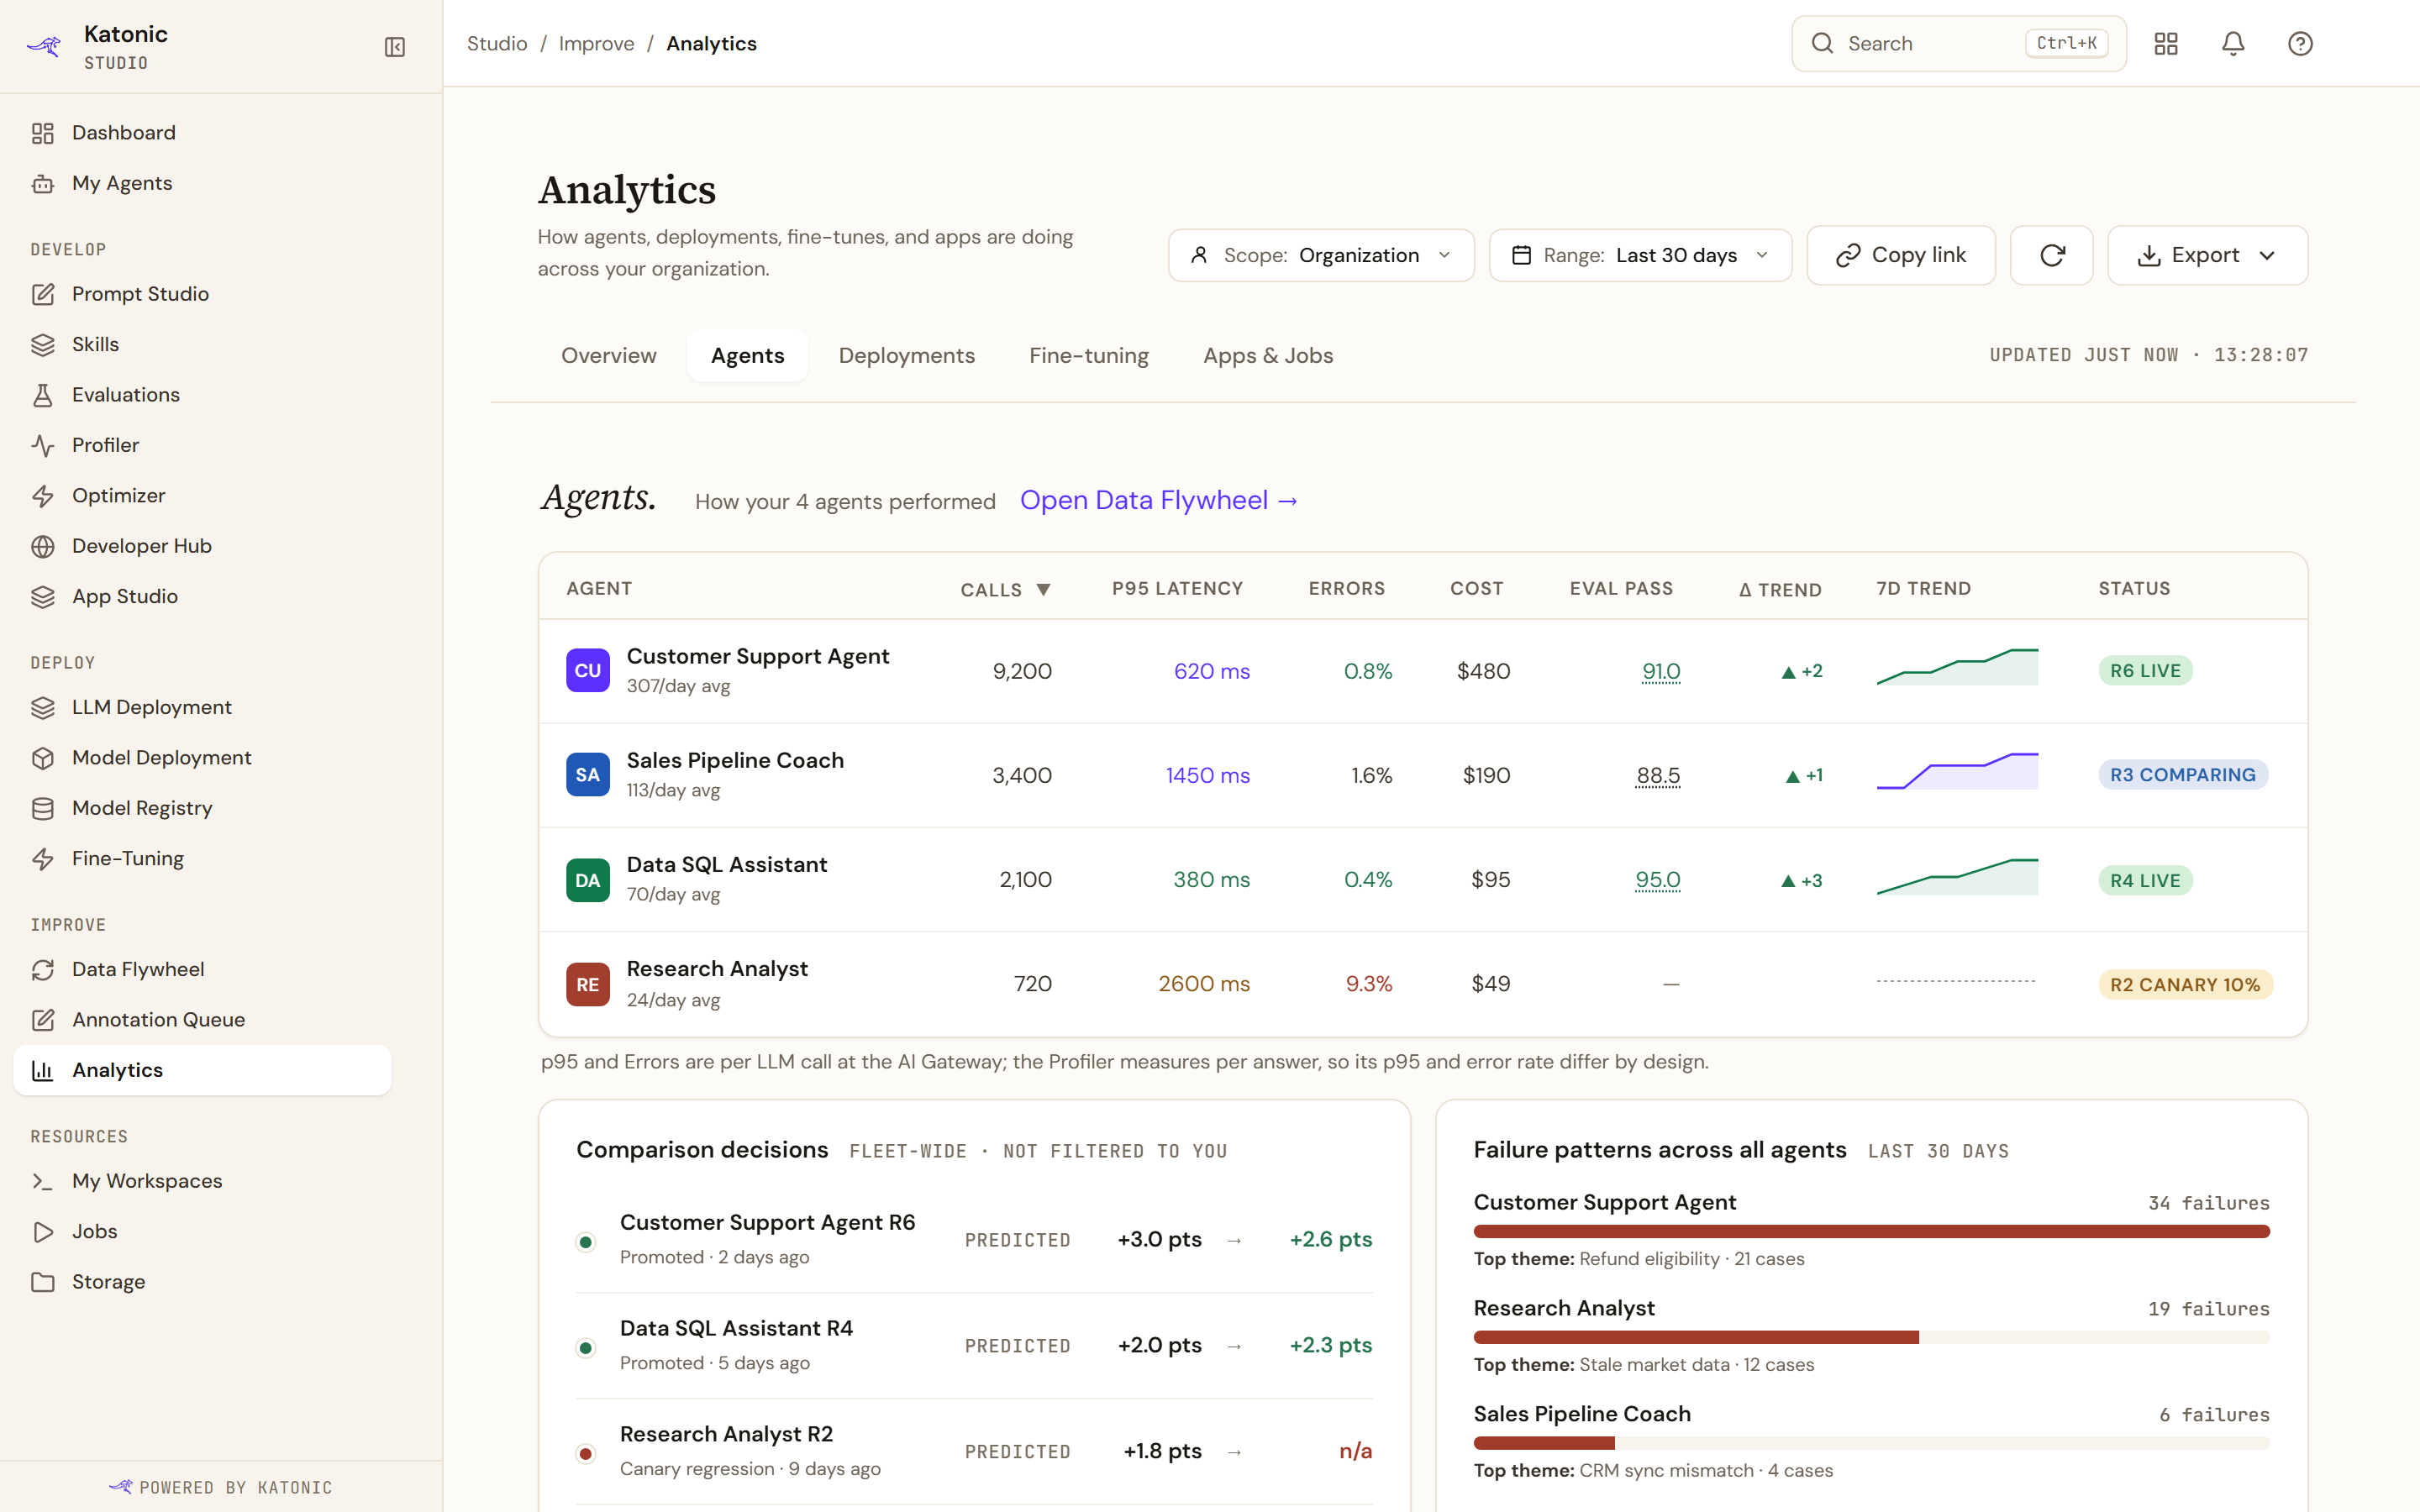
One row per agent, sortable by any numeric column, and clicking a row opens that agent.
The per-day figure divides an agent's calls by the days it was actually used, not by the length of the range, and carries both on hover, as 15 calls over 3 active day(s). Dividing by the range rounded a working agent down to 0/day avg, which read as an idle one.
| Column | What it holds |
|---|---|
| Agent | The agent, with its calls per active day |
| Calls | Calls in the range |
| p95 latency | The 95th percentile, and a link into the Profiler for that agent over the same range |
| Errors | The error rate as a percentage |
| Cost | Recorded inference cost, or a dash |
| Eval pass | The pass rate, converted from the judge's own scale |
| Δ trend | The change in evaluation score, in points |
| 7d trend | A line of the last seven days of evaluation score |
| Status | The round and stage the agent is at in the flywheel, or a dash if it has never been in one |
The trend column is always seven days, whatever range the page is on.
Spend the rows leave out
Under the matrix, or under its empty card when no agent is listed, up to two lines account for inference spend that has no row. Each gives its spend and its request count.
- "Not attributed to an agent" covers calls no agent made, such as embeddings, generated titles and direct API calls.
- "On agents not listed here" covers agents that were deleted or never registered, and agents you cannot open. On My work and My team it also covers your calls to agents outside that view.
A line appears only when it covers at least one request. The rows plus these lines equal the inference spend on the Overview tab, because both are measured in the same usage scope and window.
When activity cannot be read
If the platform cannot read its usage records, the tab says "Agent activity couldn't be read just now, so this is not a zero. Try Refresh in a moment." and the usage figures show a dash, meaning unavailable, rather than a zero. Press Refresh after a moment.
My comparison decisions
Each decision the platform has a record of, with what lift was predicted against what actually happened, and how long ago it was decided.
Two summary figures sit at the foot. Calibration is the share of decisions where the prediction was close, which means within thirty percent of the real number or half a point of it. Over-confident counts the decisions that promised more than they delivered.
One caveat matters. The card is titled as yours, and the data behind it is not filtered to you. It is the whole tenant's decisions. Per-person attribution is not built.
Failure patterns
A bar per agent showing how many failures were clustered out of its traces, with the biggest theme named and counted.
Where it is empty, the text is careful to give both possible reasons: either there were no failures, or the clustering job has not run. That job is not on a schedule on most clusters, so an empty card is more often the second than the first. See Data Flywheel.