Deployments, fine-tunes and apps
Three tabs cover the things you run rather than the agents you build. All three are served by the deployment service, and all three stay scoped to your own resources even in team scope, because the platform has no team dimension for them.
Deployments
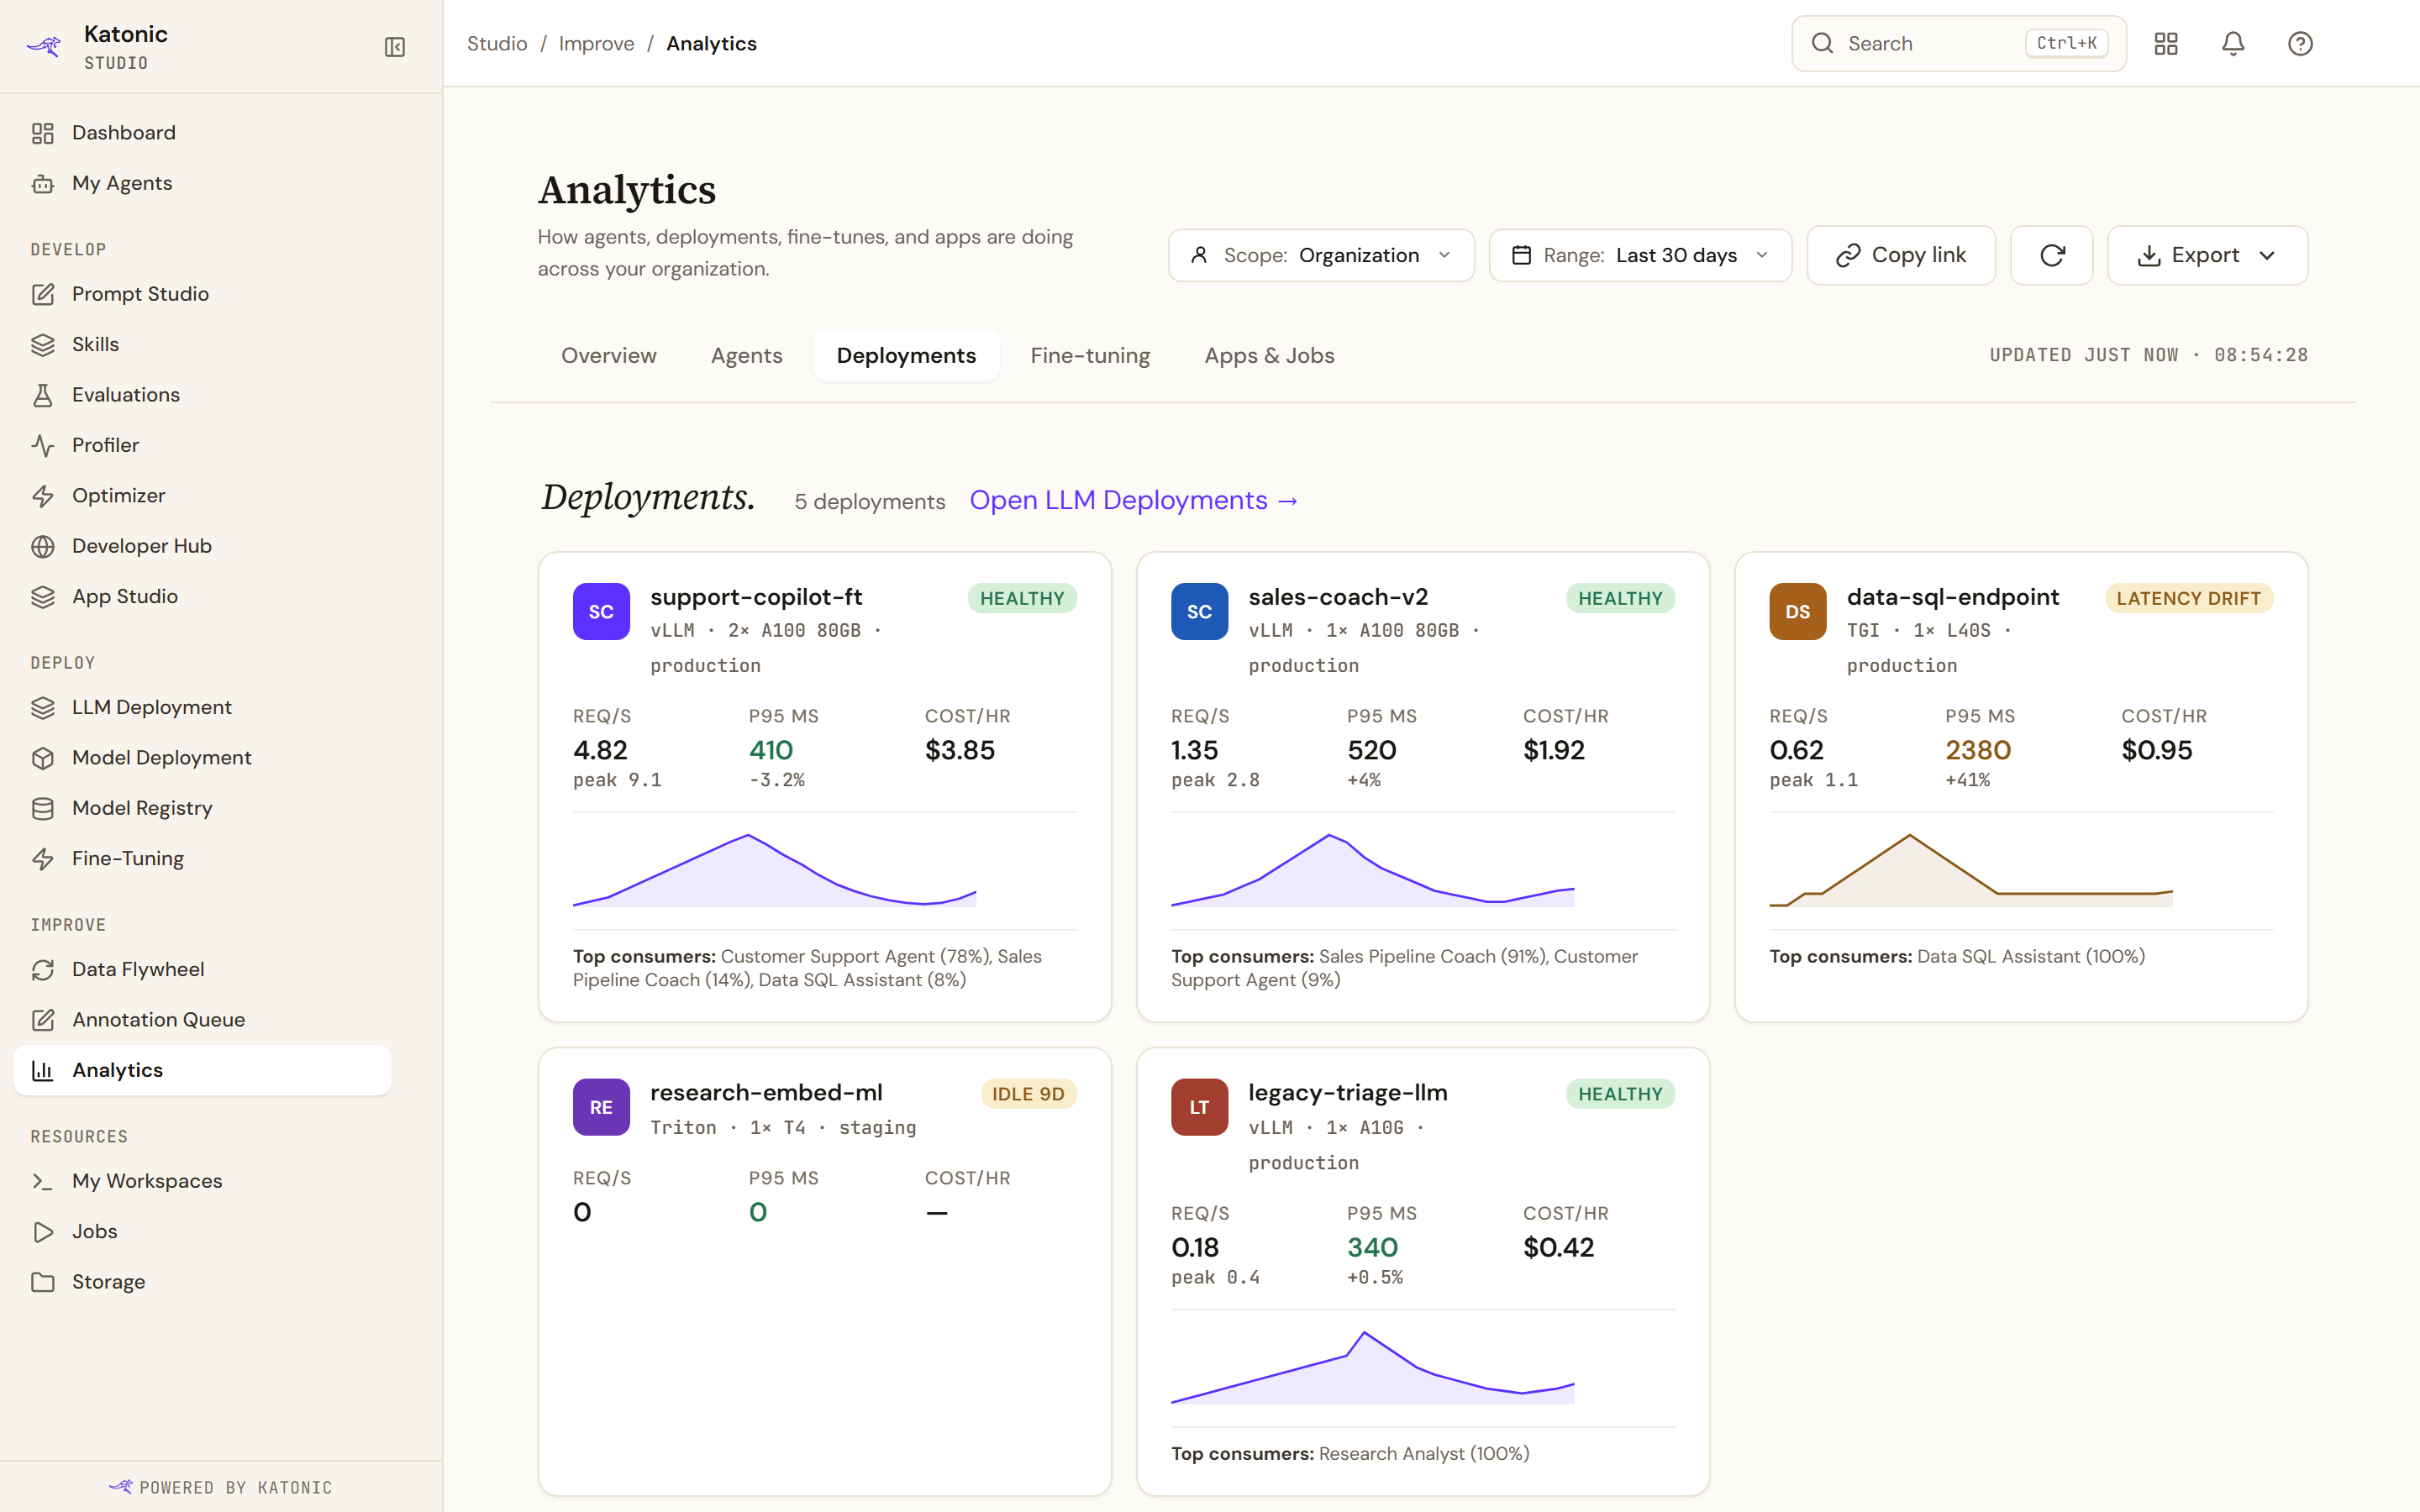
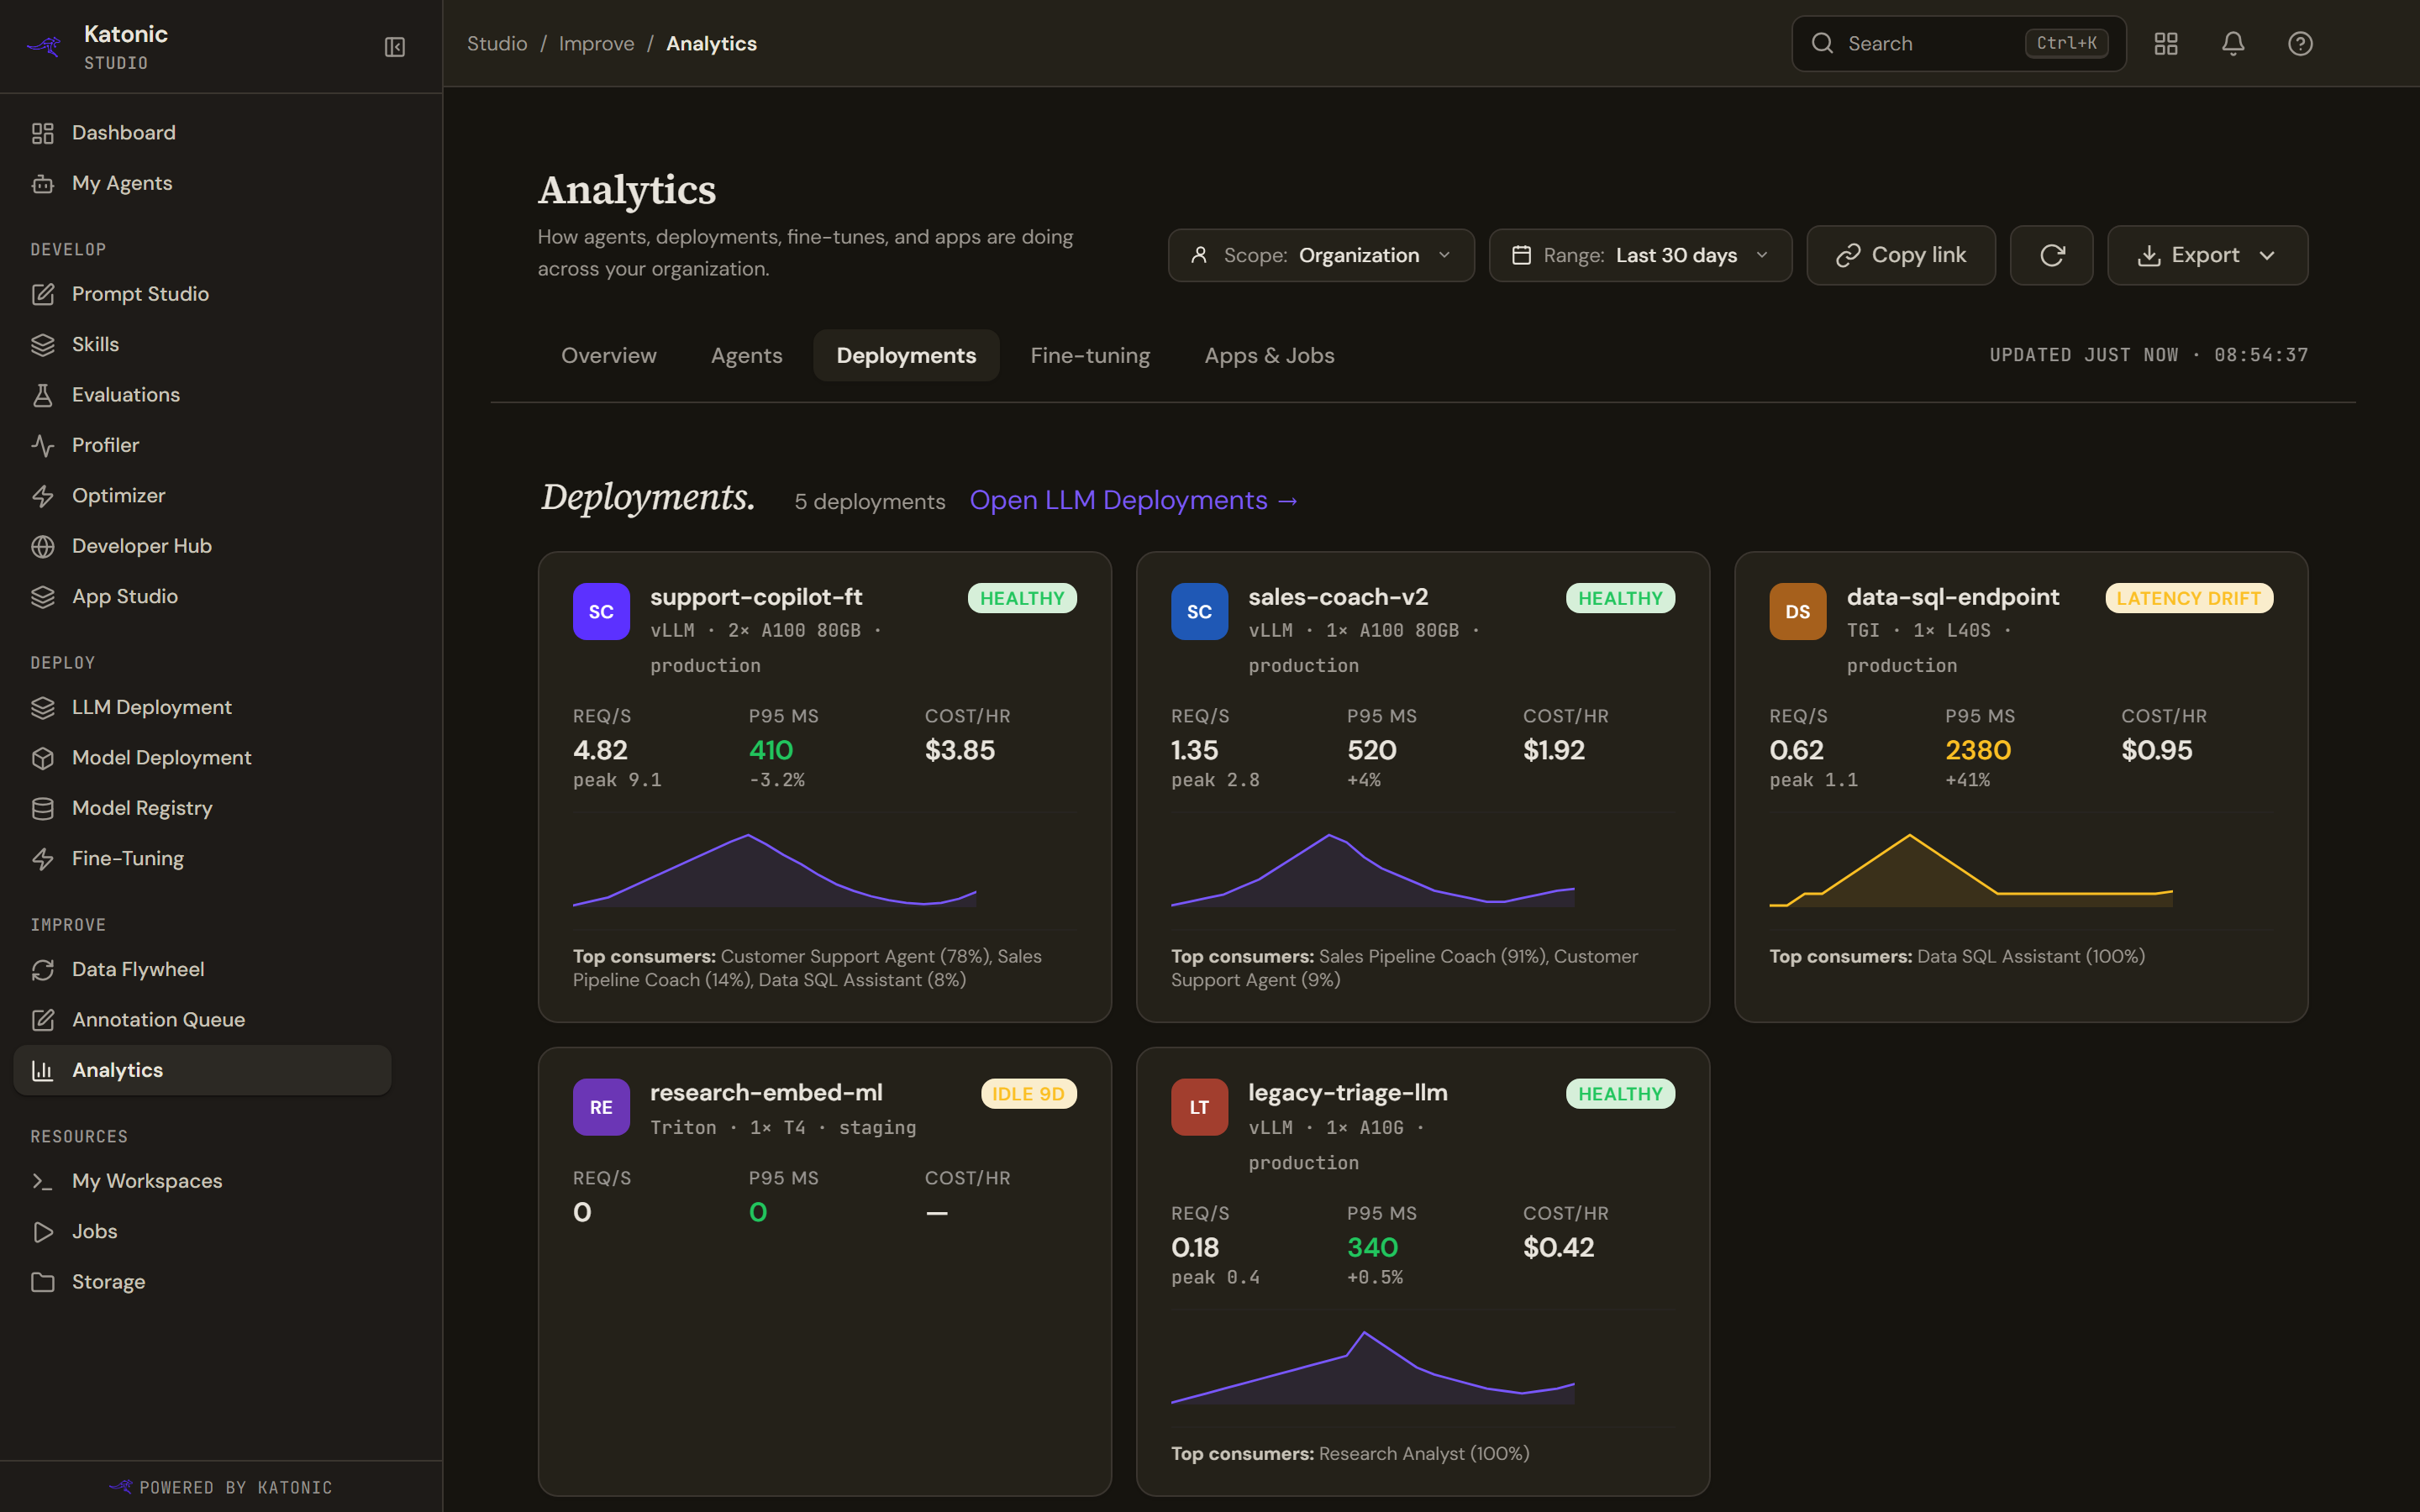
A card per deployment, with requests a second, p95 latency and cost an hour, a traffic line, the agents consuming it with their share, and a health pill reading Healthy, Idle, No traffic or Latency drift.
Cost an hour is real. It is the recorded cost of the calls that deployment served across the range, divided by the hours in the range. Where there is nothing to divide it shows a dash rather than a convincing zero. p95 latency has no such dash: a deployment that served nothing in the range reads 0, which means no traffic, not a fast response.
Two things on the card never appear. The peak figure beside requests a second is always zero on the path the platform actually uses, and the drift percentages are never computed there either.
Where a deployment has been idle for a week and is costing more than ten dollars a day, the card suggests scaling it to zero and names the saving.
A card opens the deployment. A model deployment has no page of its own, so it opens the list instead.
Fine-tuning
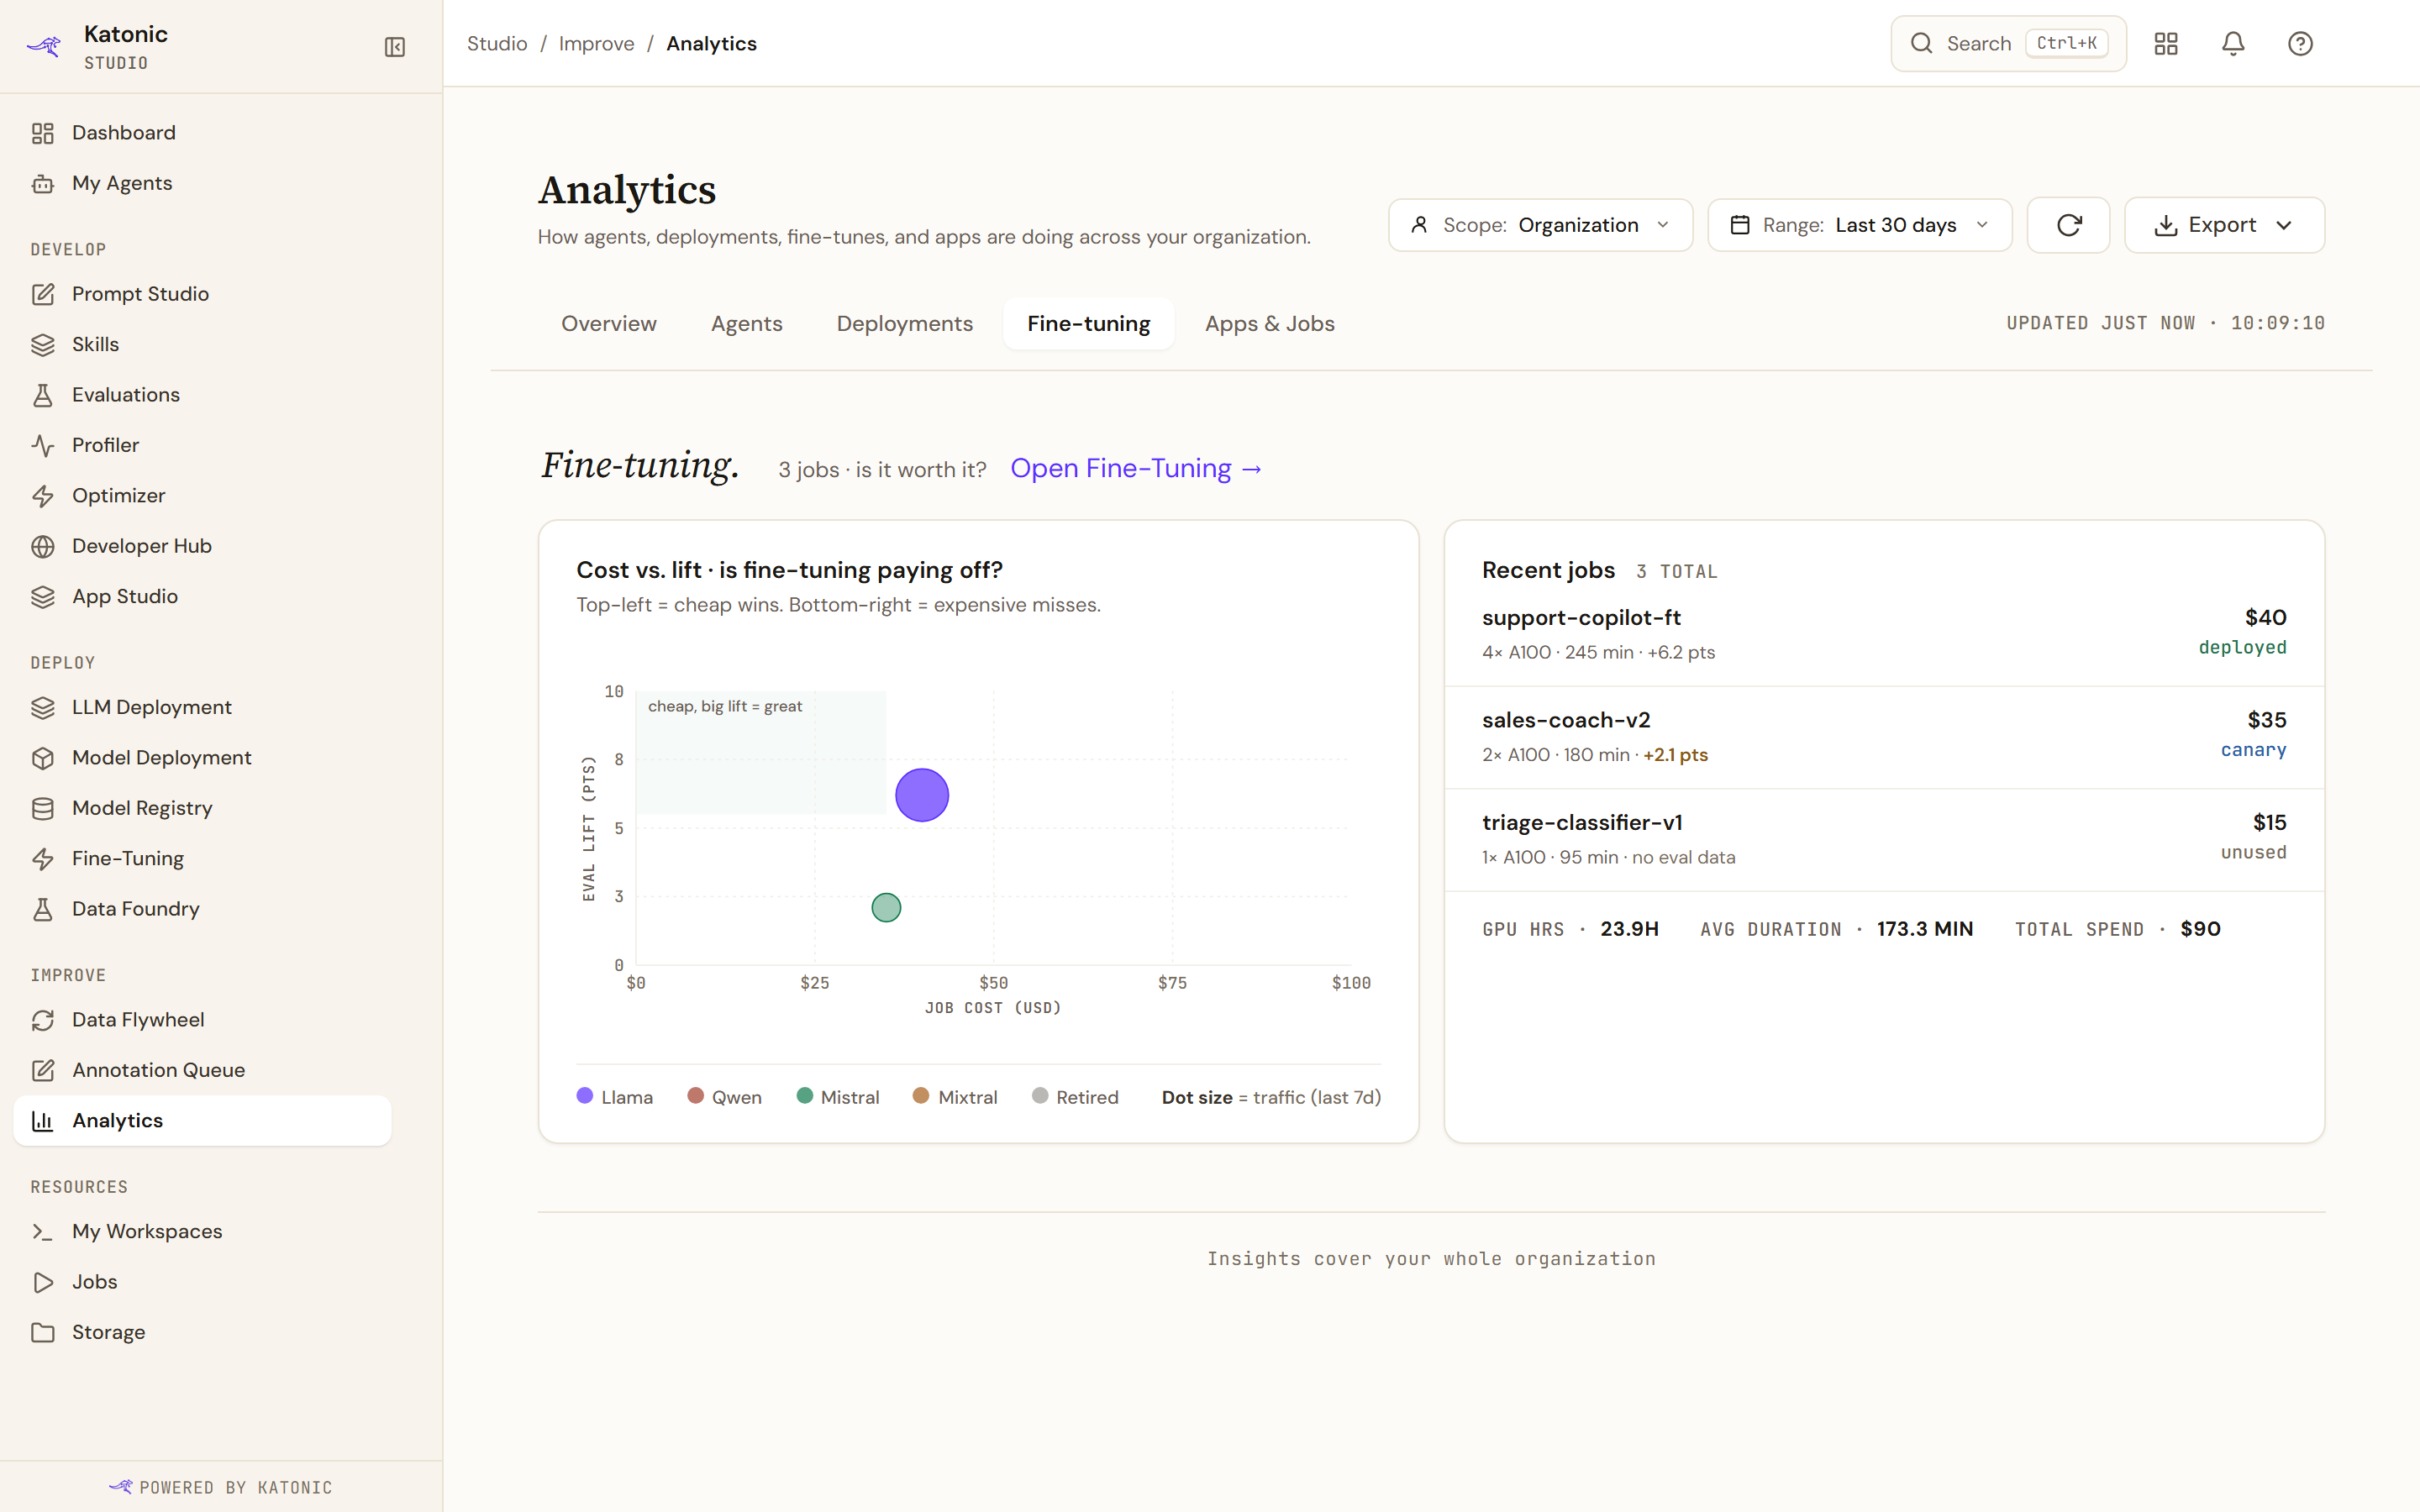
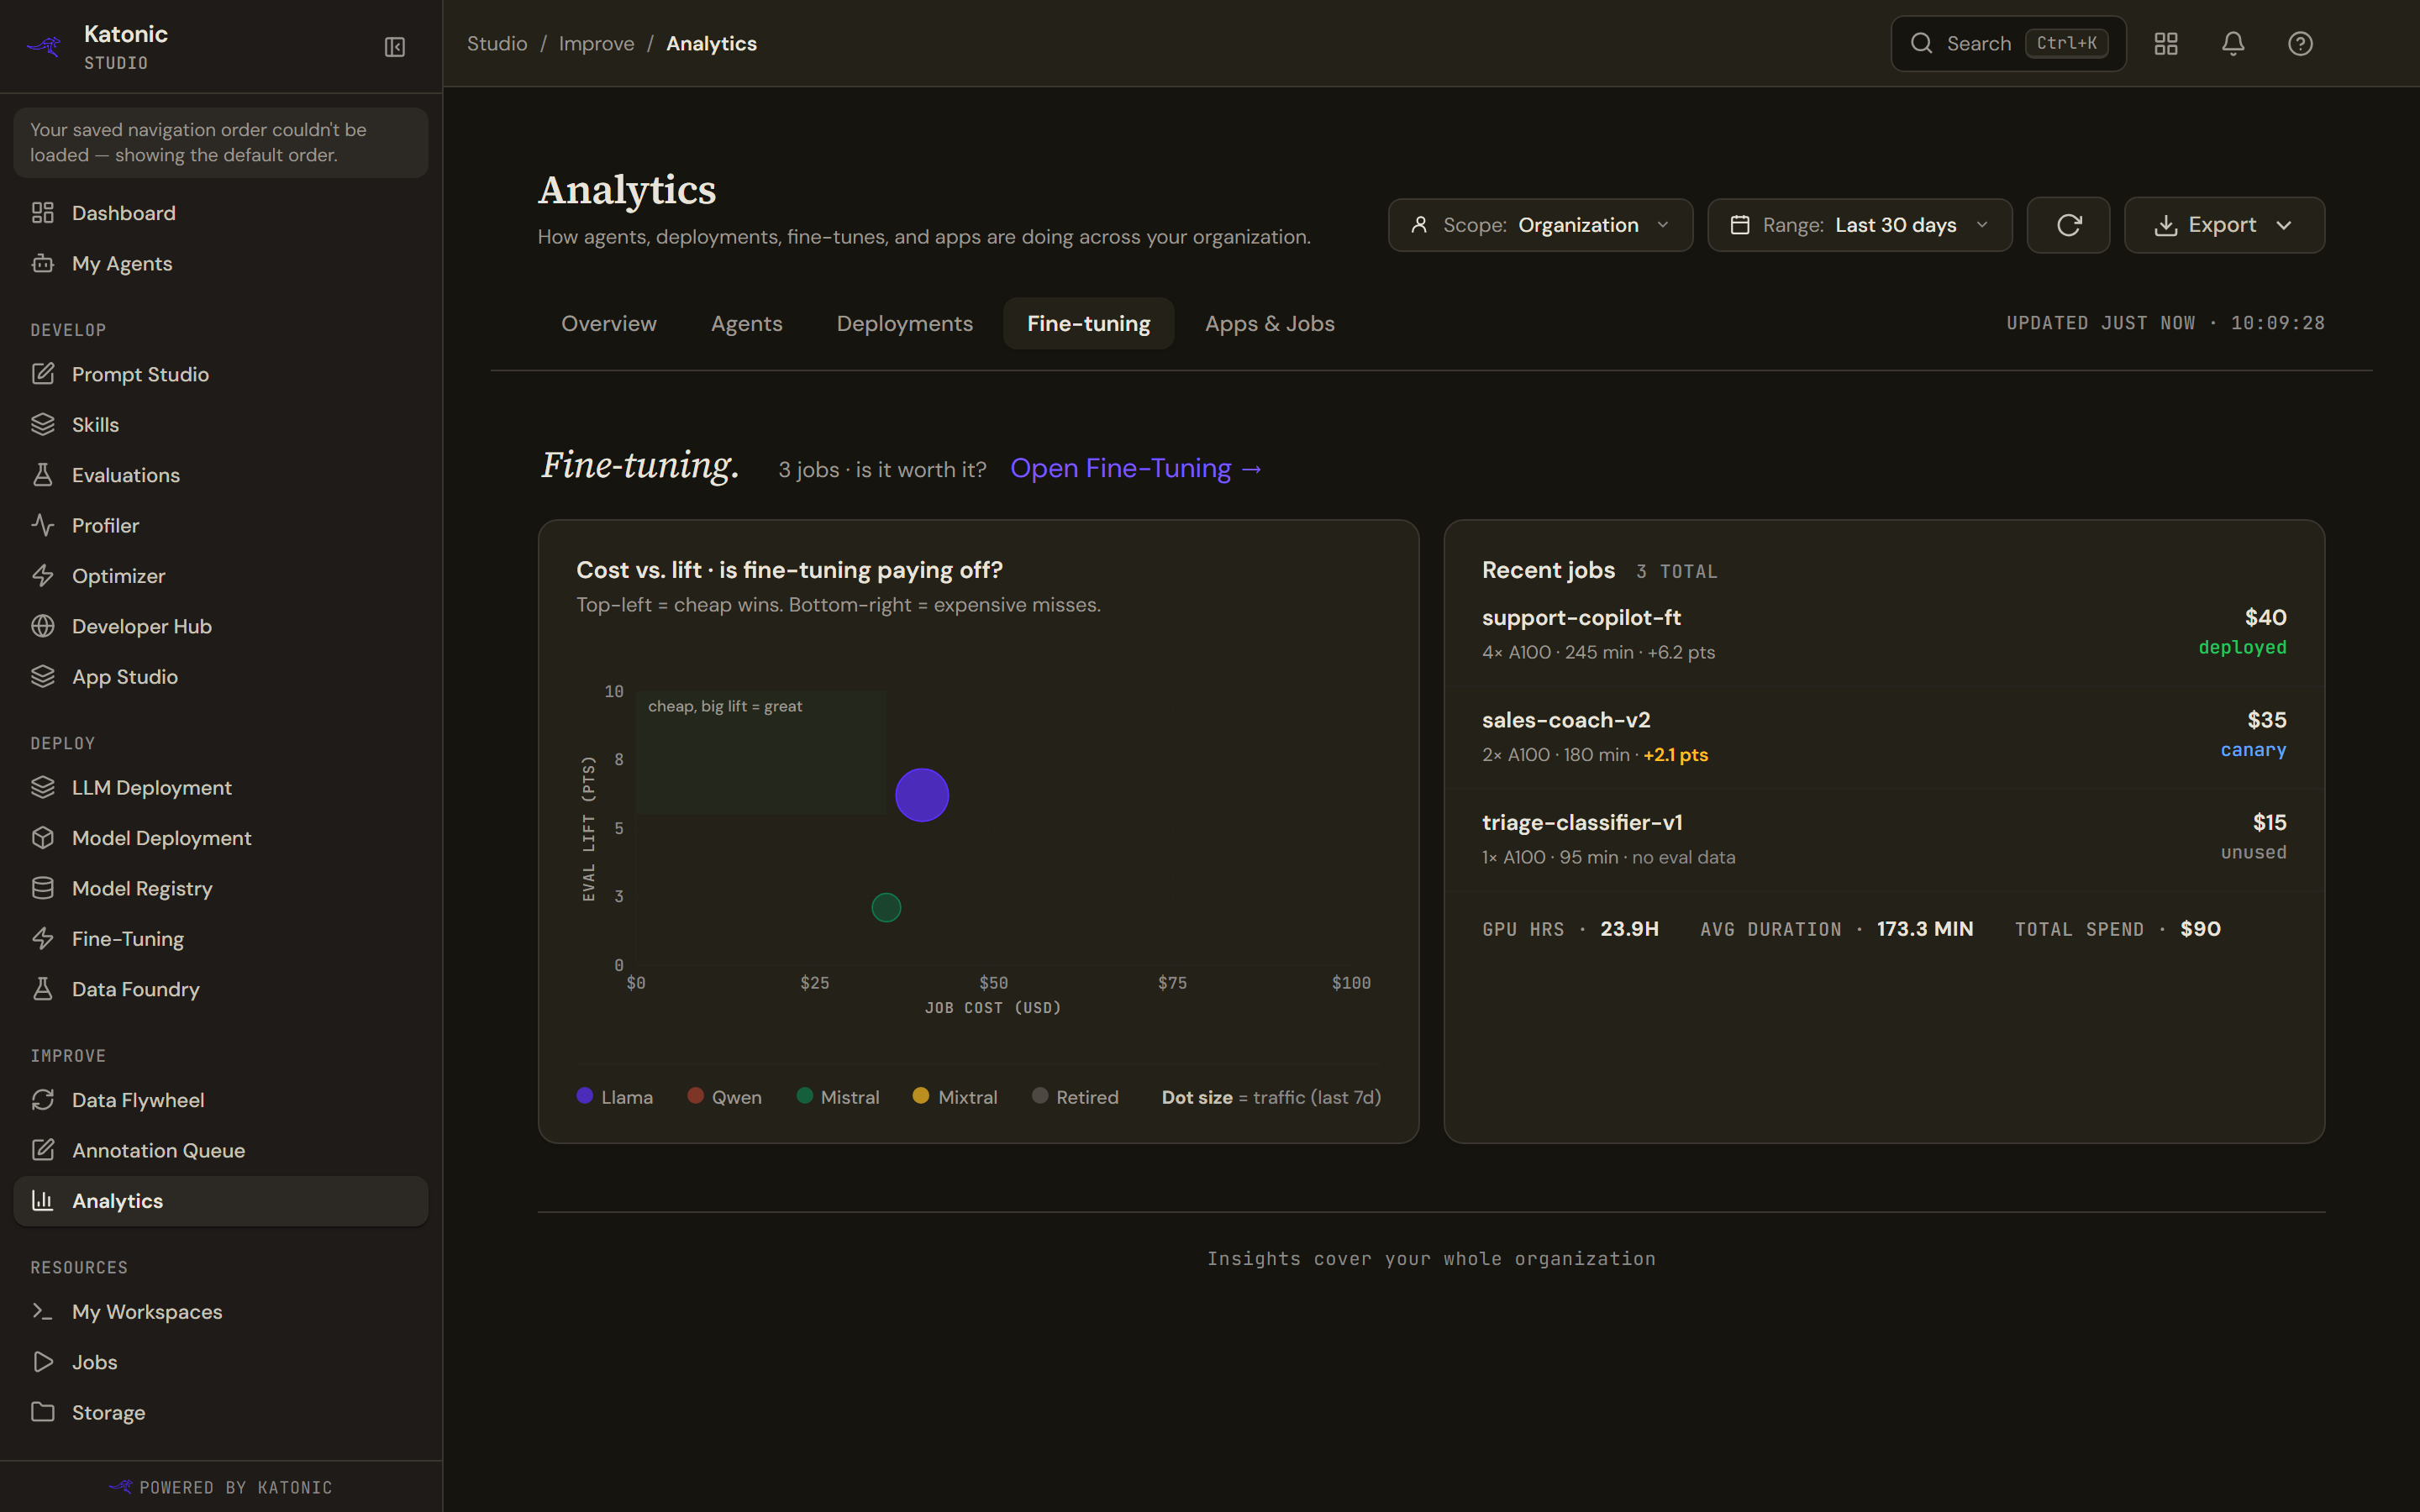
The chart asks whether a job was worth it: cost along the bottom, evaluation lift up the side, one dot per job, coloured by model family. The good corner, cheap and effective, is shaded. A dot's size is the agent's share of traffic over seven days, and that stays seven days even when the page is on ninety, which the caption says outright.
Under it, the last eight jobs with their GPU, duration, lift, cost and whether the result was deployed. Then three totals: GPU hours, average duration and total spend.
The heading counts the jobs that actually ran and says how many it left out. A retired job that never started, which is zero minutes long, is not a fine-tune job for this purpose; counting it gave a header reading one job over a chart with no dots in it.
A job with no lift reads no eval data rather than zero. Where jobs exist but none could be tied to an evaluation, the chart says the attribution is not built yet instead of showing an empty chart, which is a different claim.
Apps and jobs
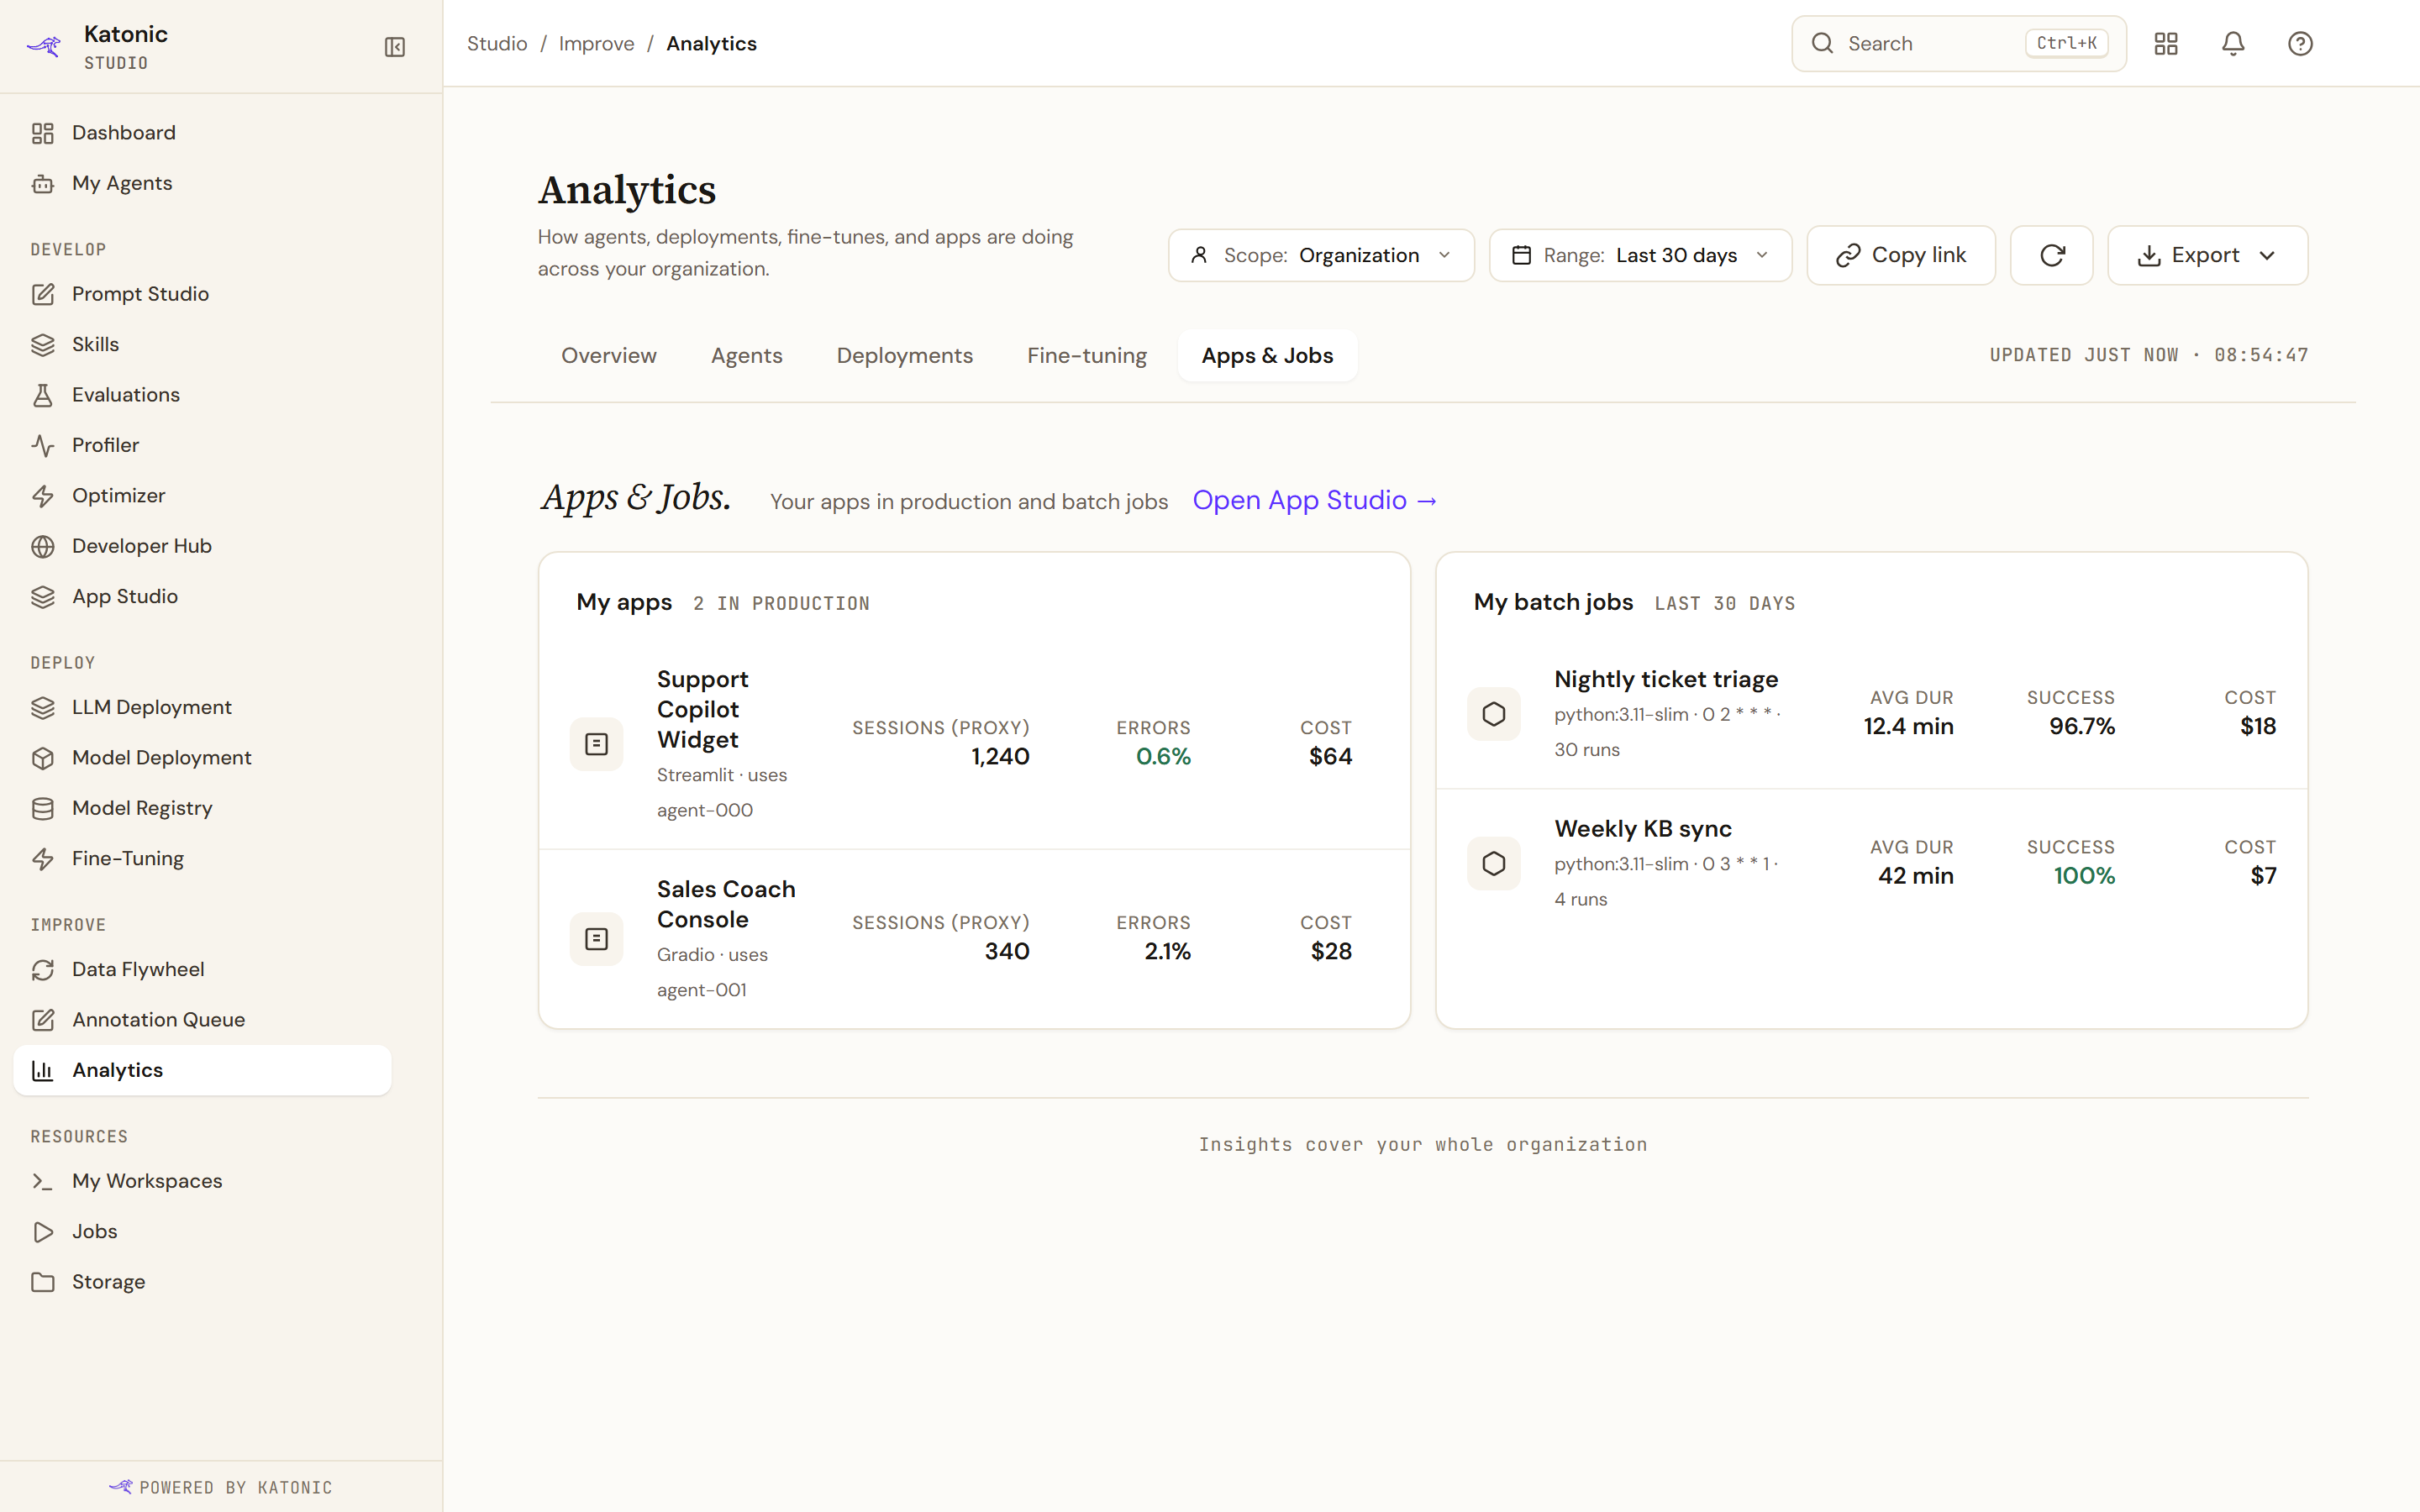
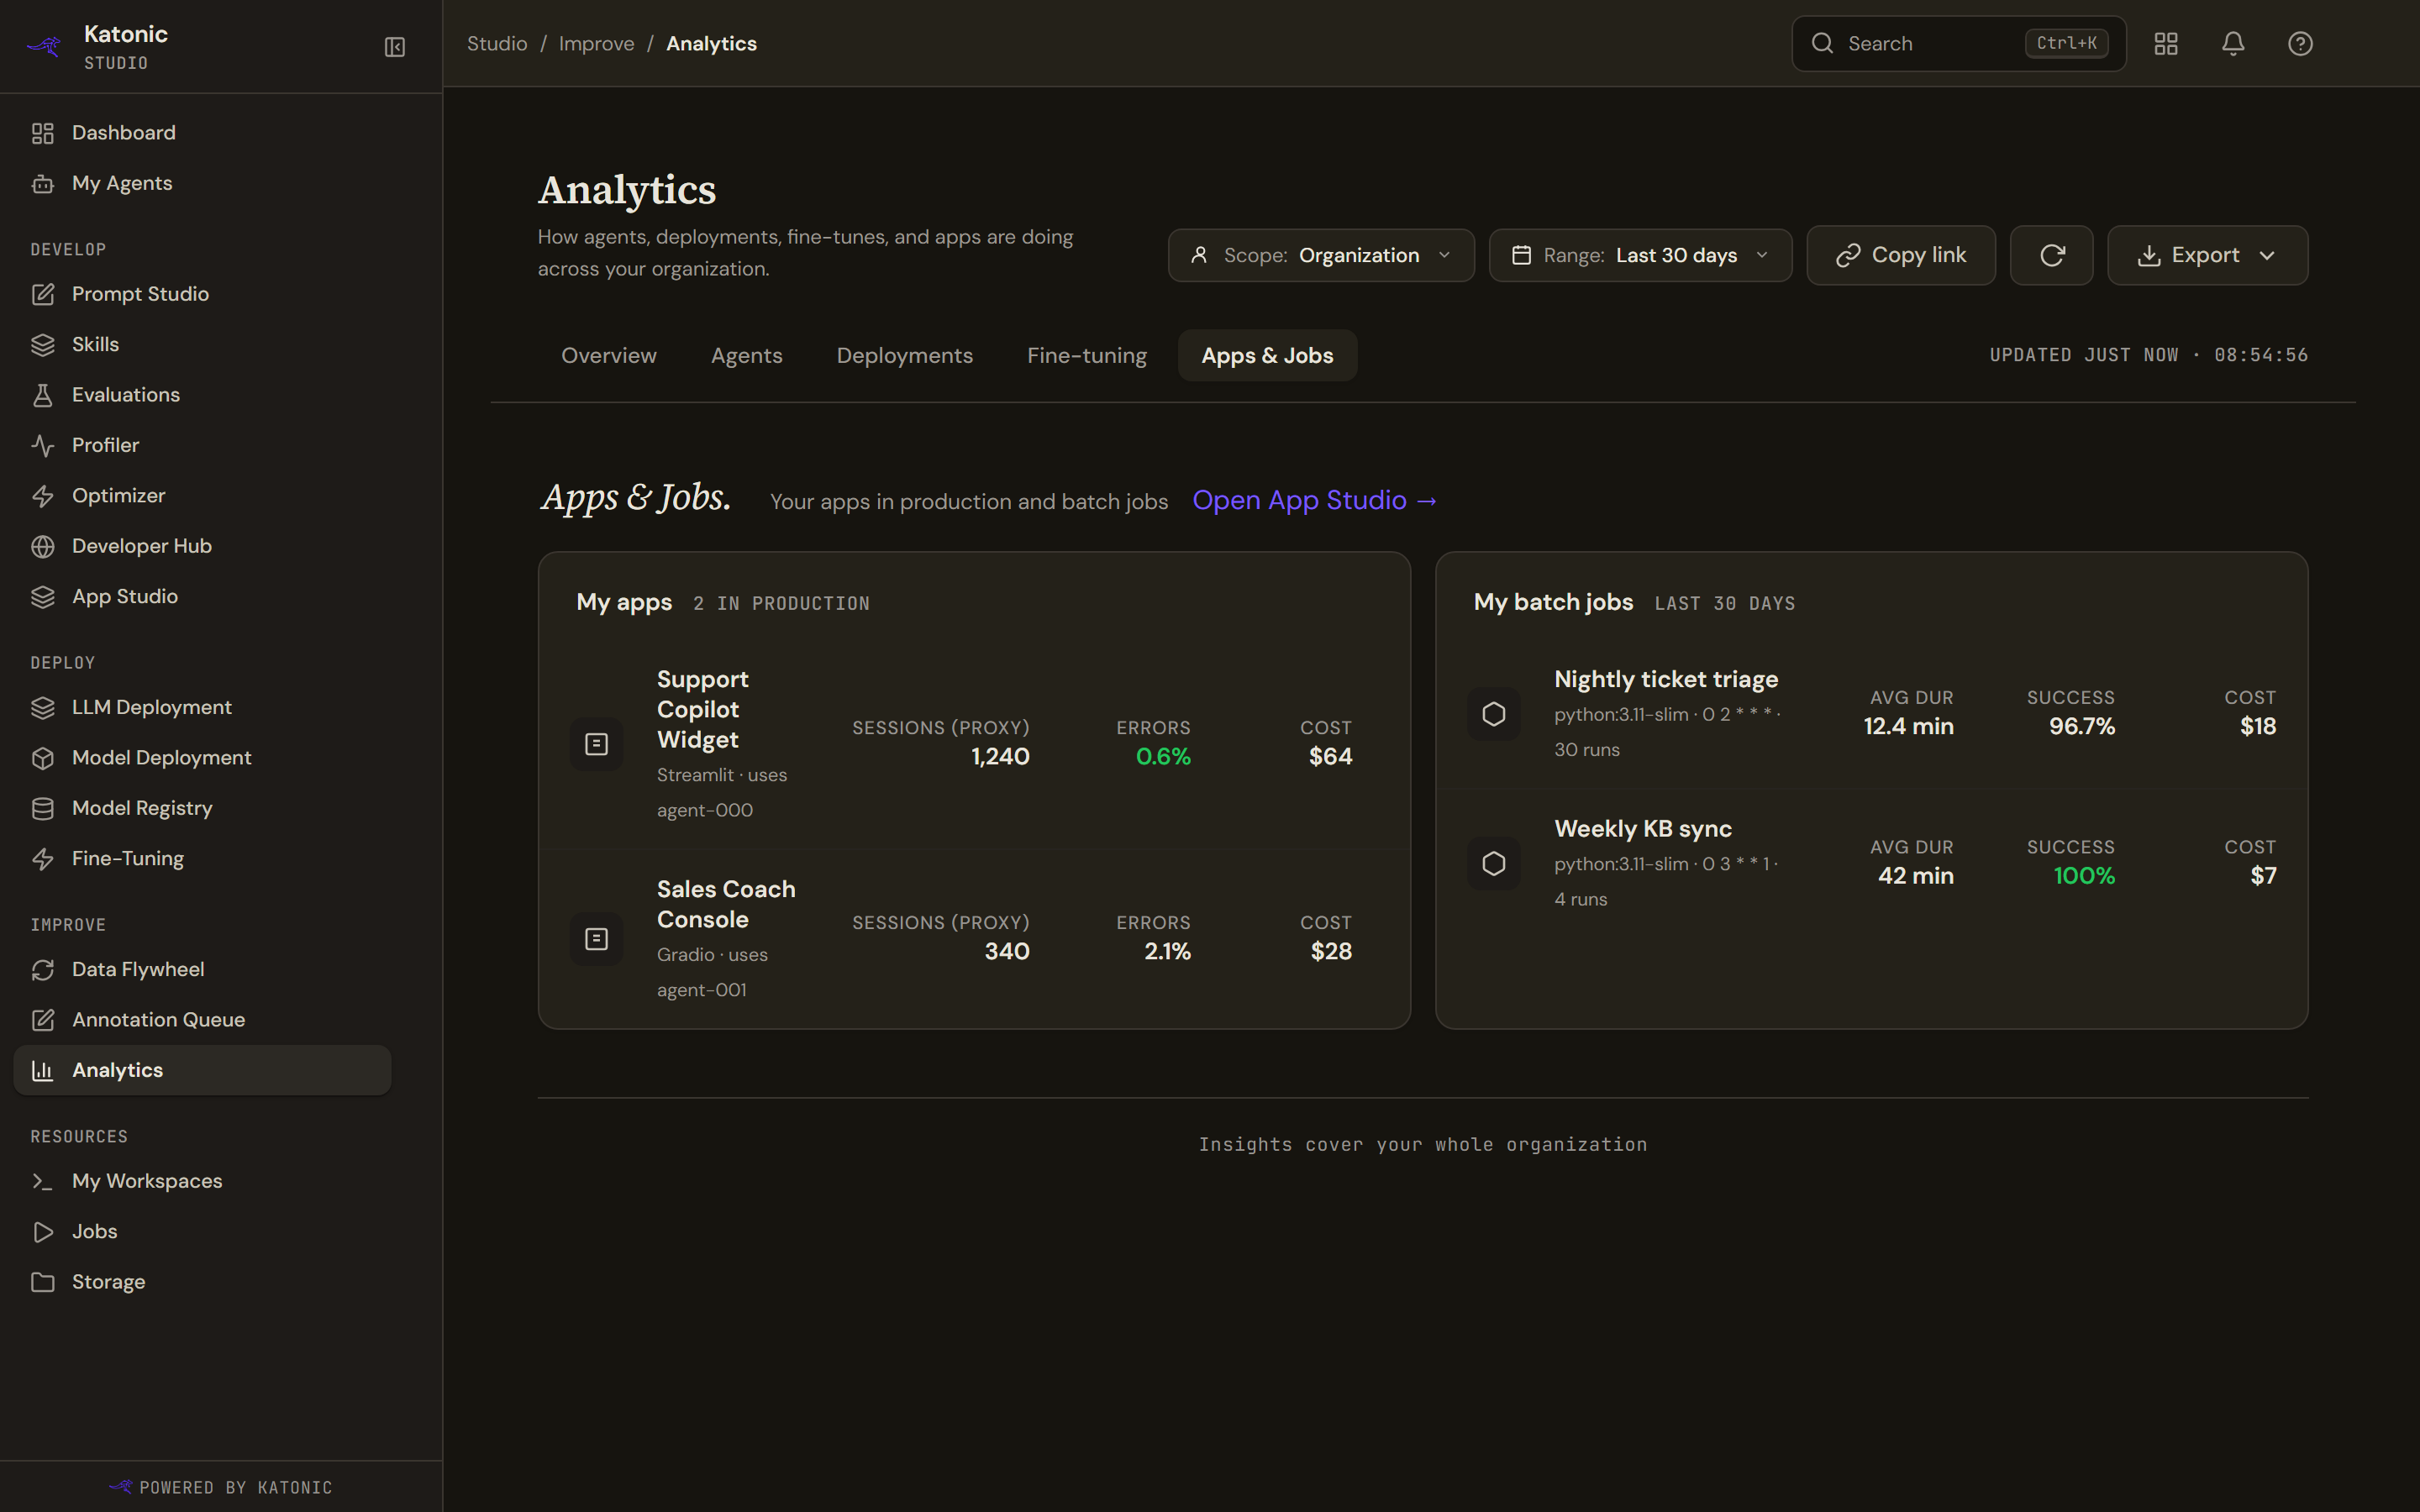
Two lists side by side. Apps give sessions, error rate and cost. Batch jobs give average duration, success rate and cost.
The apps list has no monthly active users, and will not have. That number is stubbed in the platform, so the column is hidden and Sessions stands in for it, marked (proxy). A session here is a distinct session identifier seen on the linked agent, which is a reasonable stand-in for people using the app and is not the same thing.
When the deployment service is down
Each of the three tabs distinguishes an empty result from an unreachable service. Empty says you have none. Unreachable says the section is incomplete and to try again shortly. That difference is worth reading before you conclude anything from a short list.