Spend and the overview
The Overview tab is six numbers and one chart. Half the value of the page is knowing which of those numbers the platform measured and which it worked out from a price list.
The tiles
| Tile | What it counts |
|---|---|
| Agents used | Agents of yours that were actually called in the range, against how many you own |
| Deployments | Your LLM and model deployments |
| Fine-tune jobs | Fine-tune jobs started in the range |
| Apps in prod | Your apps currently running |
| LLM calls | Calls recorded against your agents in the range |
| My spend | The four cost categories added together |
The spend tile is named for the scope, so it reads Team spend or Org spend when you widen it. Its delta is coloured the other way round from the rest: going up is not good news.
A tile carries a small trend line where the platform sends a daily series for it, and blank space where it does not. Agents used never has one.
A tile that reads a dash rather than a number means the service that owns it could not be reached, or the usage figures could not be read just now. It is deliberately not a zero, because a zero would read as a fact.
The deltas
Each tile compares the range with the same number of whole days just before it.
- A count that did not change reads no change. Hover it to see "Prior window: N", the earlier figure.
- A change too large to print reads >999% with an up or down arrow. Hover it for the exact percentage, then the prior value.
- A fall is written with a true minus sign, not a hyphen.
The spend chart
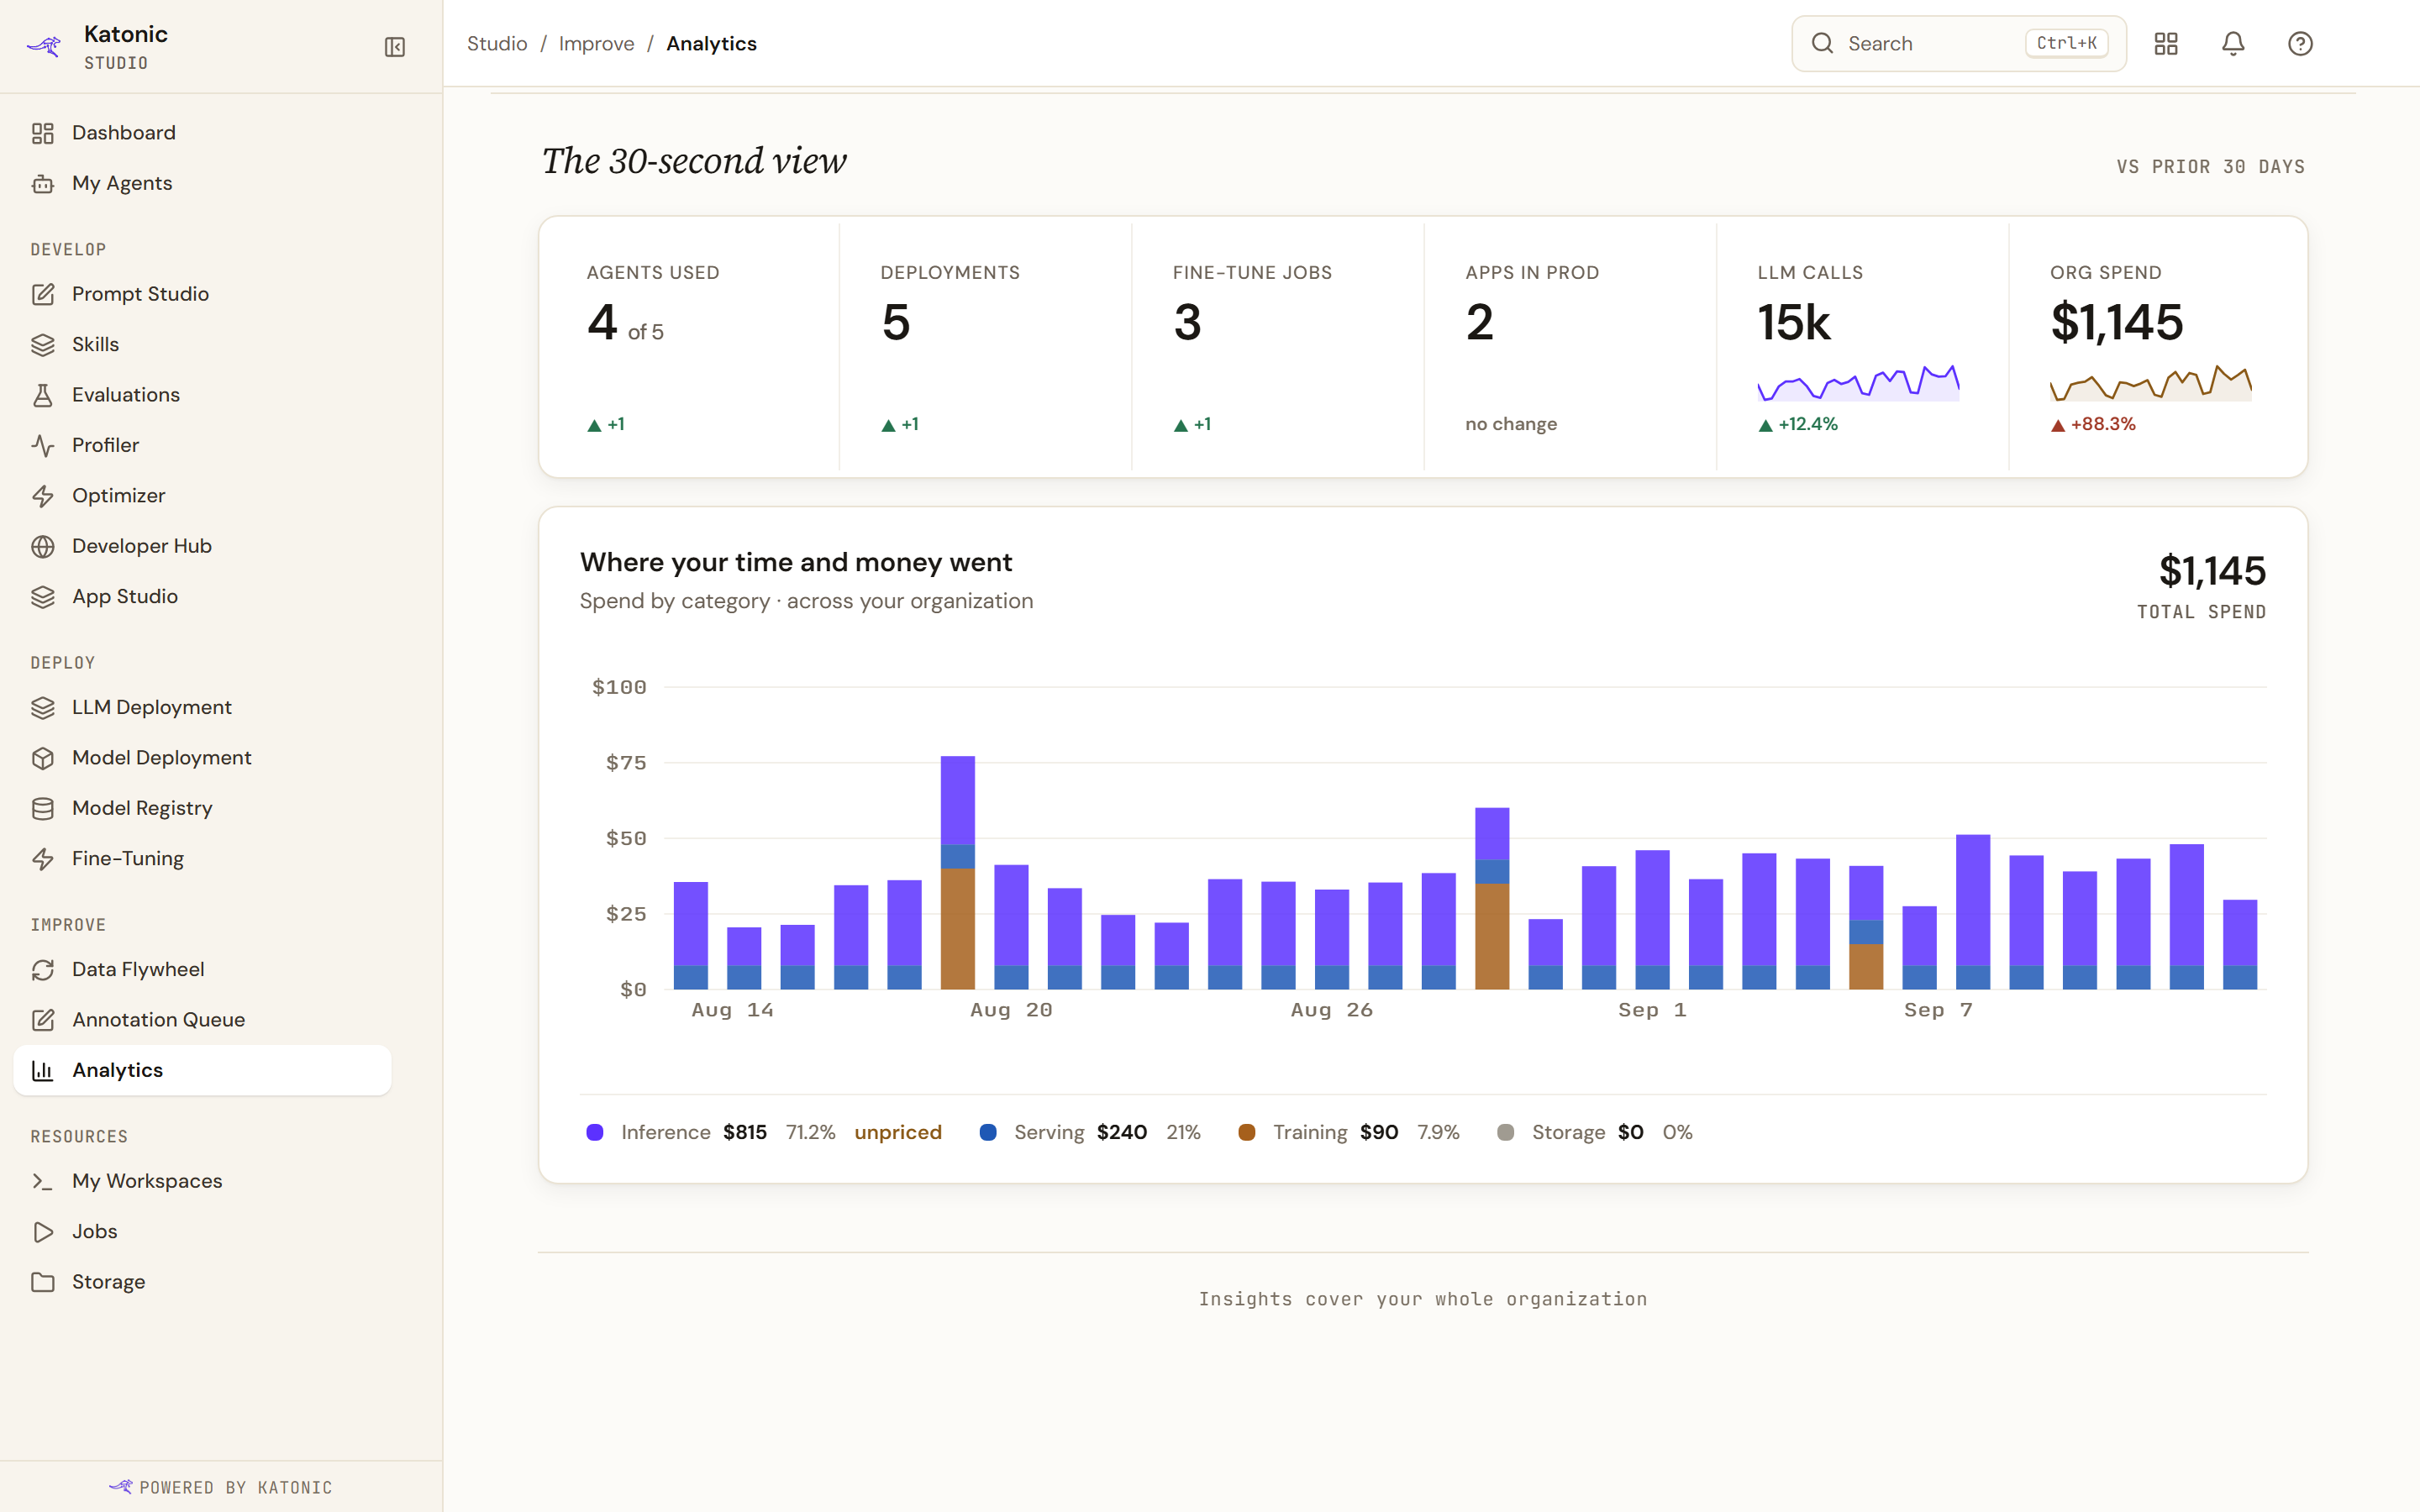
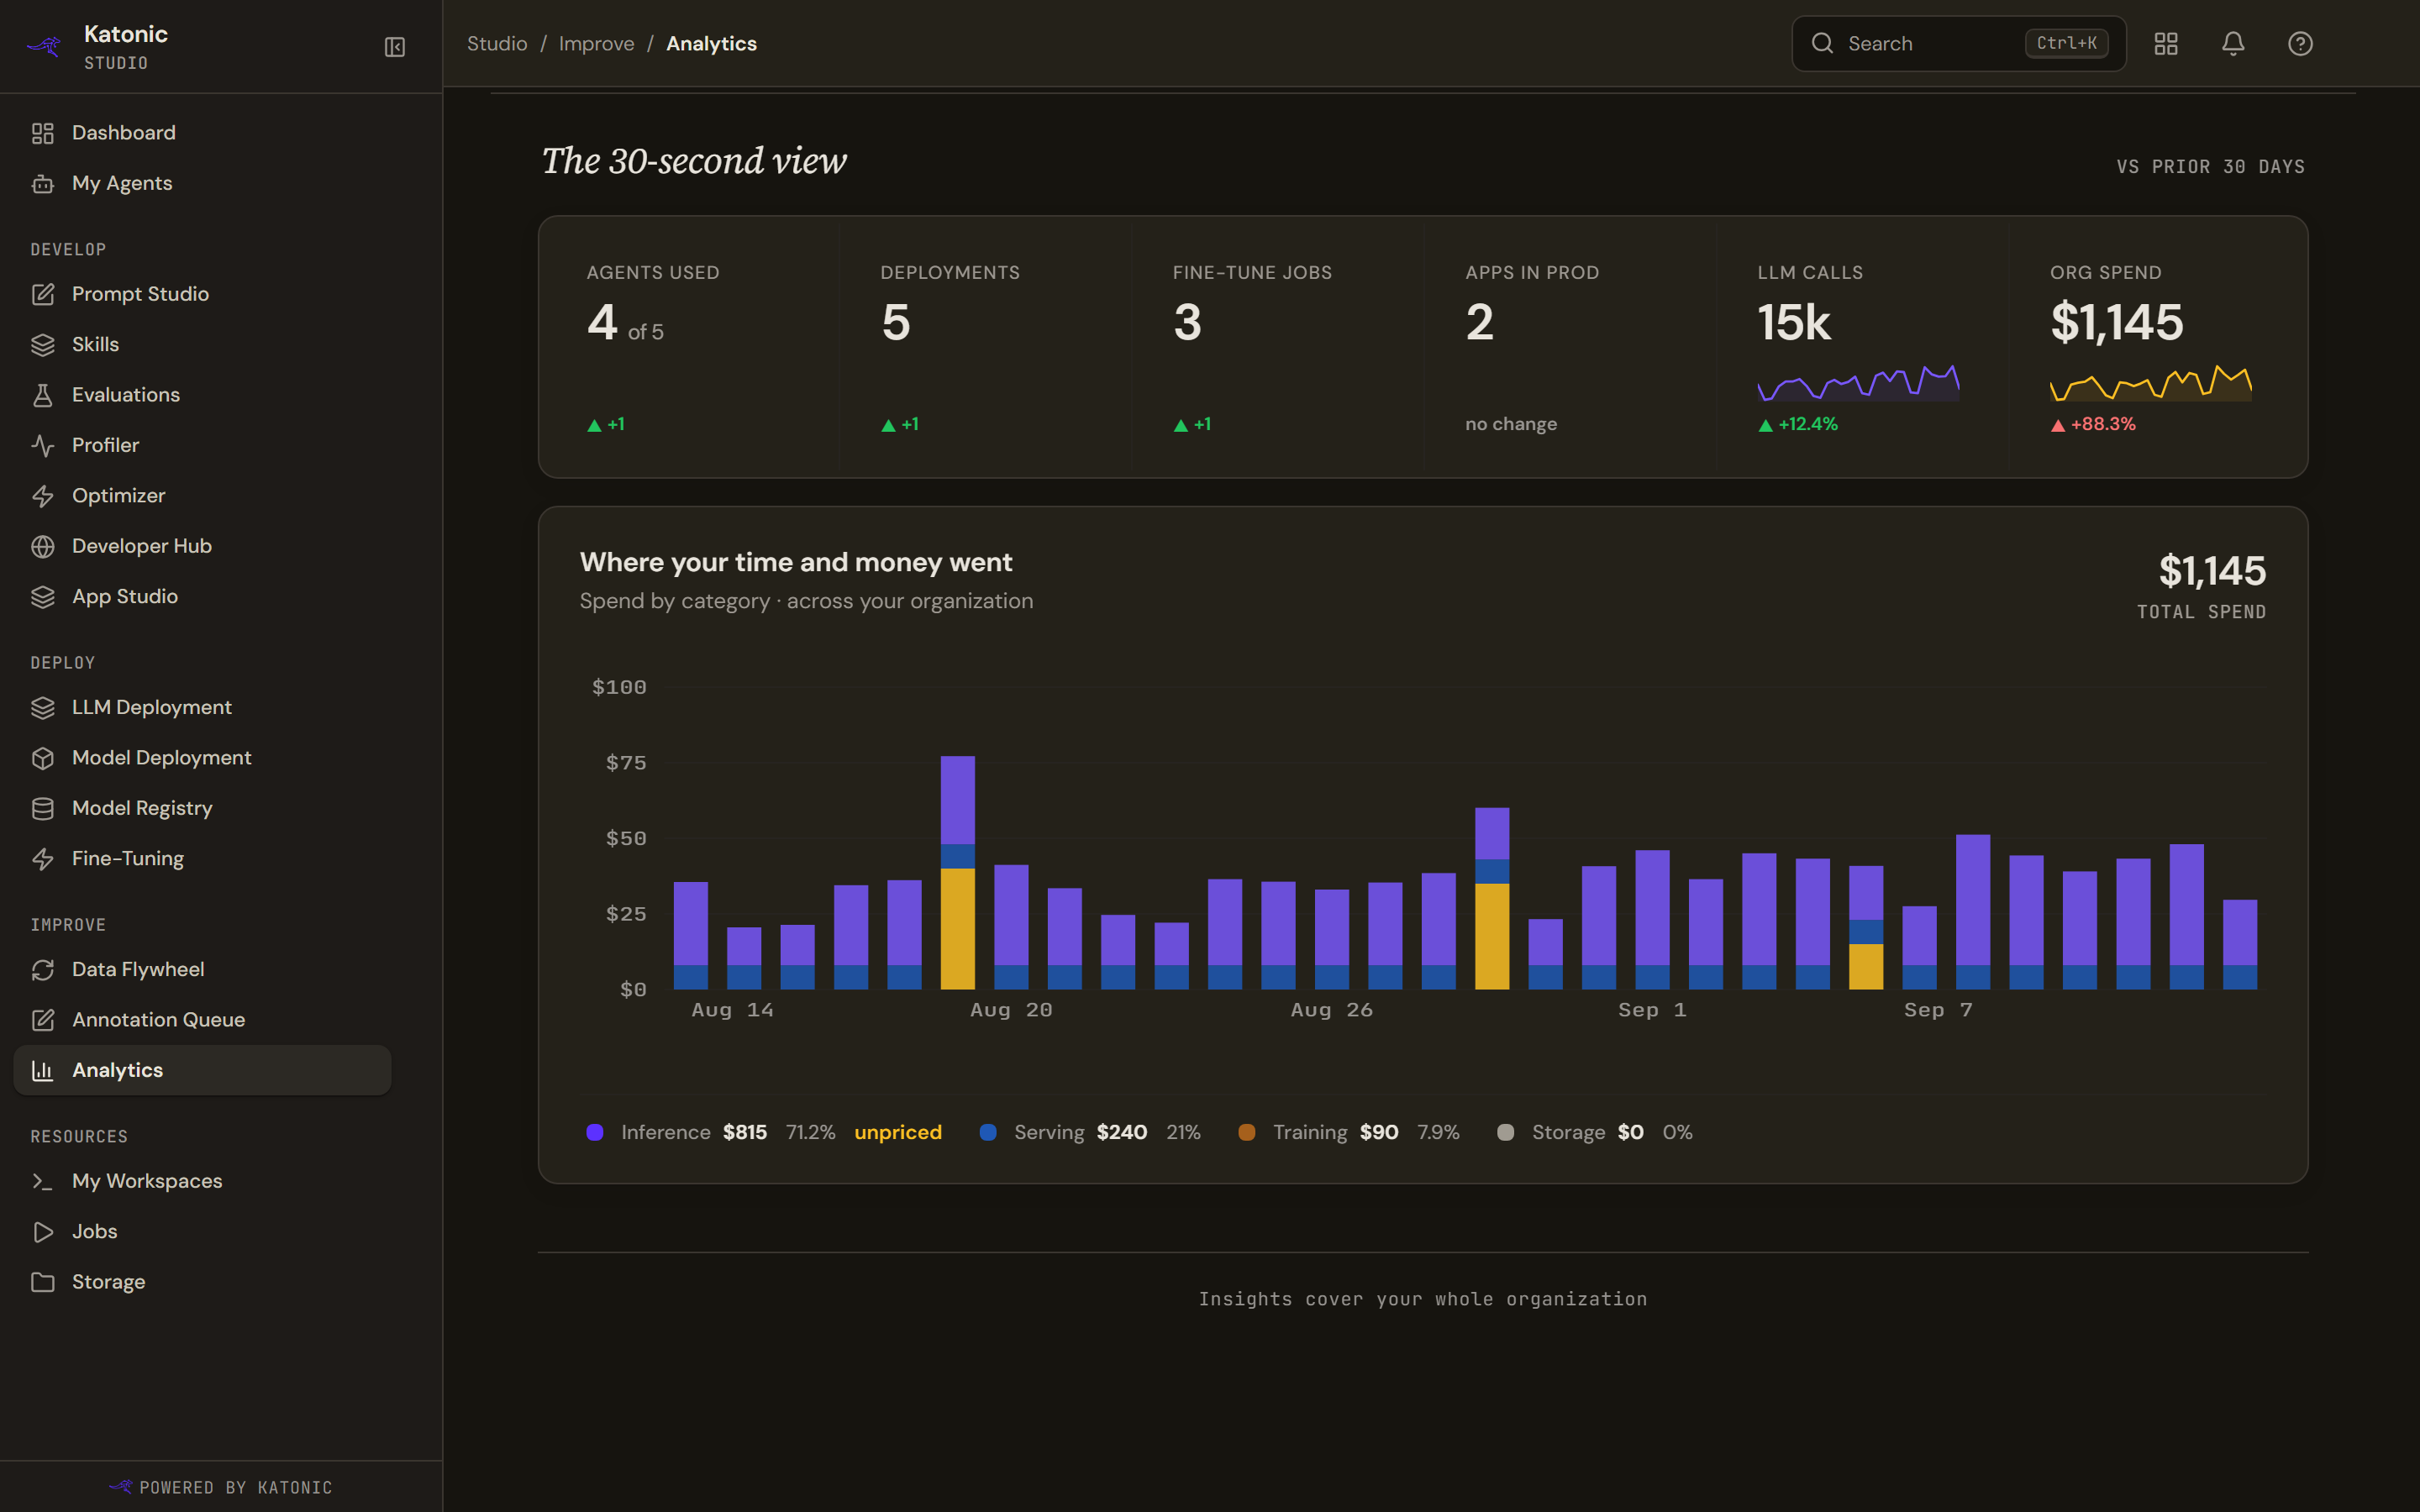
One bar a day across the range, split into four categories, with a legend giving each category's total and its share. When the amounts are small, the axis still gets distinct labels rather than repeating one rounded figure.
Hover a bar, or move keyboard focus to it, and a line under the chart reads out that day: its total, then each category with spend that day, top of the stack first, for example "Sep 26 · $0.03 · inference $0.02 · serving $0.01". The category names in that line are the plain lowercase ones: inference, serving, training and storage. The chart is a single Tab stop: the arrow keys move between days, and Home and End jump to the first and last.
Only two of the four are real daily figures. Inference is summed per day from the recorded cost of each call. Training is summed per day from each fine-tune job's own cost. Serving and storage are period totals spread evenly across the days, so their shape in the chart carries no information.
What each cost actually is
Inference is the cost the AI gateway recorded against each call, using its own price table. It is a floor, not a total. A call to a model with no price row is recorded as costing nothing, and the legend then marks the inference row unpriced with the number of such calls. Read that chip as a warning that the figure understates real usage, not as a rounding note.
Serving is an estimate. The platform's cost rollup service is not built yet, so serving cost is worked out as hours running, times GPU count, times a flat public list rate held in the code. It is not billed spend, it ignores any discount you have, and it counts no non-GPU compute.
Storage comes from the same unbuilt service and so reads zero on every cluster today, whatever you are actually storing. A zero here is the absence of a measurement, not a measurement of nothing.
Training is the only category taken from a per-job figure the platform recorded itself.
None of the four include tax, egress or network.
What to do with it
The honest reading of this chart is a shape, not an invoice. Inference and training tell you where your own usage went and are worth acting on. Serving is an order of magnitude. Storage is not measured at all.
If you need a billed figure, take it from the organisation's own billing rather than from here.