An app's metrics
Metrics shows four operational numbers for a running app, refreshed every thirty seconds while the tab is in front.
Who can use it: the Builder role or higher.
The four numbers
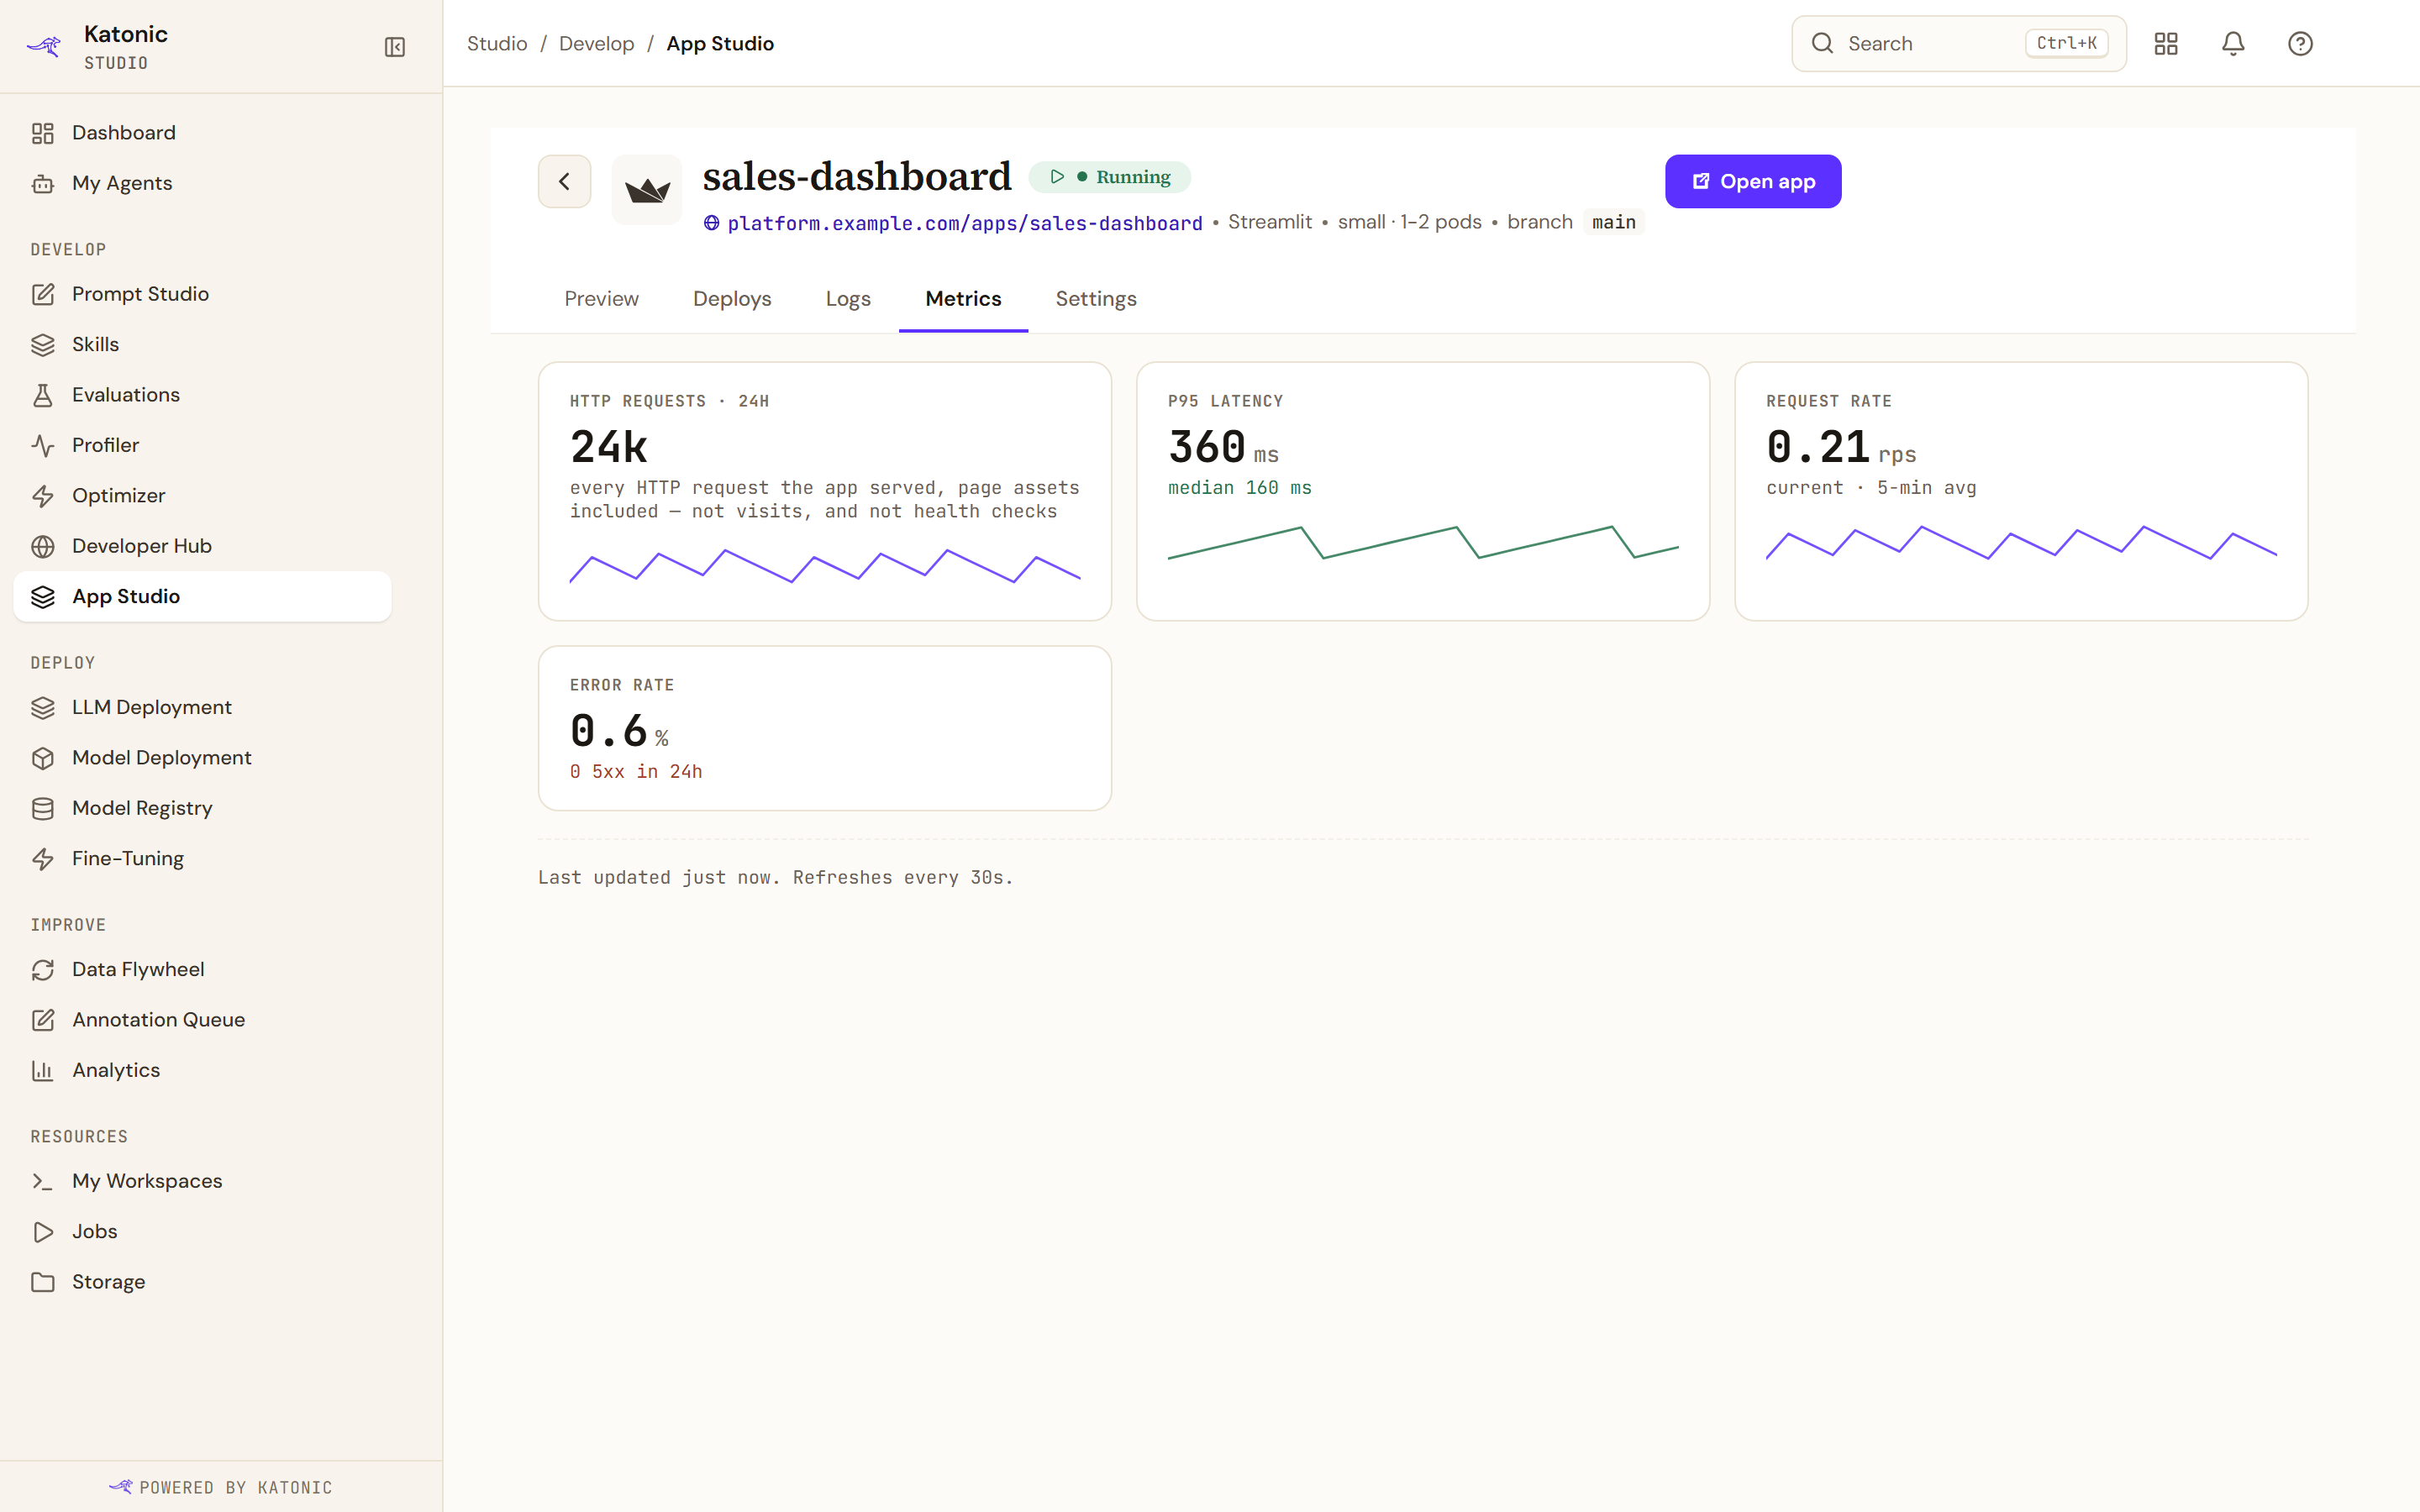
| Card | What it counts |
|---|---|
| HTTP requests · 24h | Every HTTP request the app served, page assets included, but not health checks |
| P95 latency | The 95th percentile, with the median beneath it |
| Request rate | The current rate over a five-minute window |
| Error rate | The share of responses that were errors, with the count of server errors |
All four are measured by the service mesh the app runs behind, not counted in your browser and not reported by your app. You do not have to instrument anything to get them, and you cannot change what they count from inside your code.
The request count is not visits
This is the number people misread, so it is worth being blunt about.
One person opening a Streamlit page produces many requests: the document, then every script, stylesheet and font, then the websocket traffic that keeps the session alive. The card's caption says the same: it counts every request the app served, page assets included, and neither visits nor health checks. The caption shows only when the count is above zero; otherwise the card reads "no traffic yet".
Treat the number as load, not audience. Health checks are left out, so an app nobody opened stays at zero. If you need to know how many people used something, count it inside your app.
The 95th percentile beside the average is the more useful latency figure. An average flattered by thousands of fast asset requests can sit comfortably while the page itself is slow.
Two kinds of nothing
A zero can mean two different things and the tab distinguishes them, which is the point.
No telemetry means the app reports nothing to the mesh at all. The number is missing, not zero. It points at sidecar injection in the app's namespace as the thing to check, which is an operator's job rather than yours.
No traffic recorded means the mesh is reachable, it answered, and the number really is zero. Nobody has used the app.
A refresh that fails says so and keeps showing the last values rather than dropping to zeros. A stale number labelled stale is more honest than a fresh-looking zero, and the tab is built that way on purpose.
What is not here
There is no per-user breakdown, no geography and no path-level split. The mesh measures the app as one destination.
There is also no uptime figure on this tab. The RAN FOR and UPTIME figures you see elsewhere belong to a deploy, not to the app.