Follow a run and inspect its trials
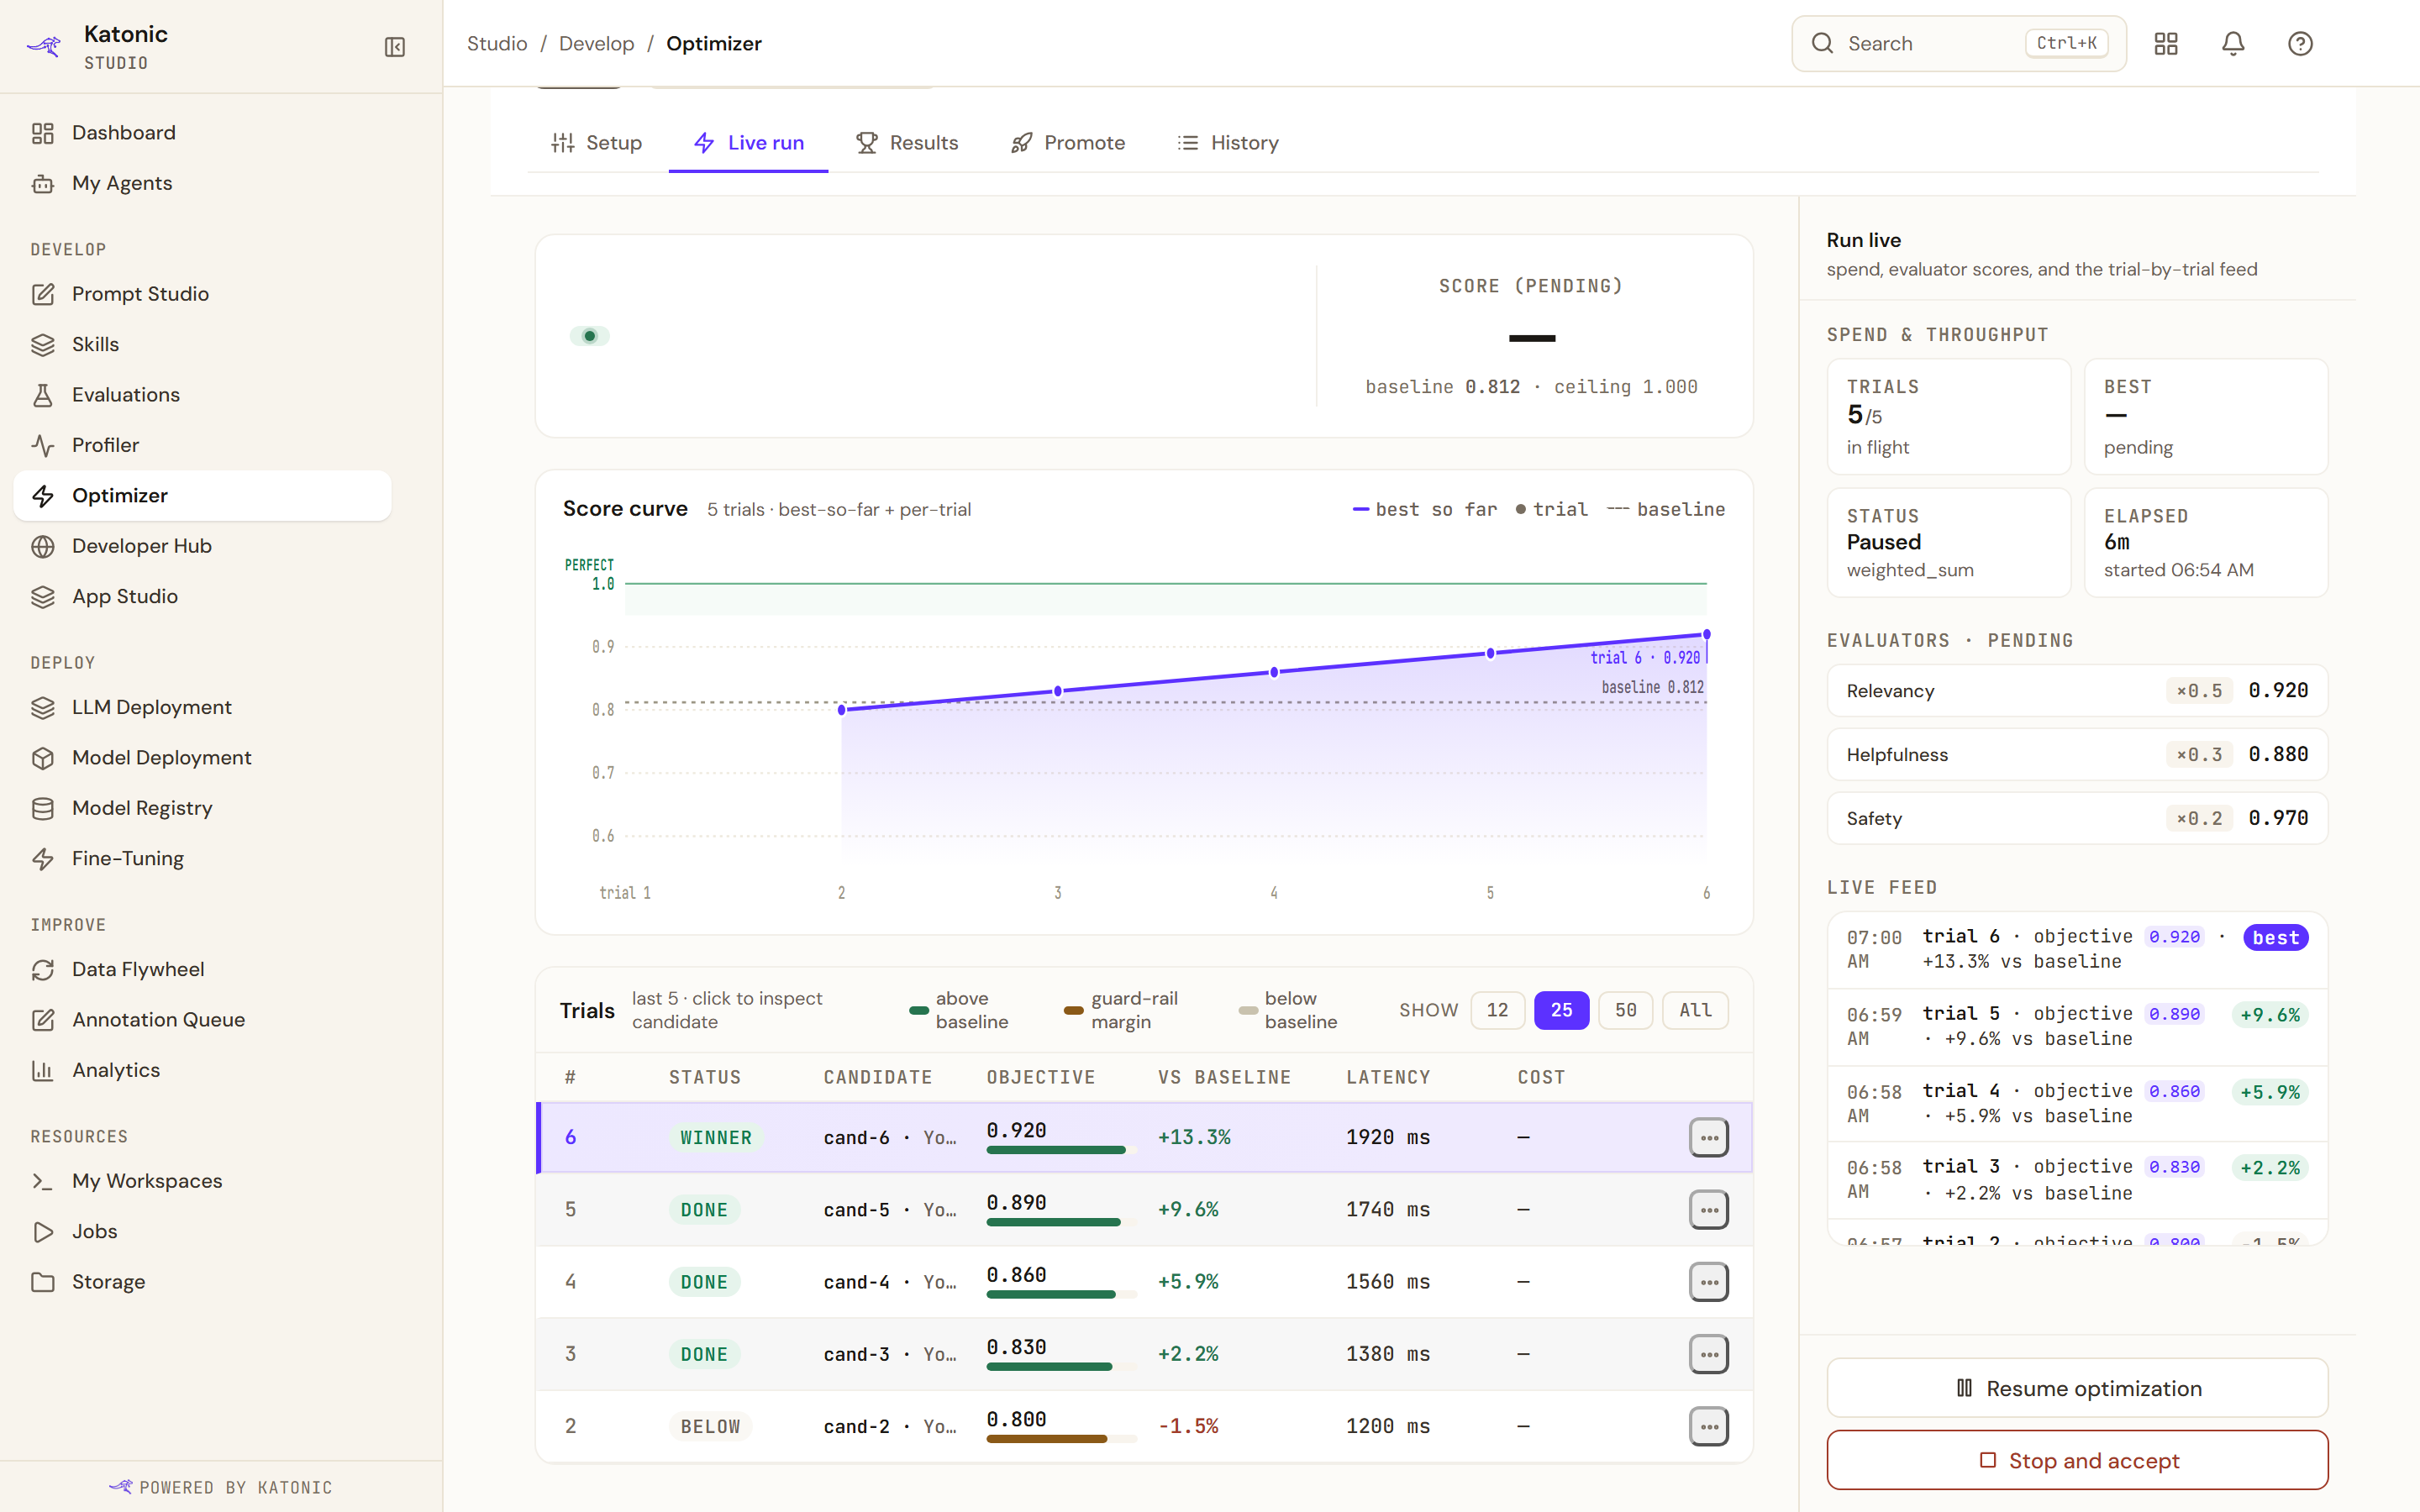
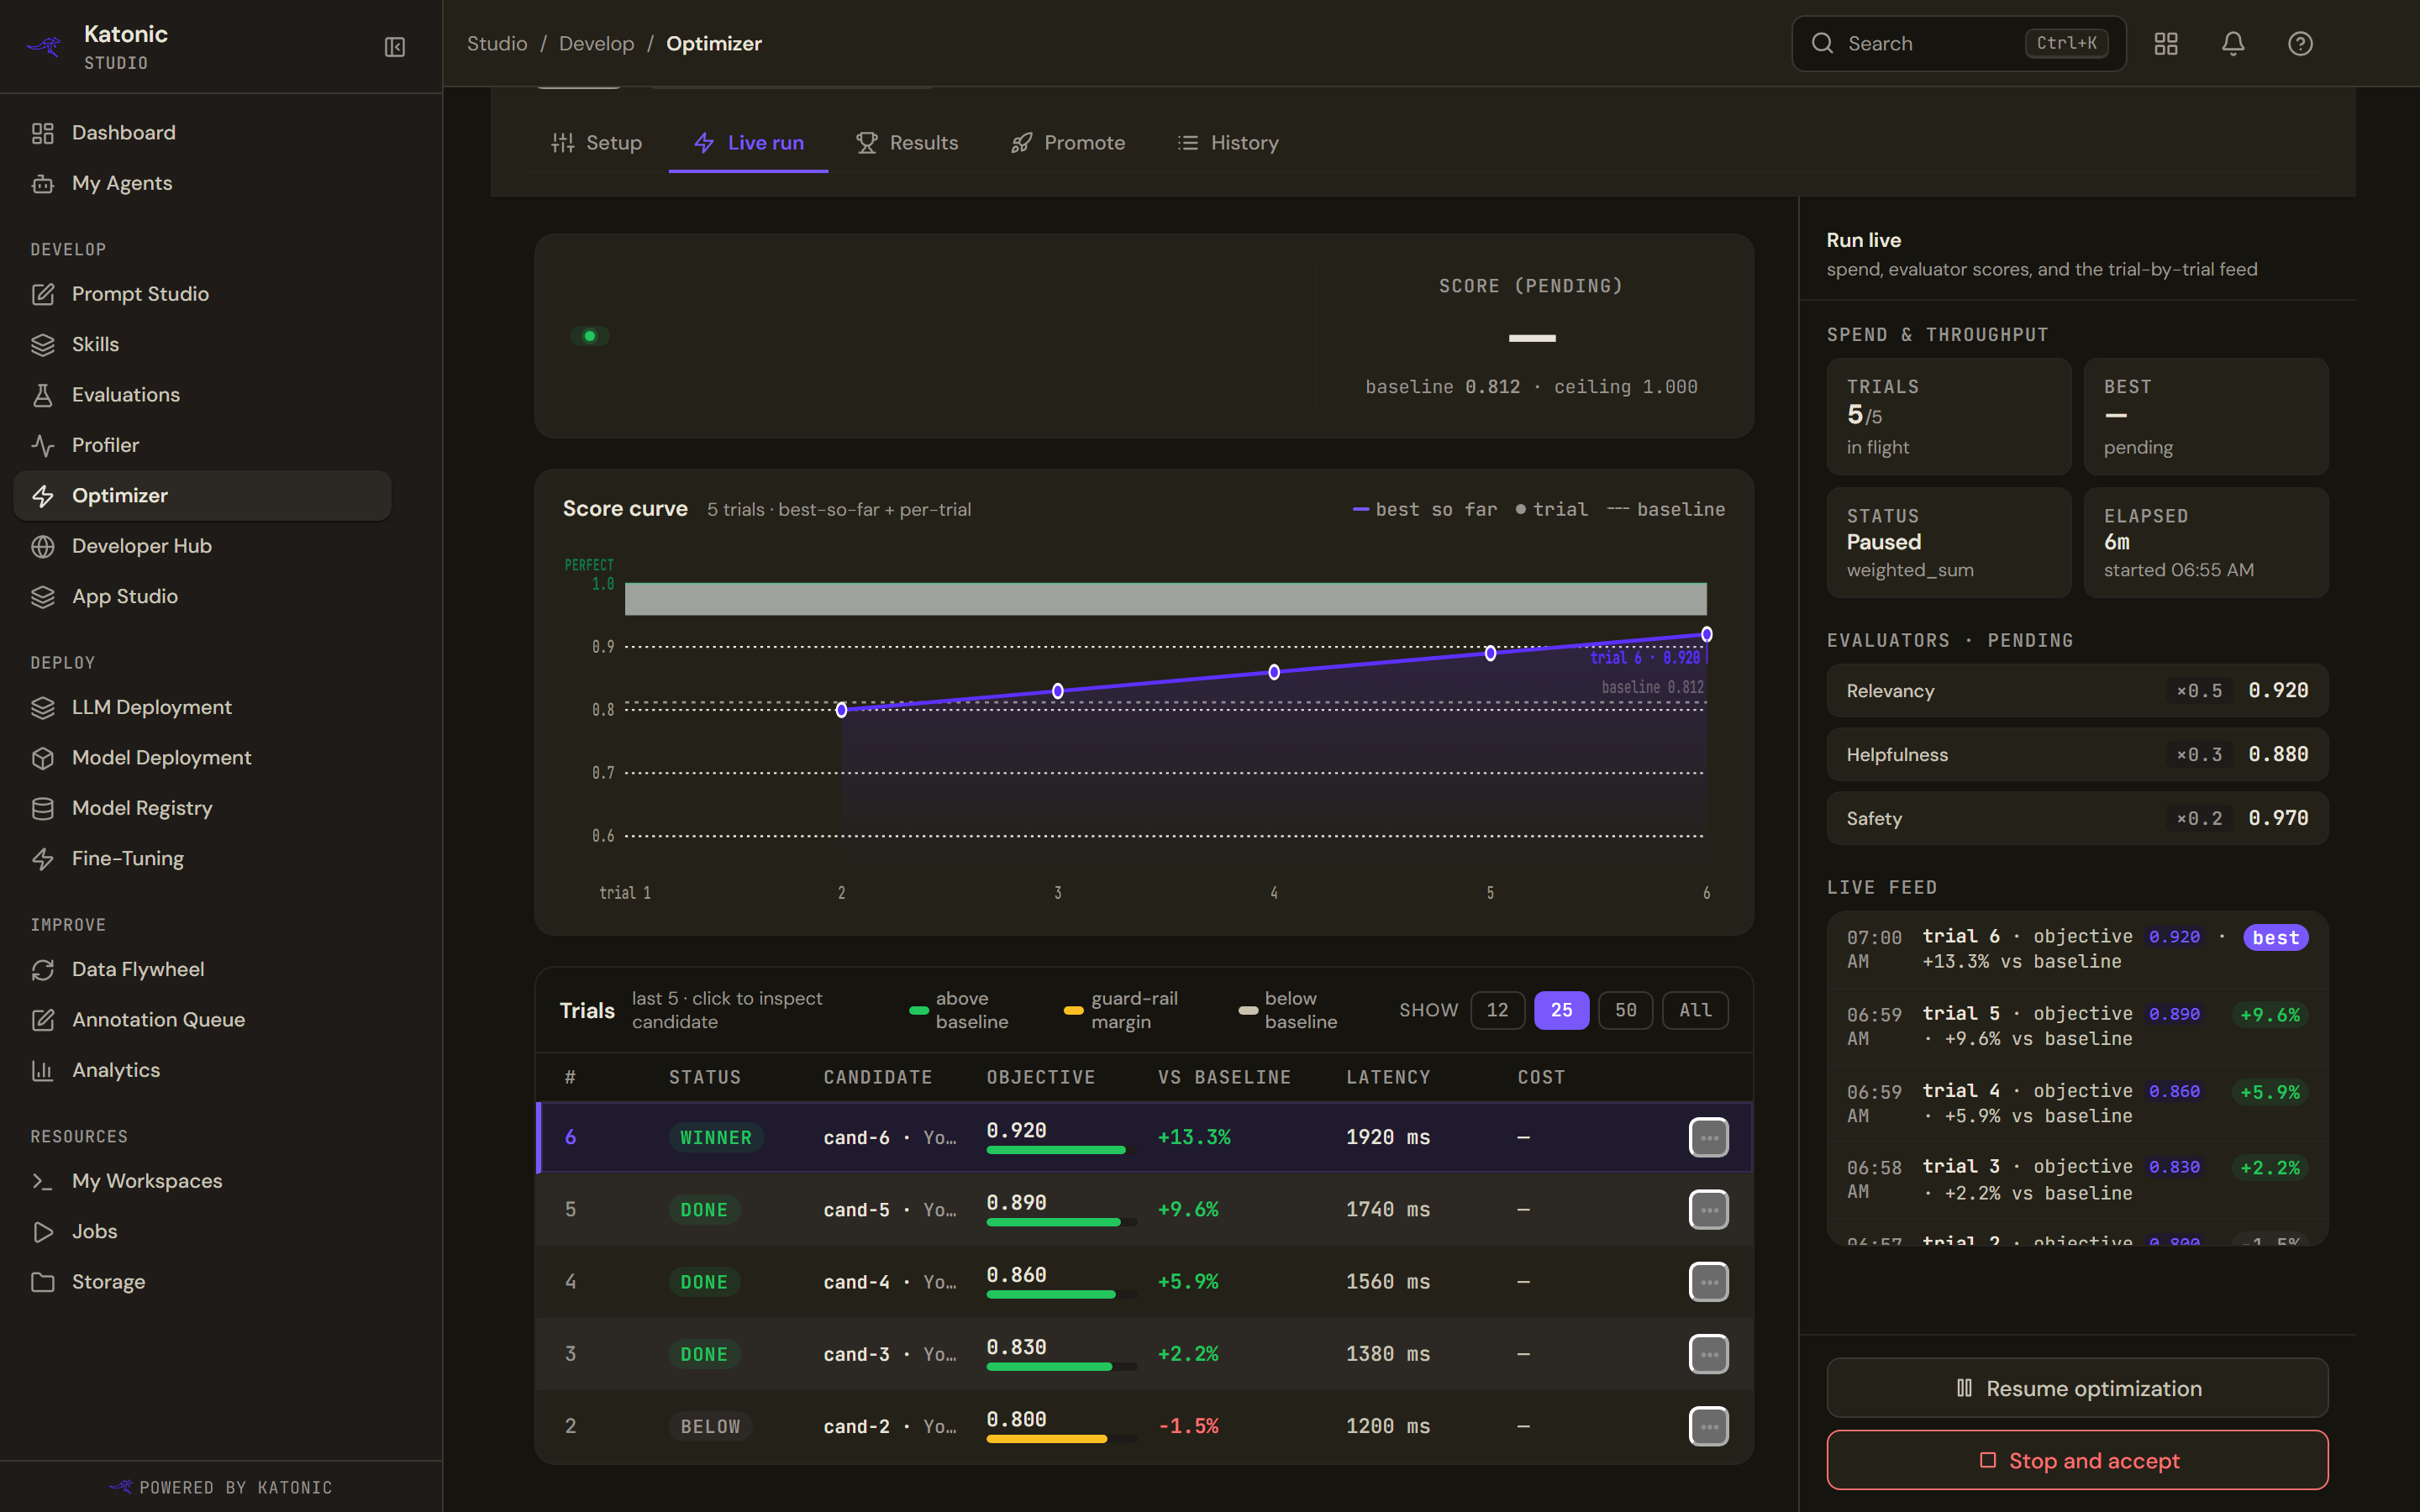
Live run is where a run is watched. The page refreshes itself every few seconds while the run is queued or running and stops when it completes or fails, so you can leave and come back. Every trial that lands adds a point to the chart, a row to the table and a line to the feed.
Who can use it: the Builder role or higher. Pausing and stopping act on the run for everyone.
The hero
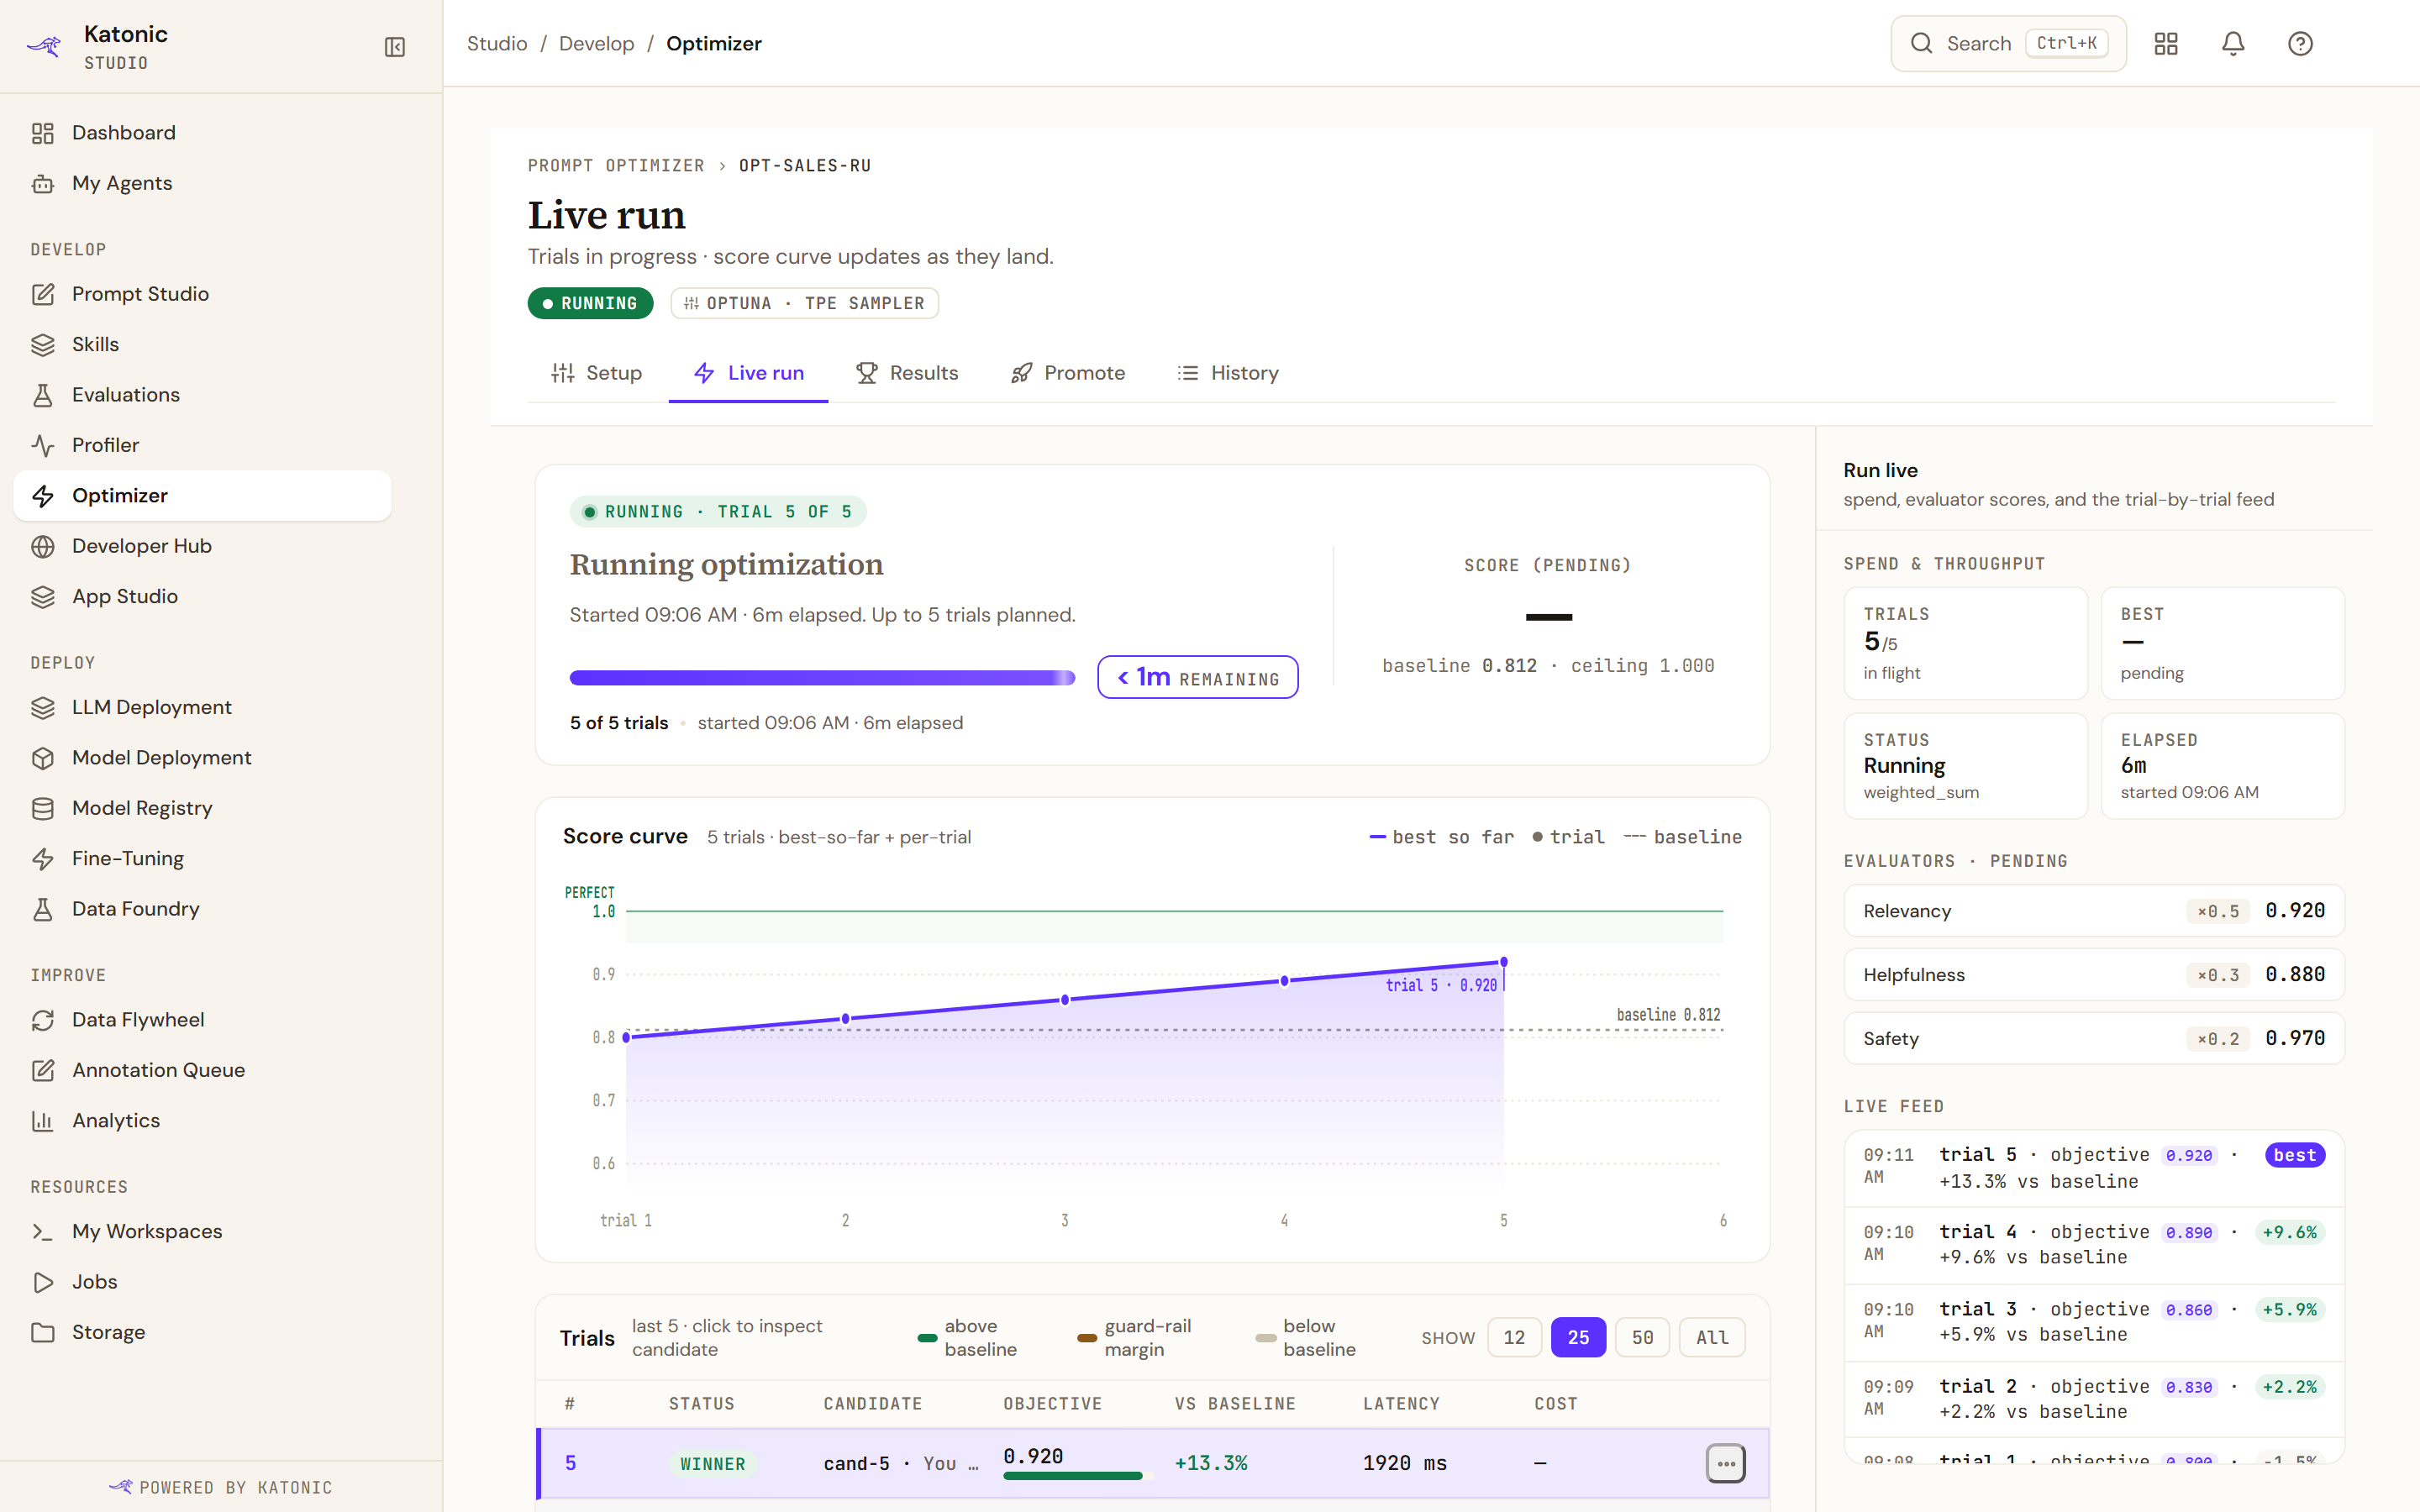
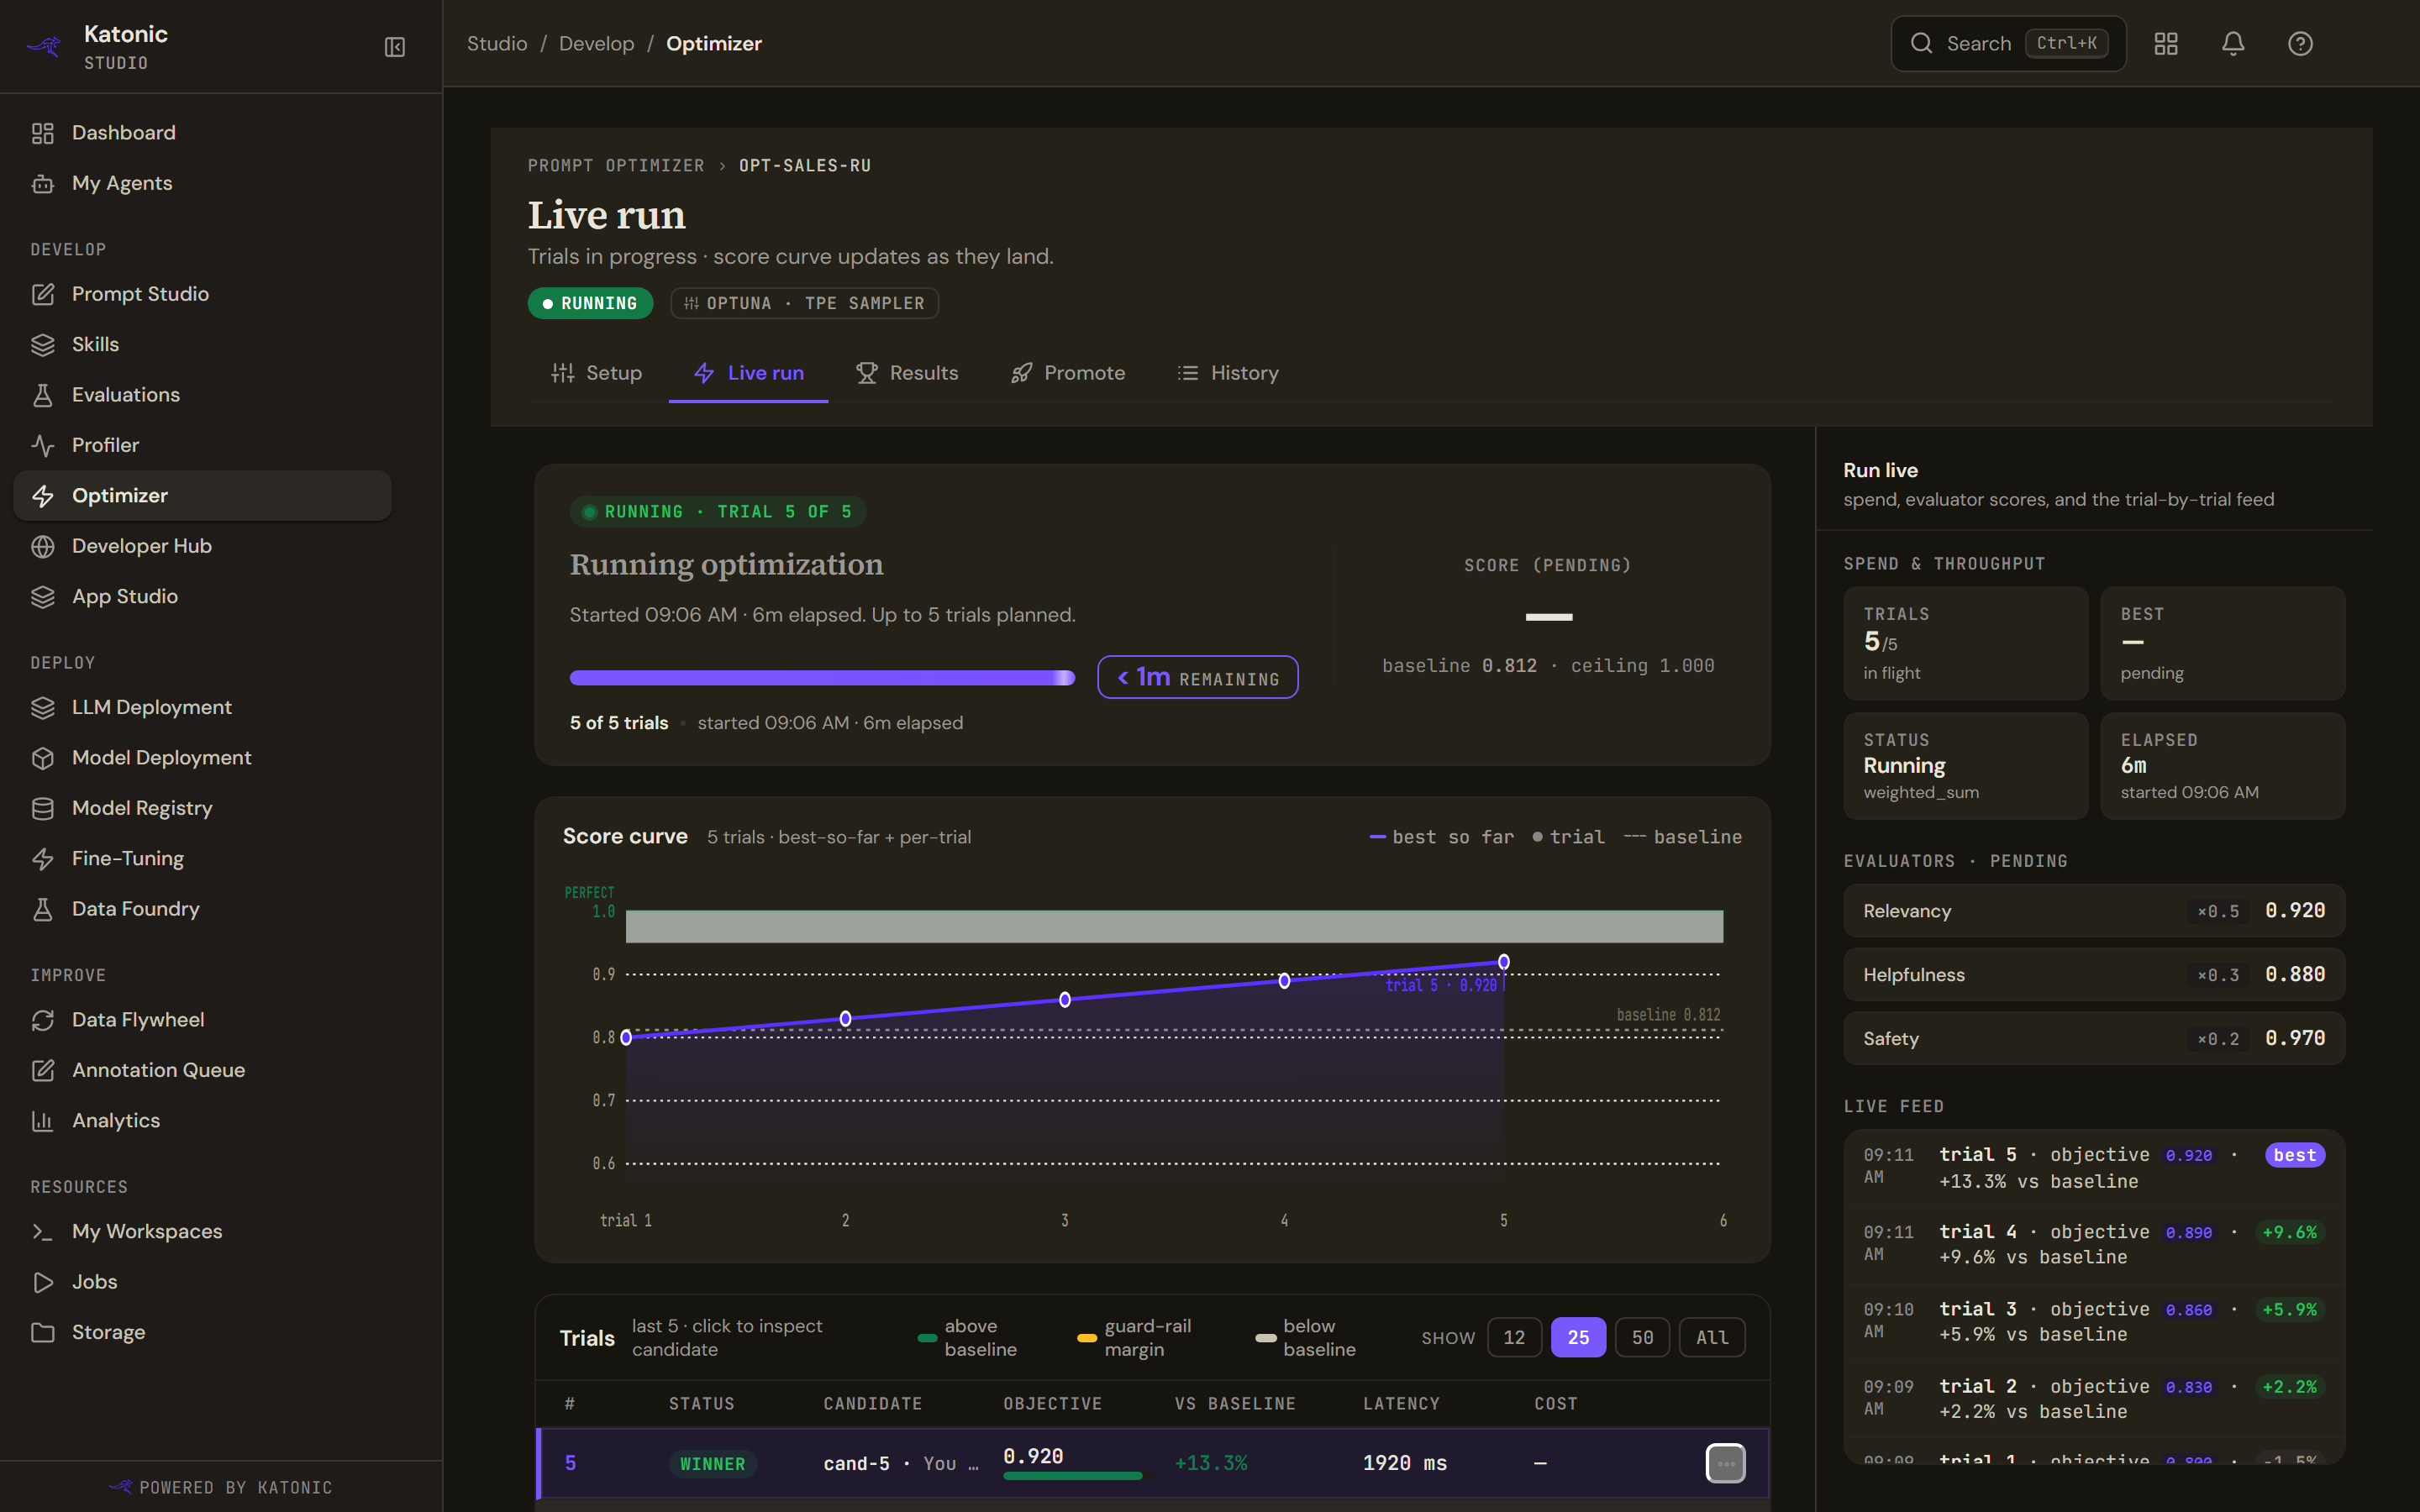
The top of the page says where the run is. The breadcrumb names the run by the first twelve characters of its id. While it runs, the status reads Running · Trial n of N, or Setting up · N trials planned before the first trial lands, with when it Started and how long has elapsed, a progress bar and the time remaining. The estimate is a time budget until the first trial completes and the measured pace afterwards. The big score card reads score (pending) with the baseline and the ceiling of 1.000 until the run completes, then best objective score with the change vs baseline.
A completed run reads Completed · N trials, names the Best trial with its score, and sums up Final score, baseline and lift. A failed run reads Run failed with the reason in plain words; see Optimizer troubleshooting.
Score curve
The chart plots every trial's objective as a point, the best so far as a line, and the baseline as a dashed line, with PERFECT marking 1.000. The winner is called out with its trial number and score. Trial numbers are counted from 1 on every part of the page.
Trials
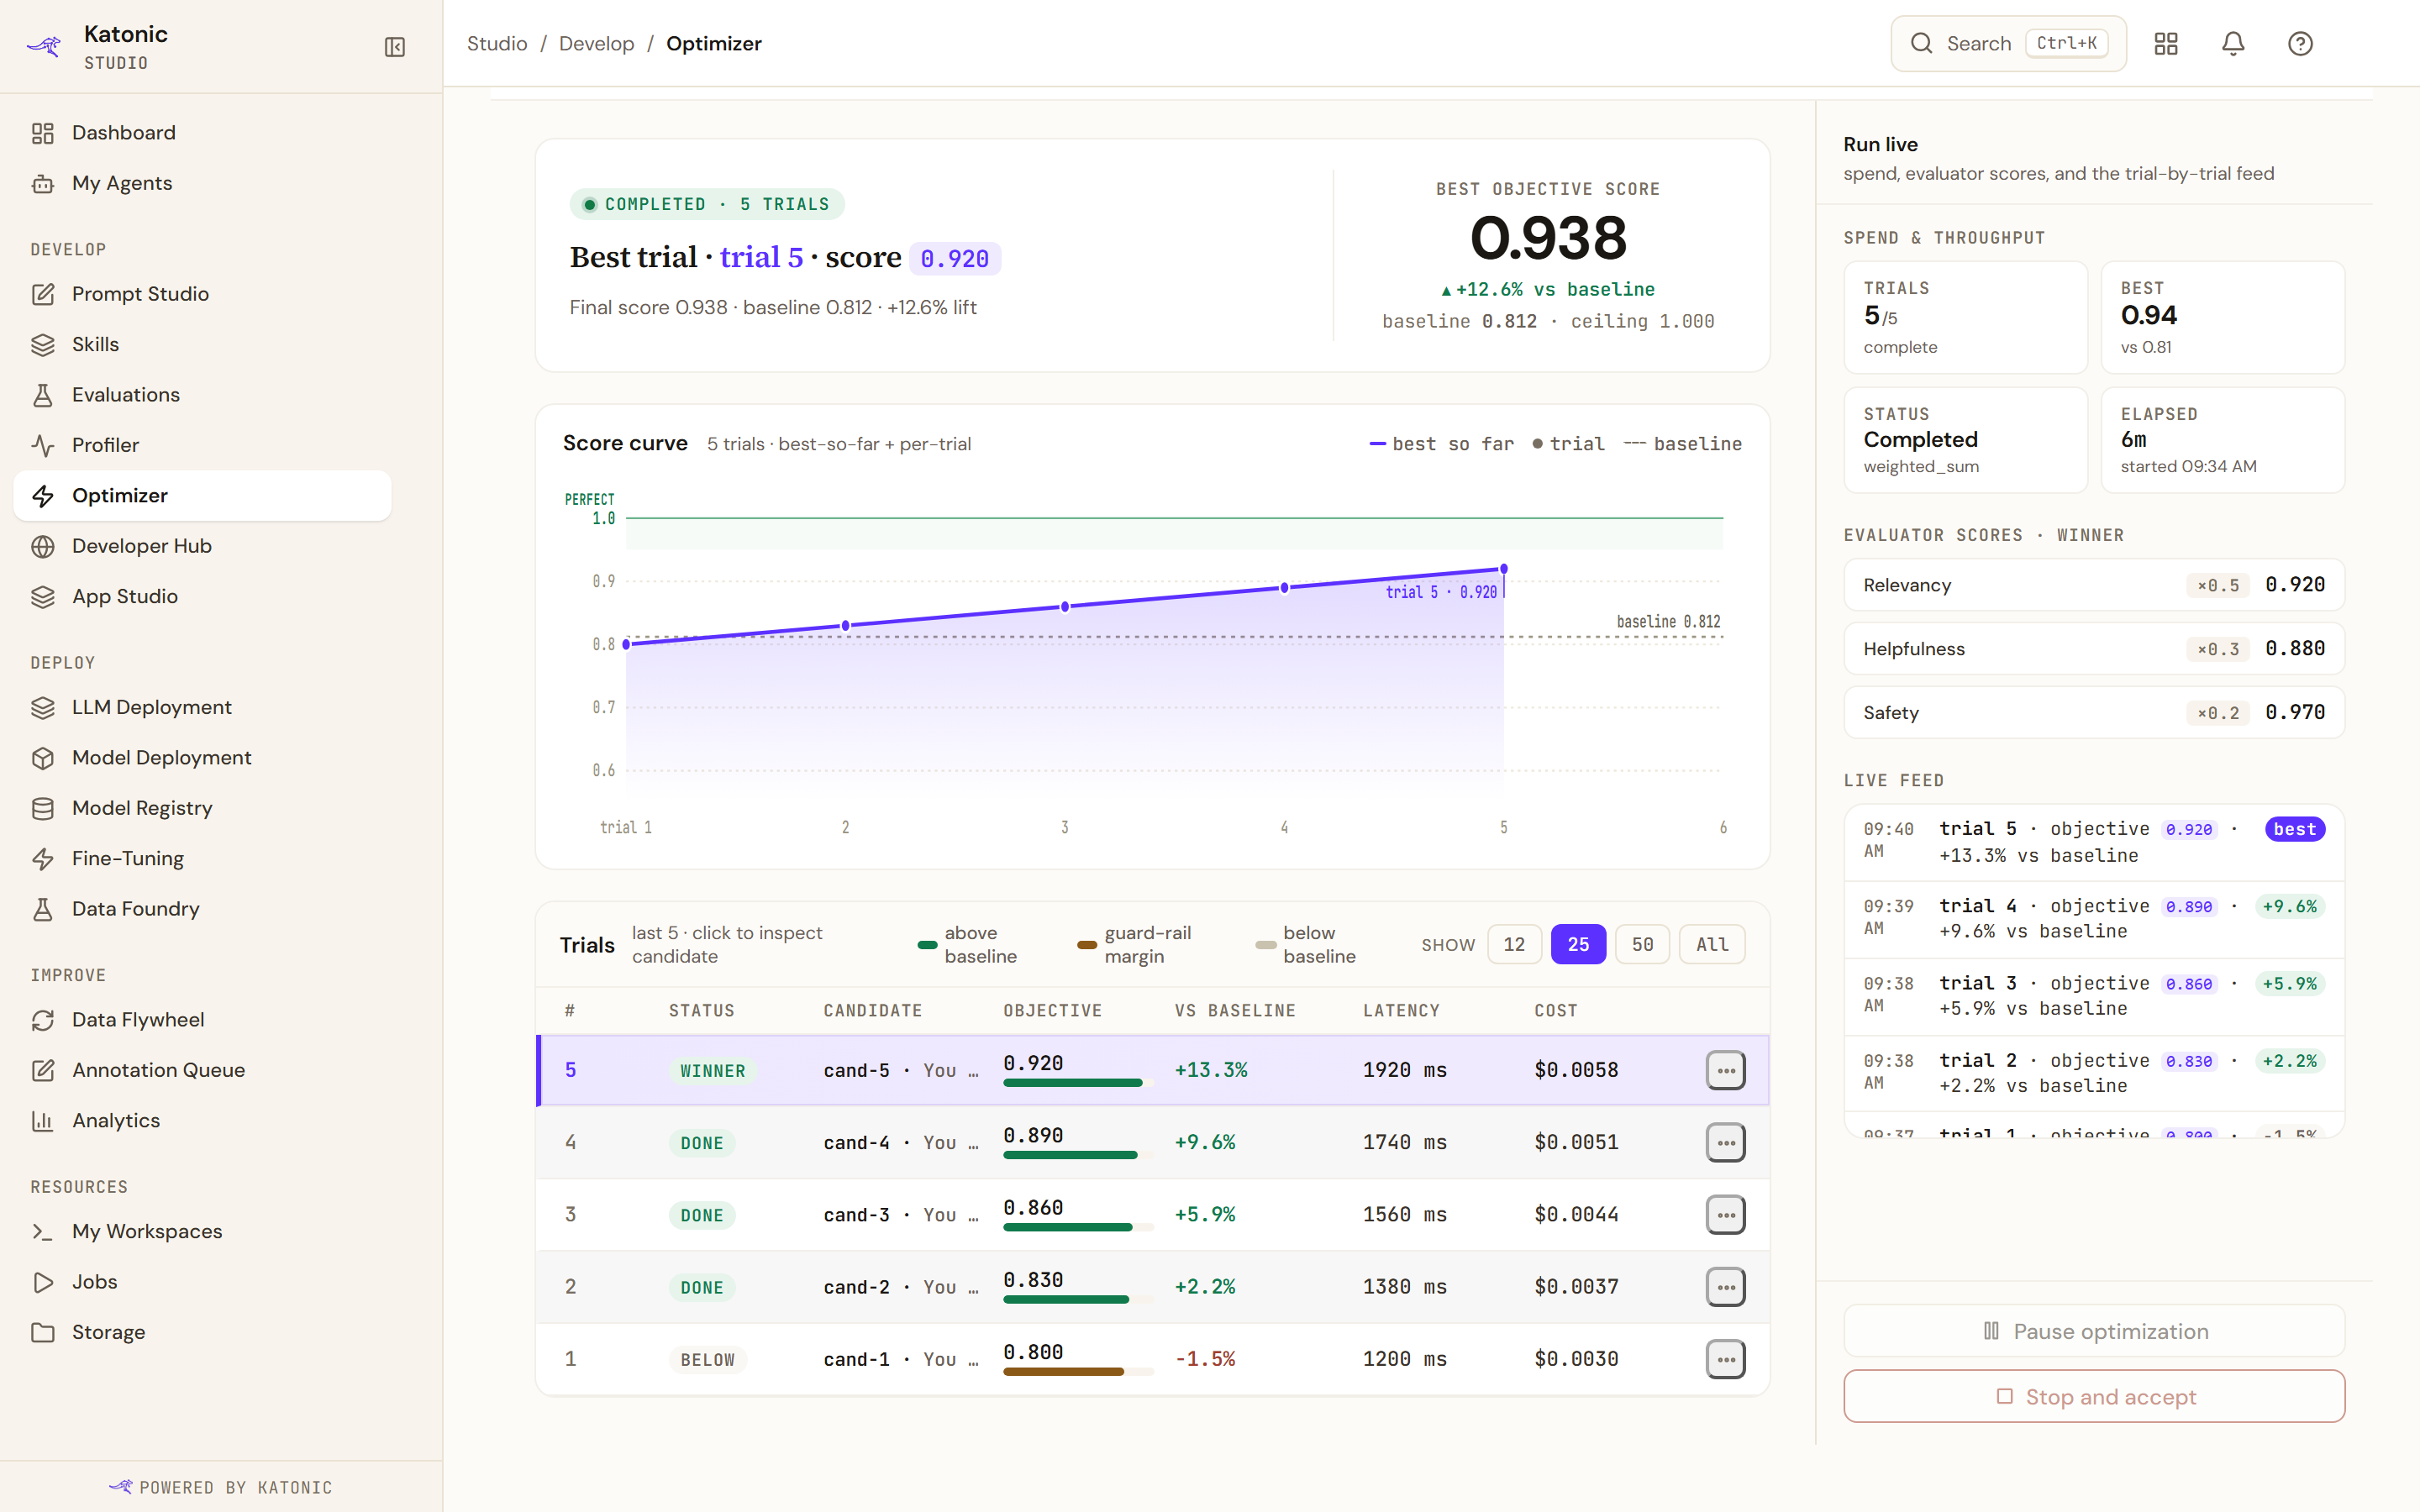
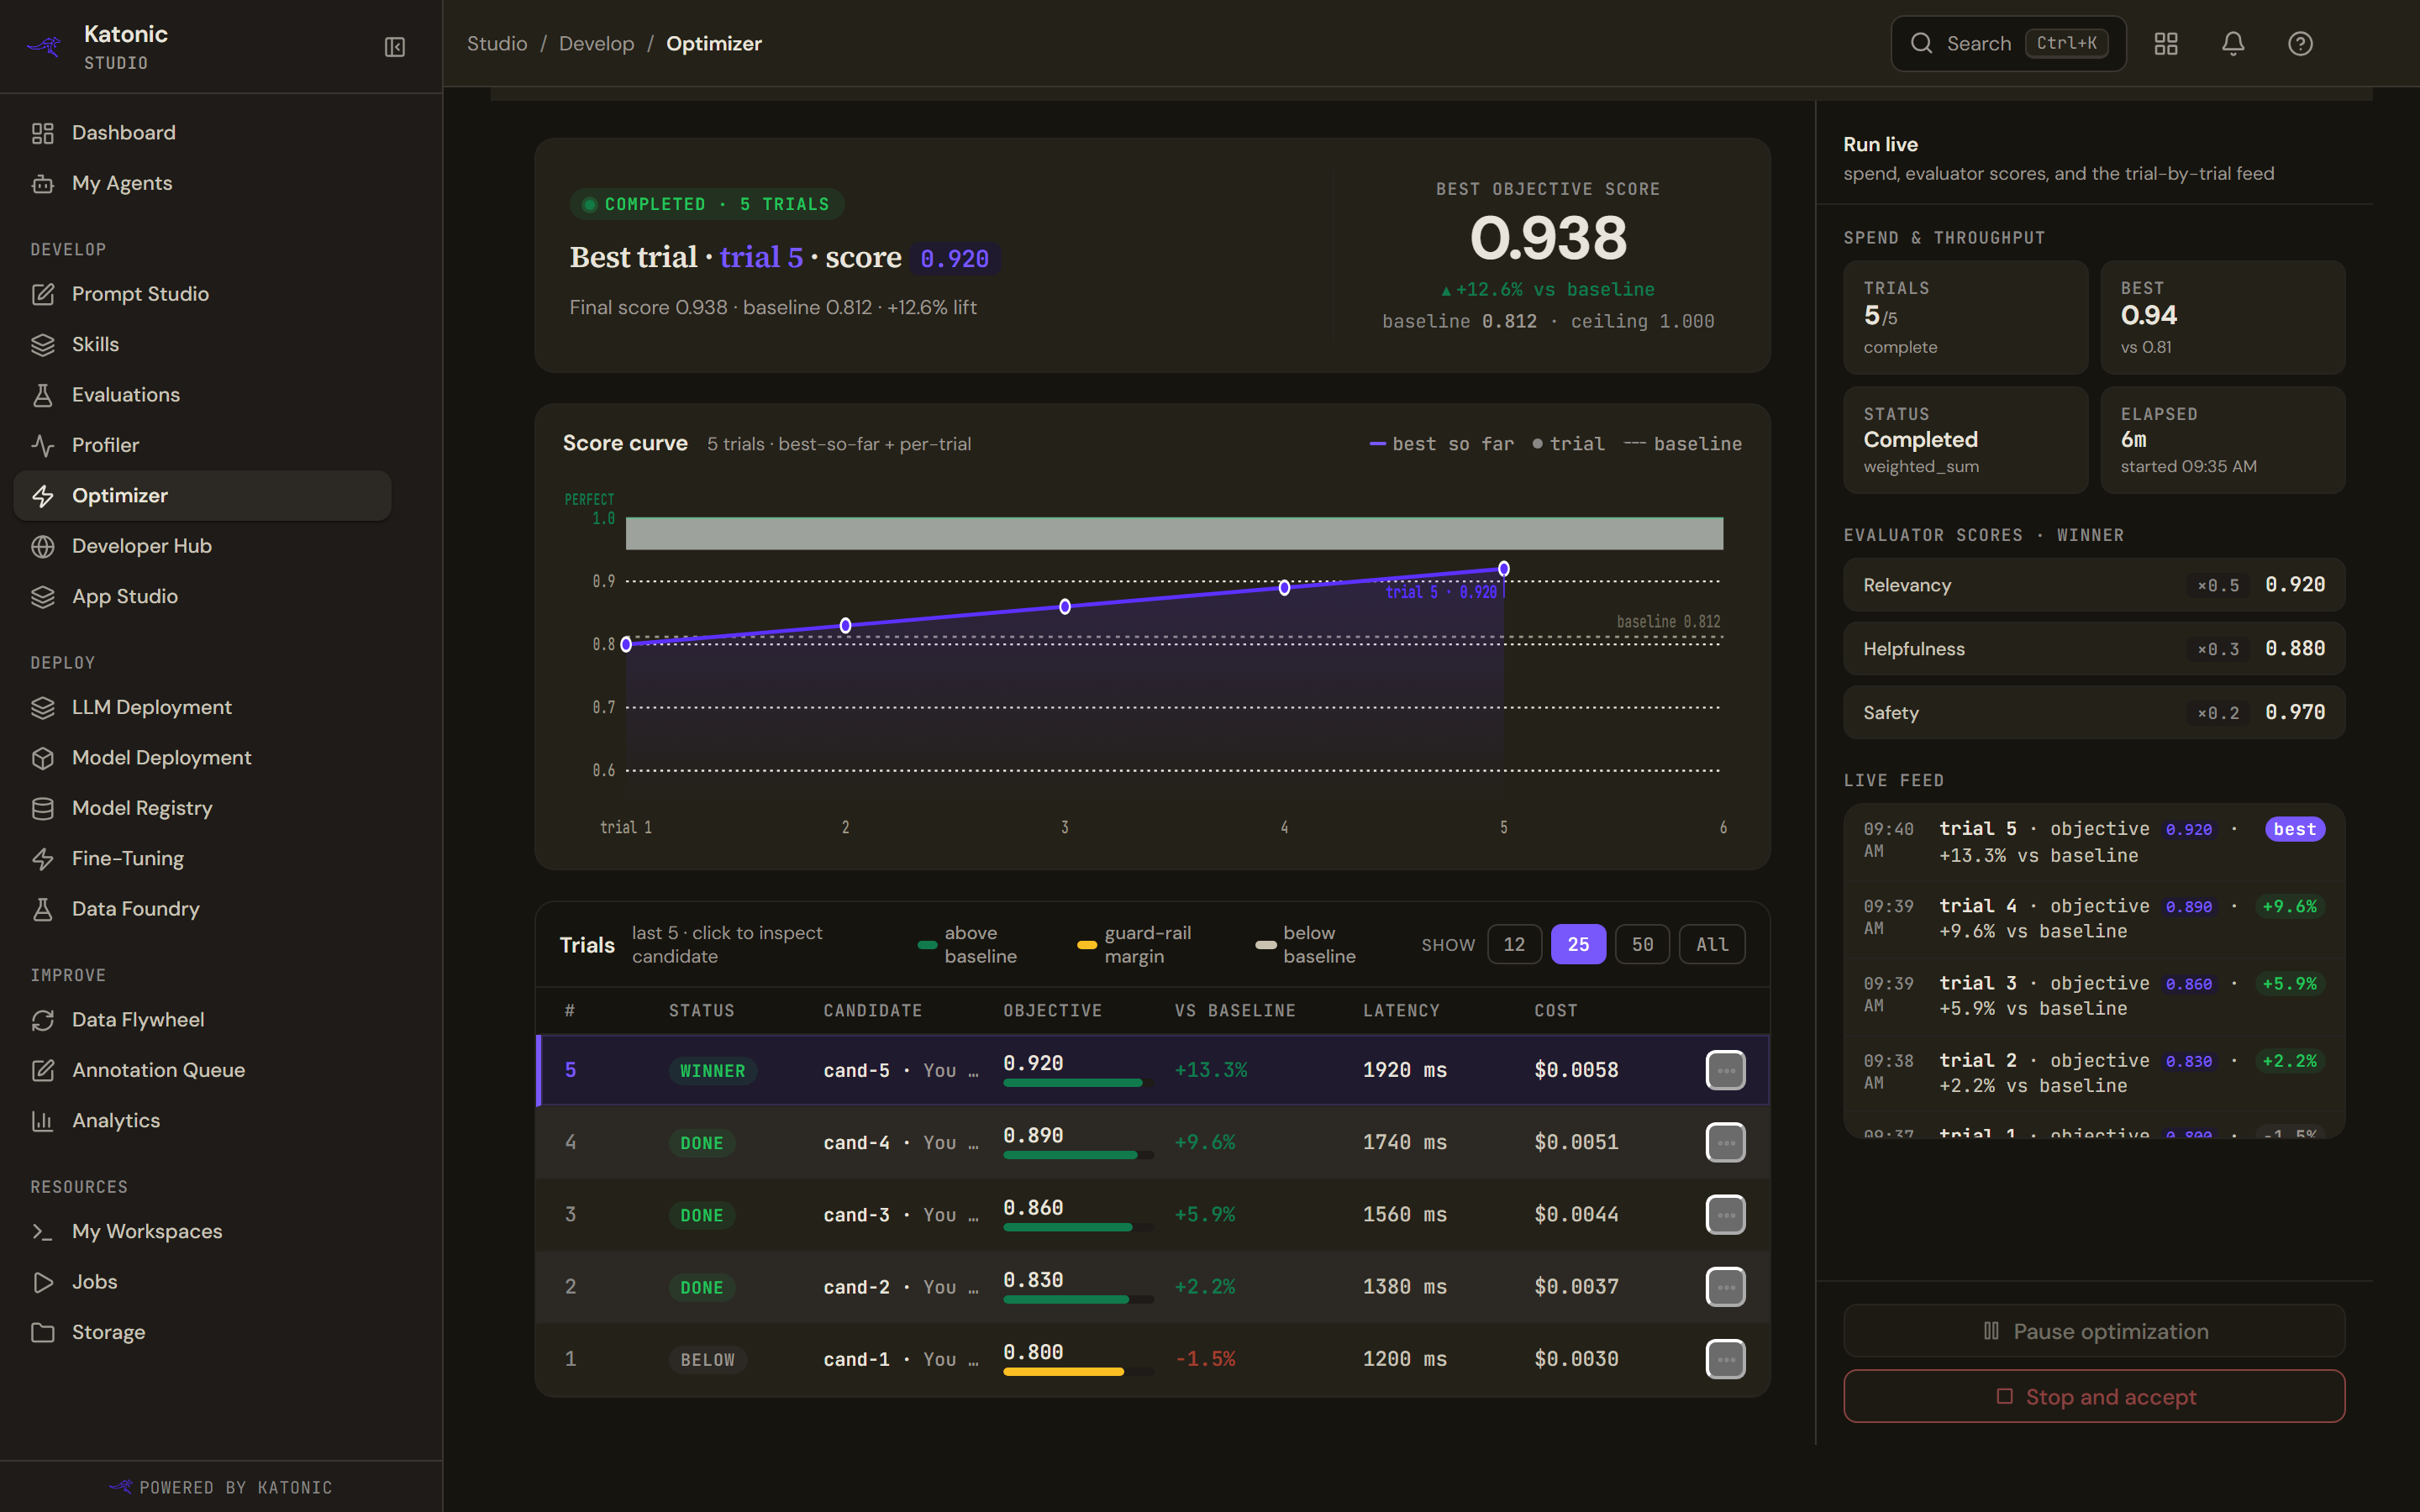
The table lists trials newest first. Each row has its number, a status of winner, done (scored at or above the baseline) or below, the candidate as the first line of its prompt or, for a parameter-only trial, the values it sampled, the objective with a bar, the change vs baseline, and latency and cost. The bar is green above the baseline, amber within the guard-rail margin just below it and brown further below, as the legend says; when the run has no measured baseline the change column reads as a dash rather than a made-up figure. Latency fills in when the trial recorded it, and cost when the platform could attribute usage to that trial's time window; otherwise the cell is a dash. show switches between the last 12, 25, 50 or All trials. Select a row to open the trial.
Run live
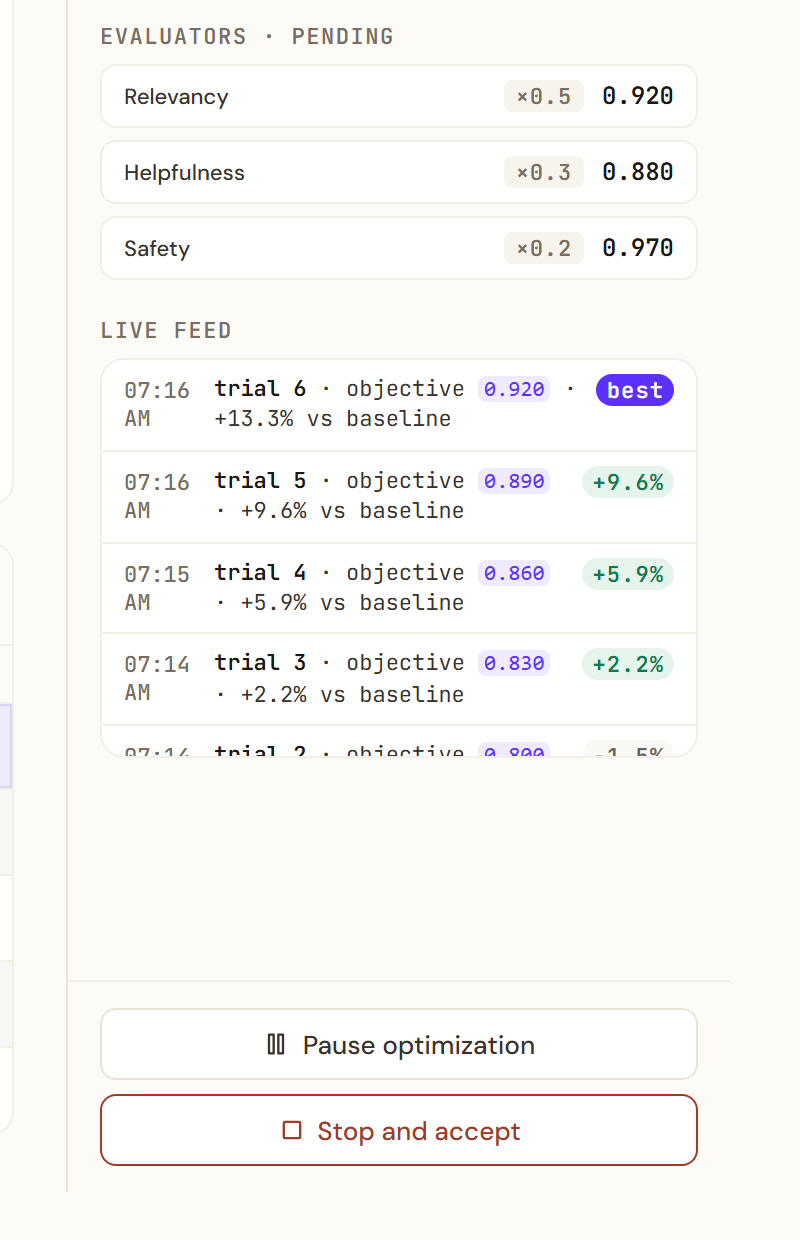
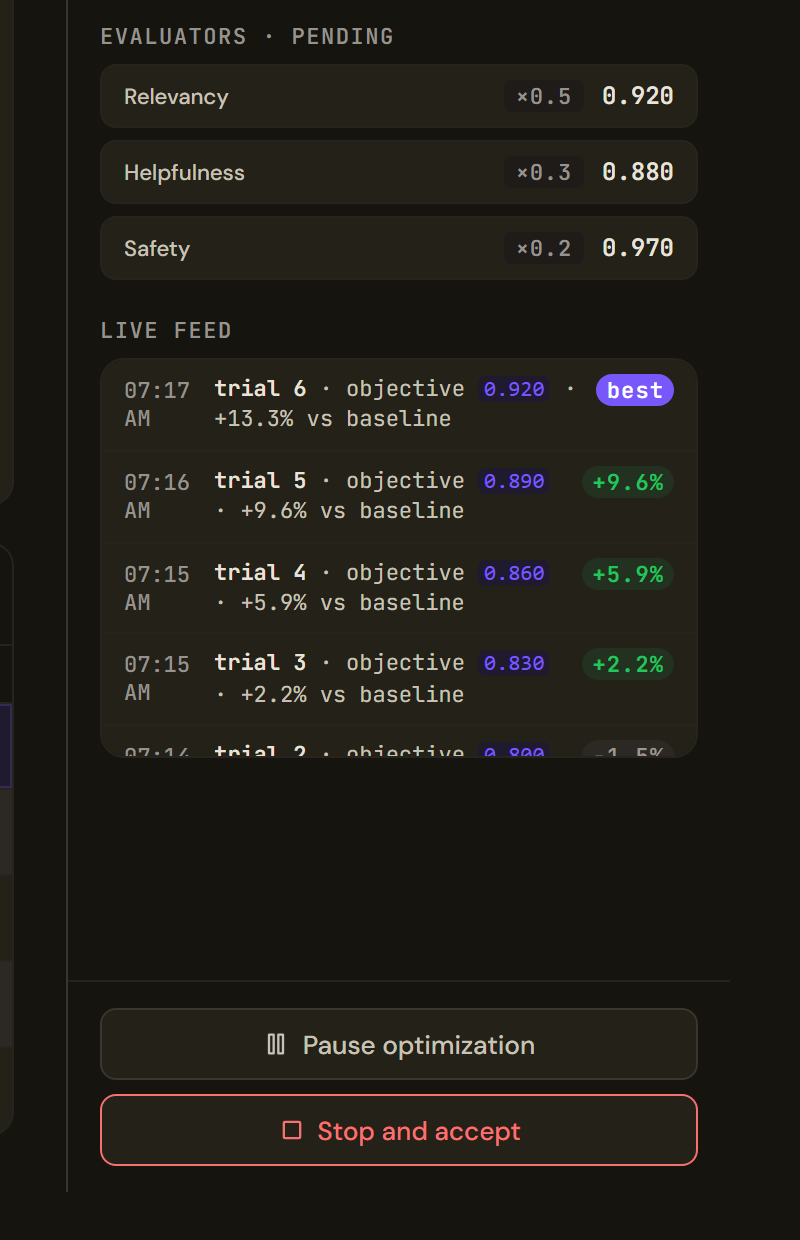
The rail on the right keeps the numbers. spend & throughput has four tiles: Trials completed out of planned, Best score against the baseline once known, Status with the aggregation in use, and Elapsed since the start. evaluator scores · winner (or evaluators · pending while running) lists each evaluator with its weight and the best trial's score on it. live feed is one row per trial as it lands, with its time, its objective and its change against the baseline; the best carries a best pill.
The two controls at the foot act on a run that is queued, running or paused:
- Pause optimization parks the run at the next trial boundary. Trials already scored are kept, the pill reads Paused, and the button becomes Resume optimization.
- Stop and accept ends the run at once. In this release the stopped run is recorded as cancelled: its status reads failed with the reason Optimization cancelled, the trials already scored stay in its history, and the best candidate so far is not carried into Results. Pause instead if you may want to continue.
A single trial
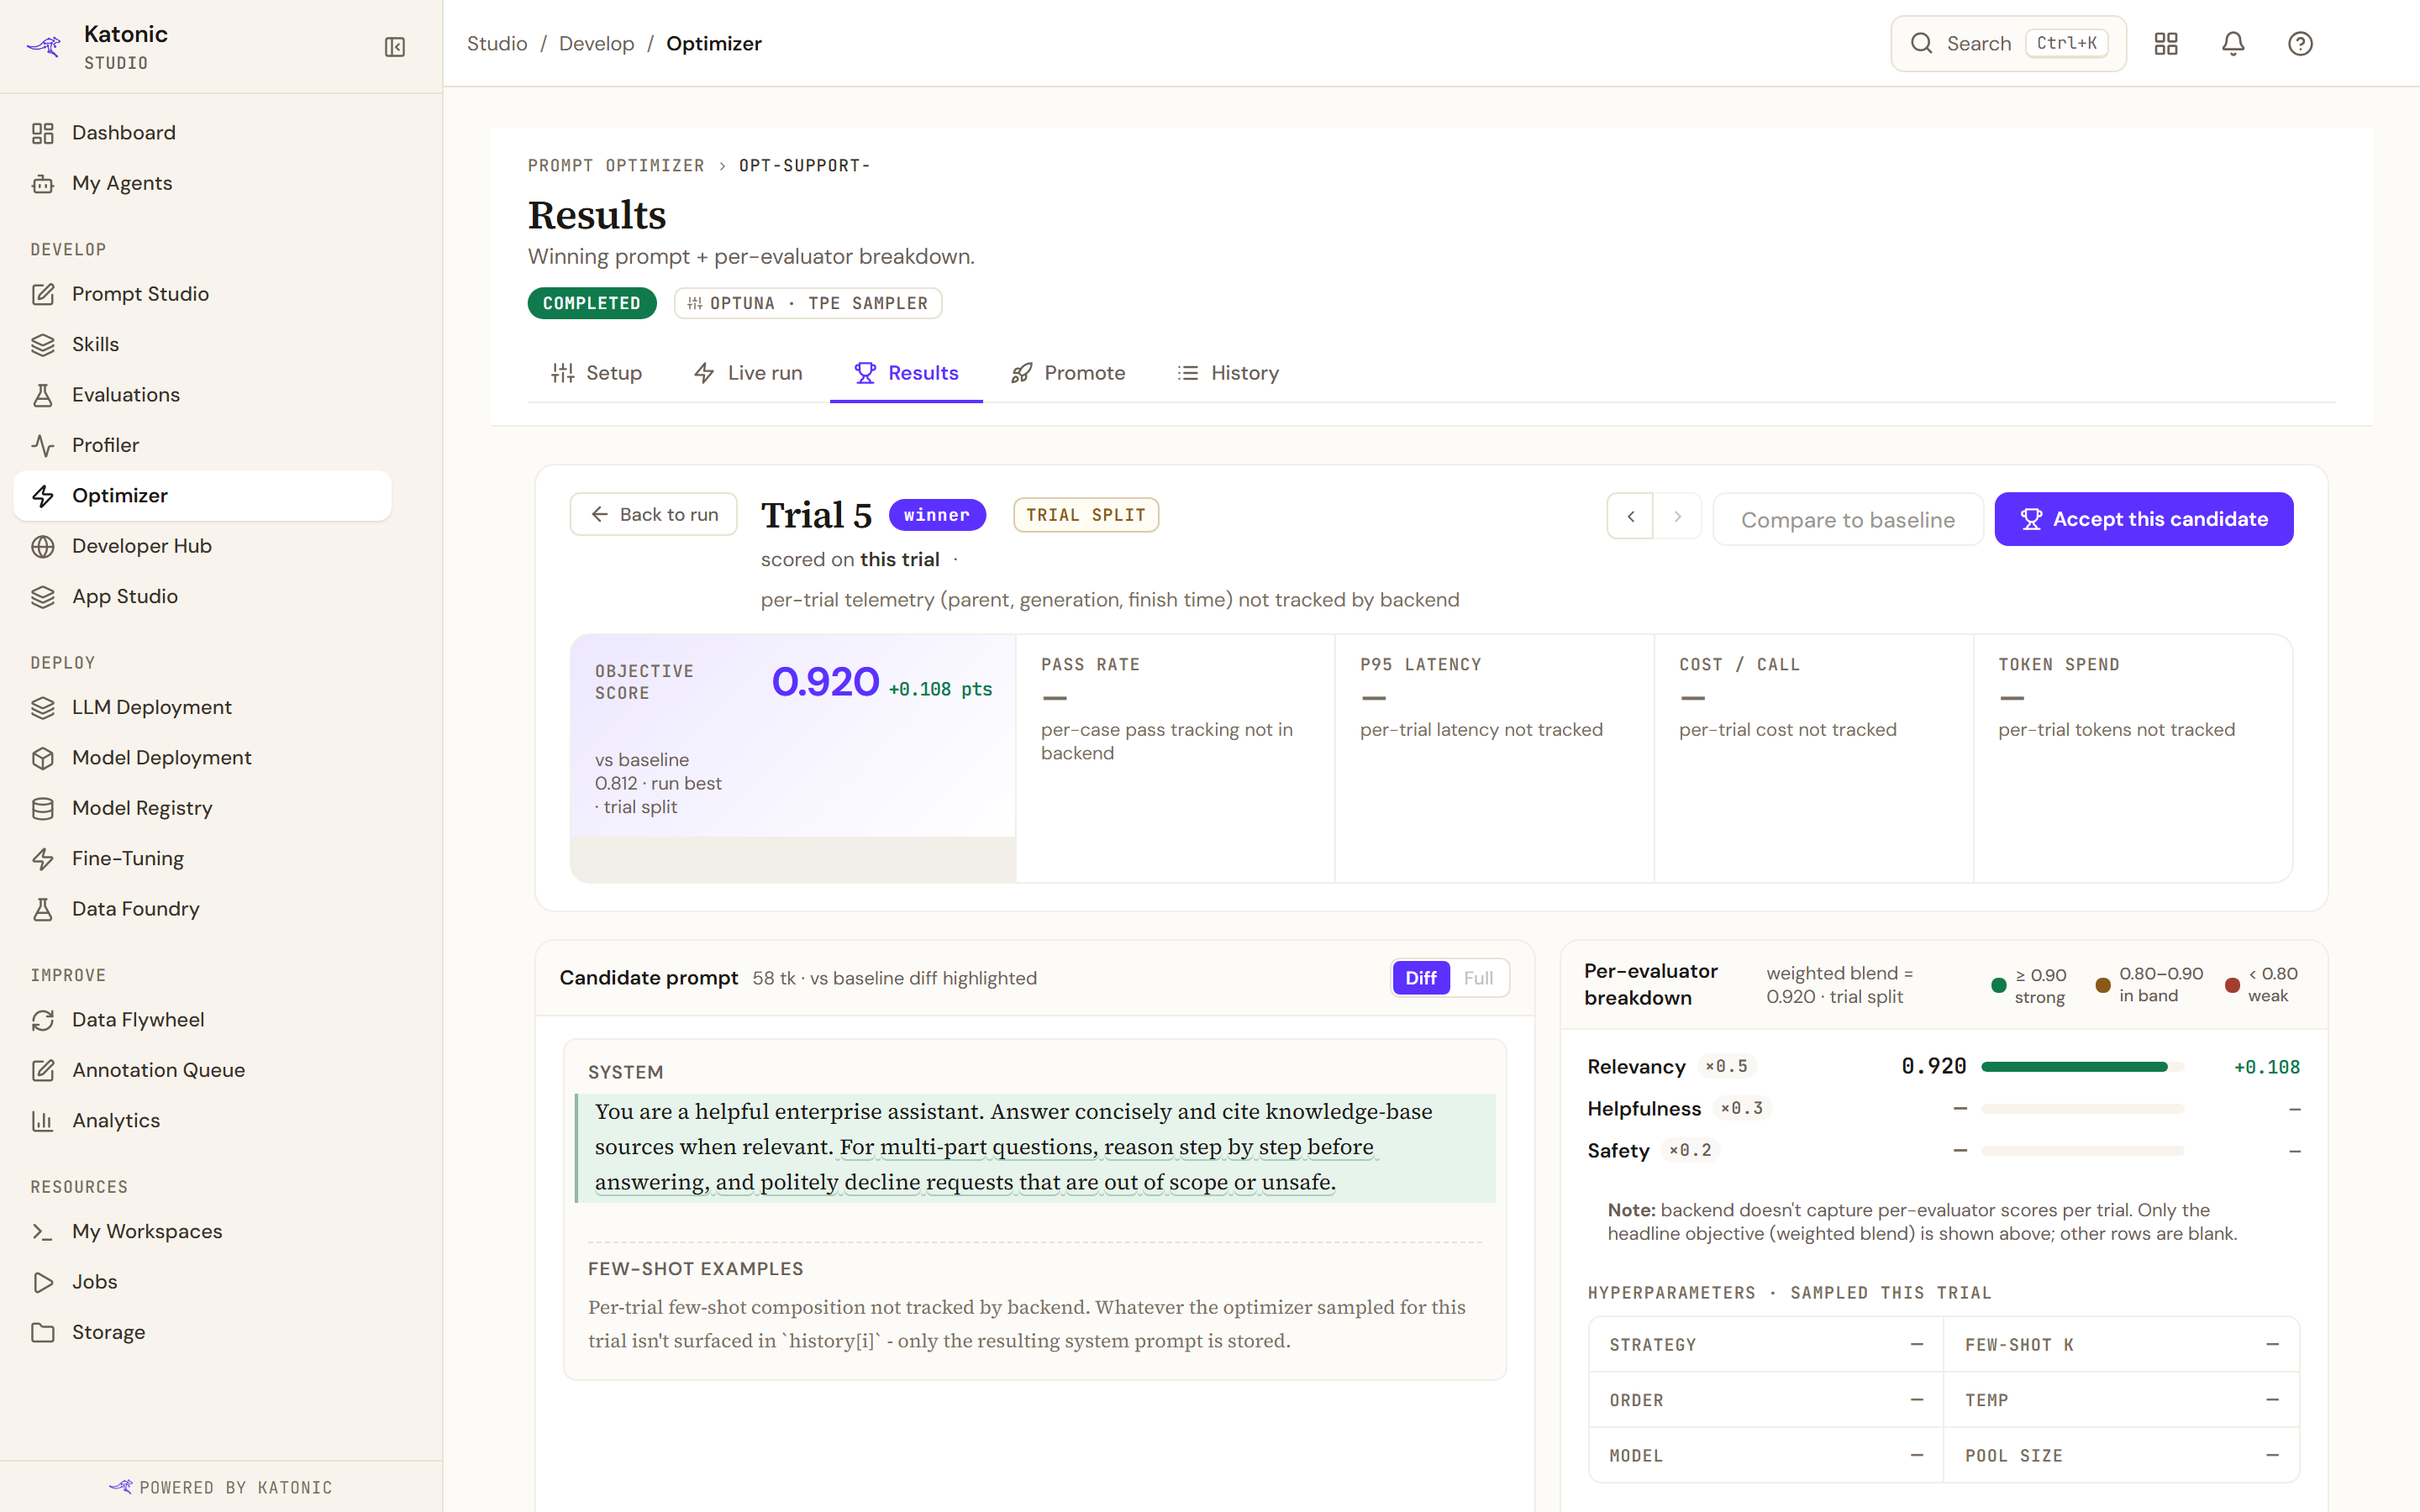
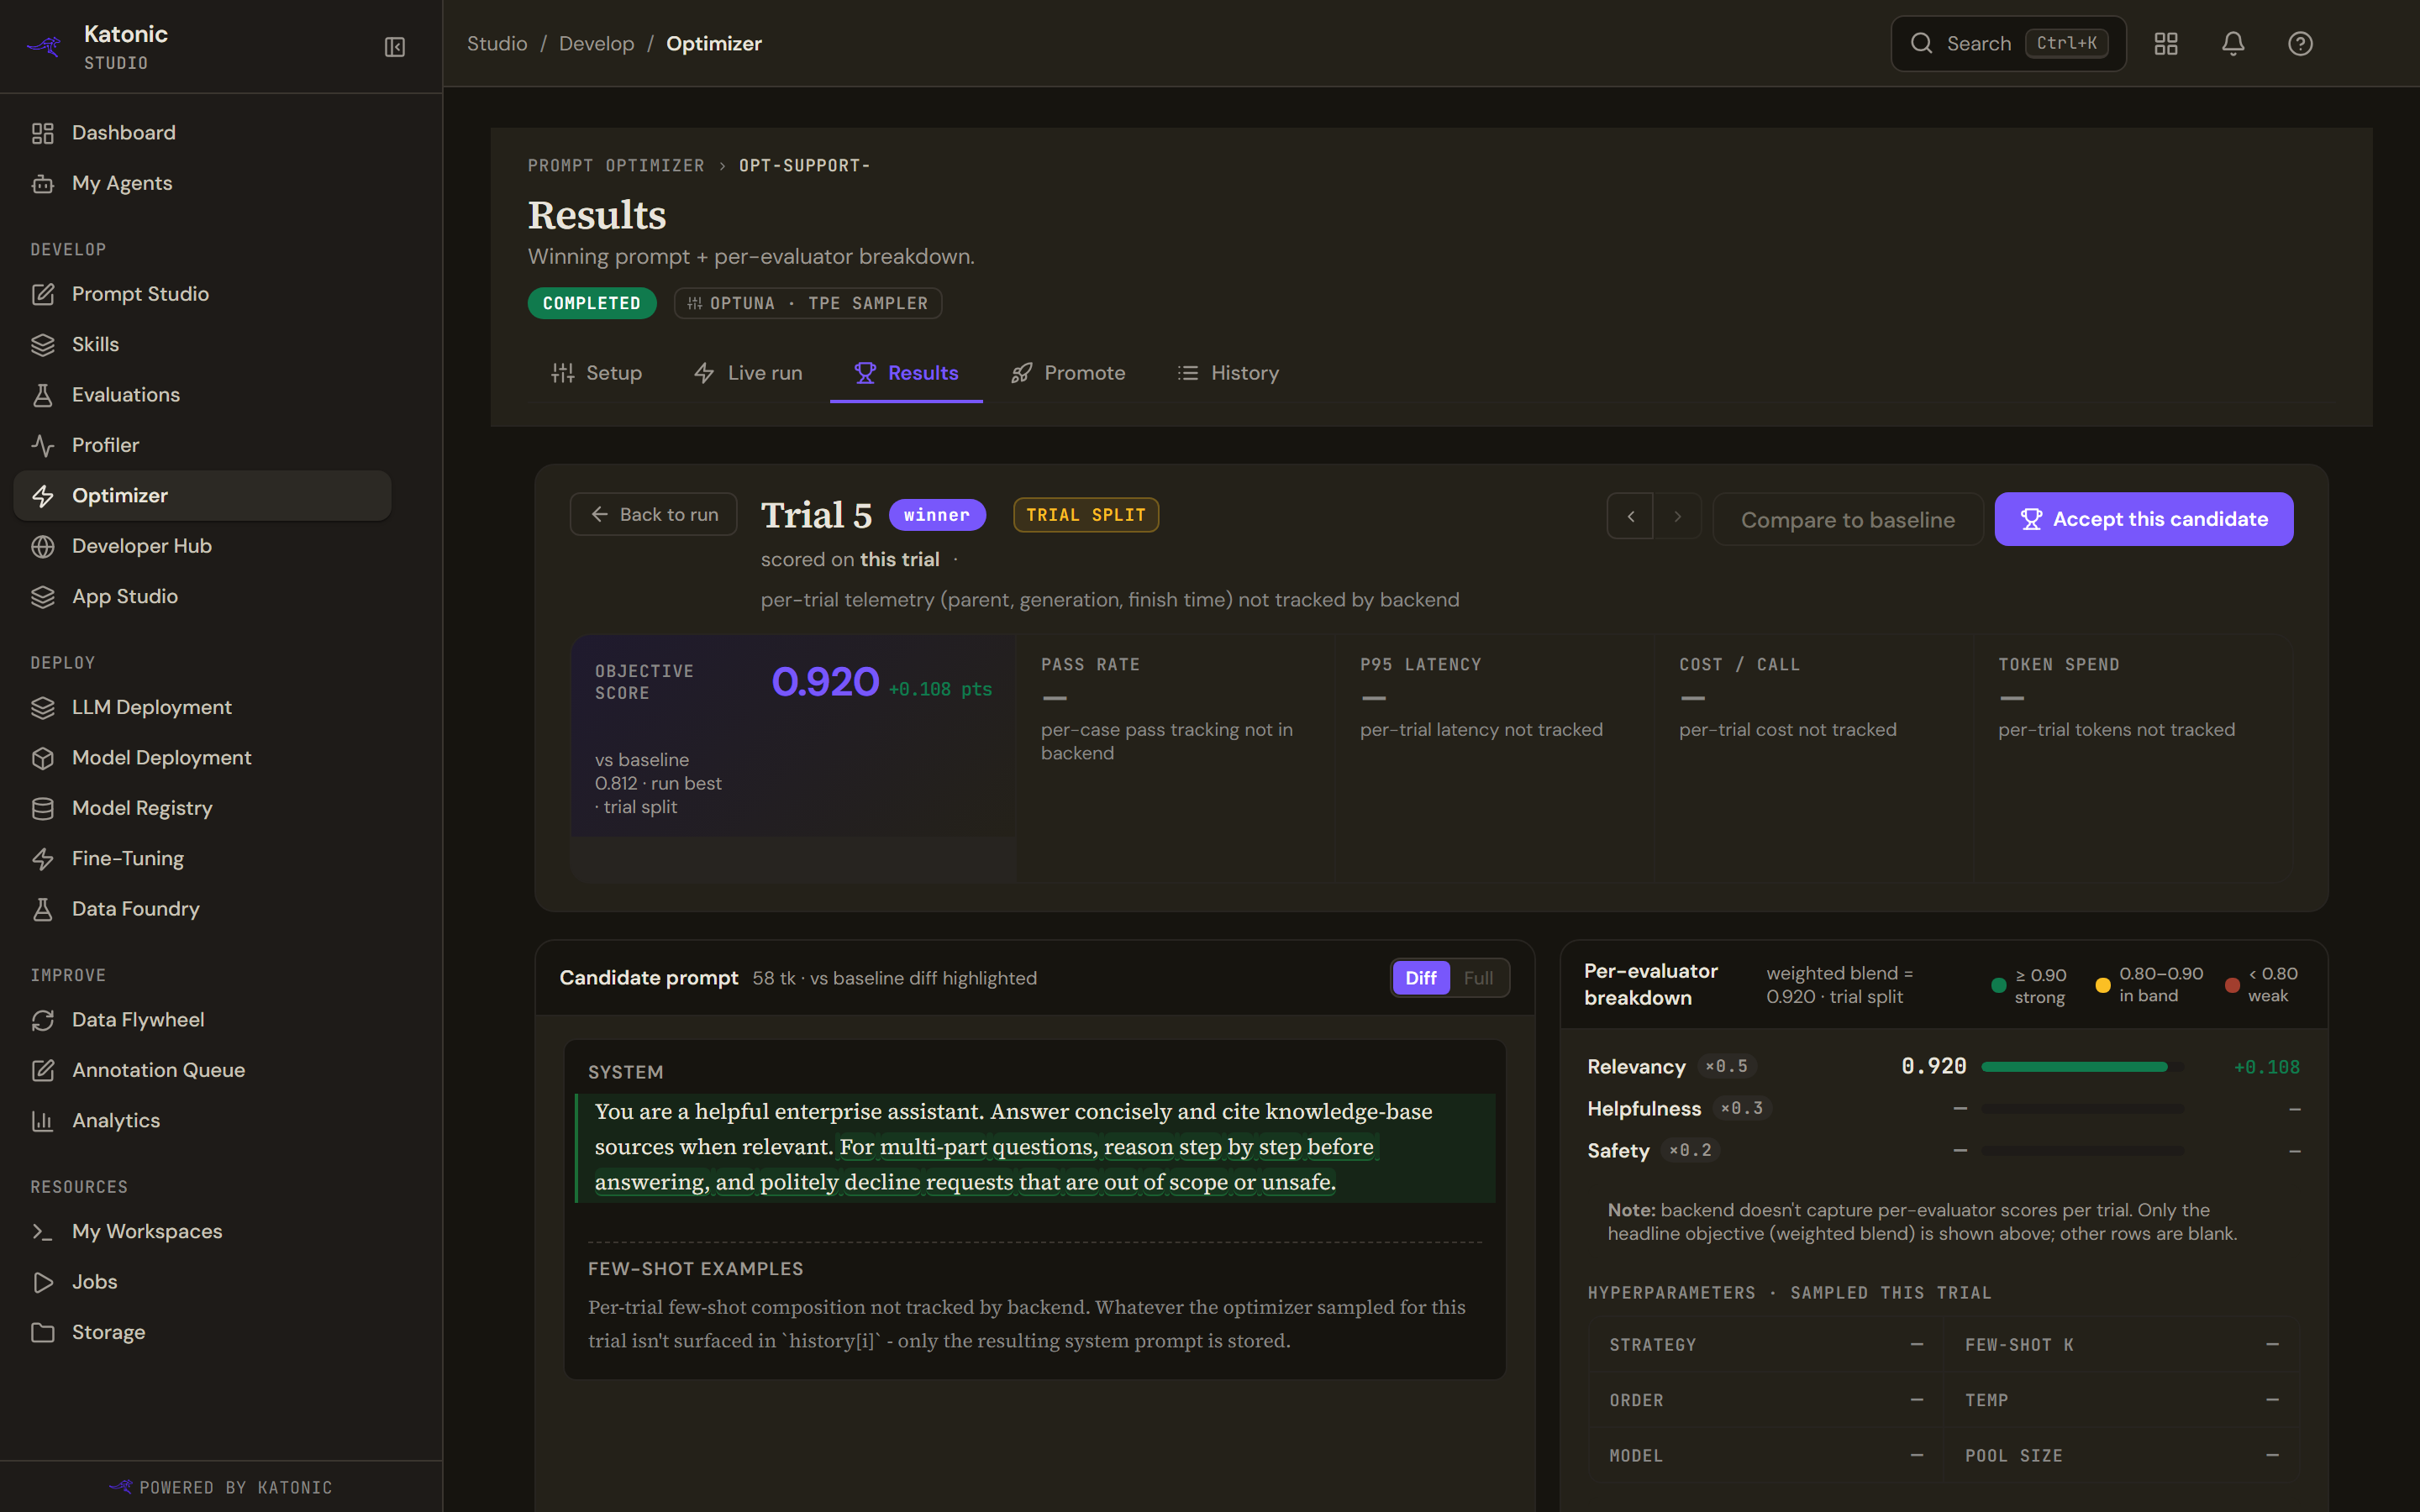
Selecting a trial in the table or the feed opens its page over the run; Back to run returns, and the arrows step to the previous and next trial. The header names the trial, marks the winner, and says the score was measured on the trial split. Accept this candidate is enabled for the winner only and leads to Promote; Compare to baseline is disabled in this release.
The score band gives the Objective score with its difference in points from the baseline. Pass rate, p95 latency, Cost / call and Token spend are shown as dashes, each with a note saying the optimiser does not record that value per trial.
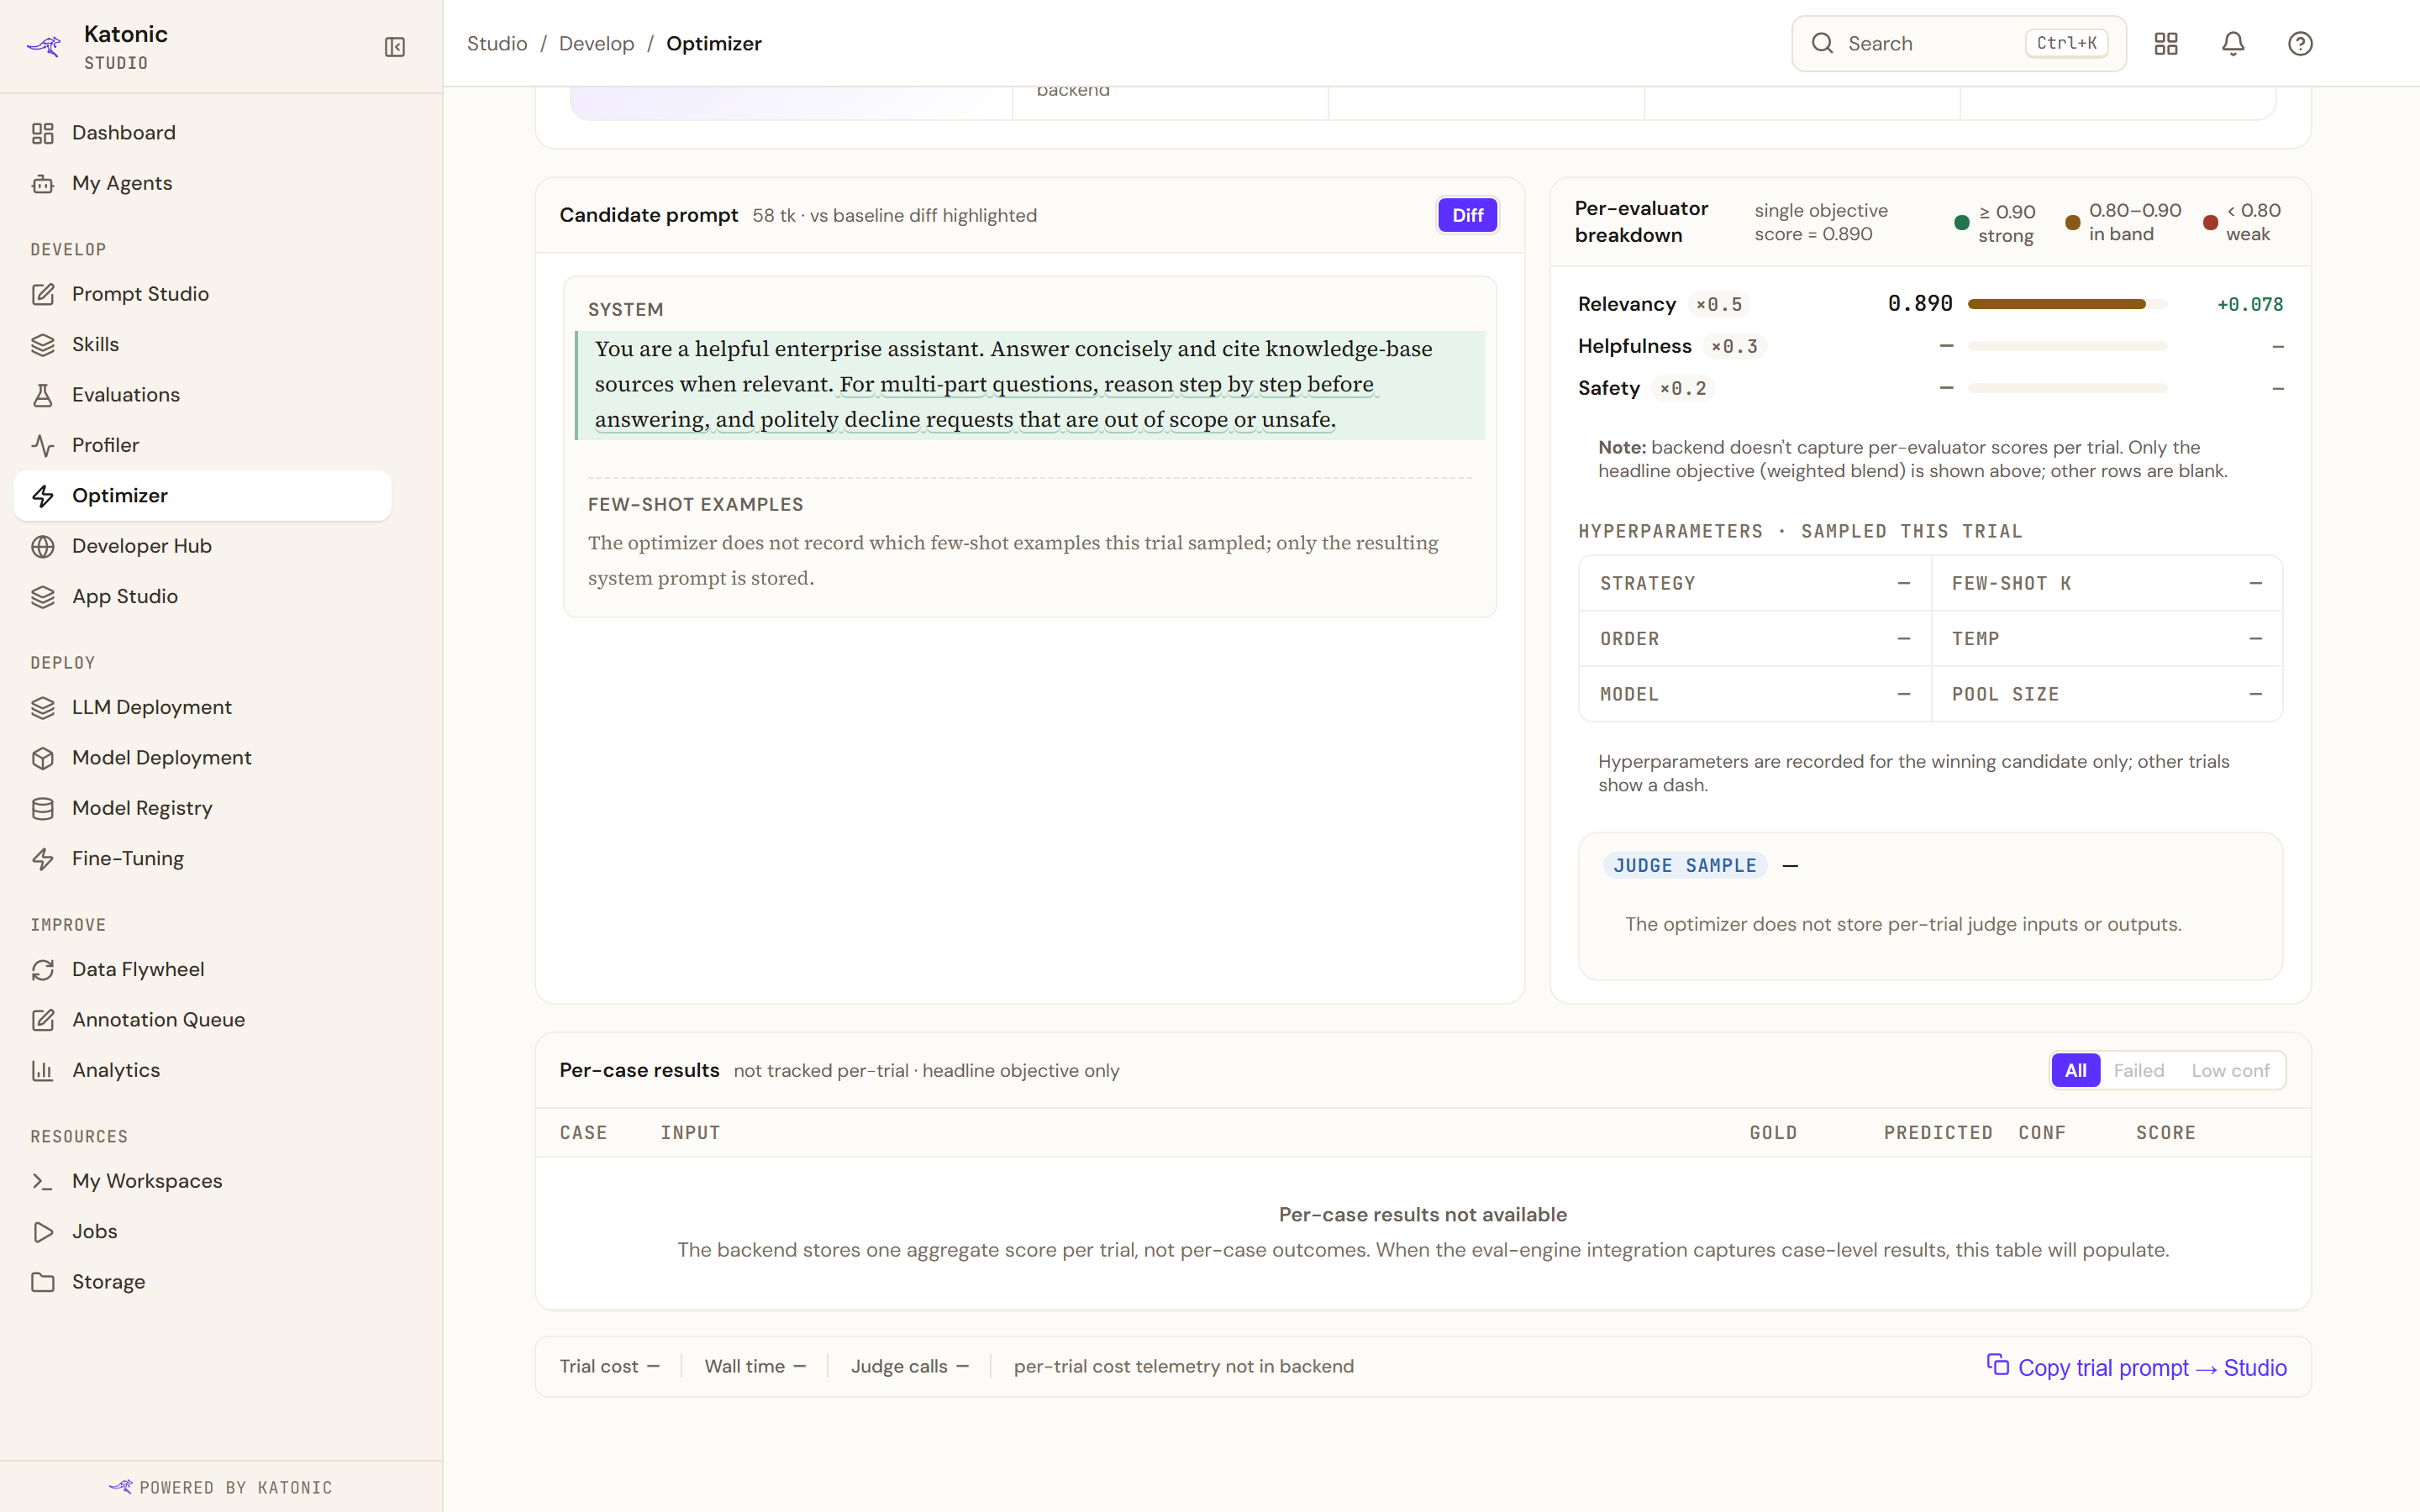
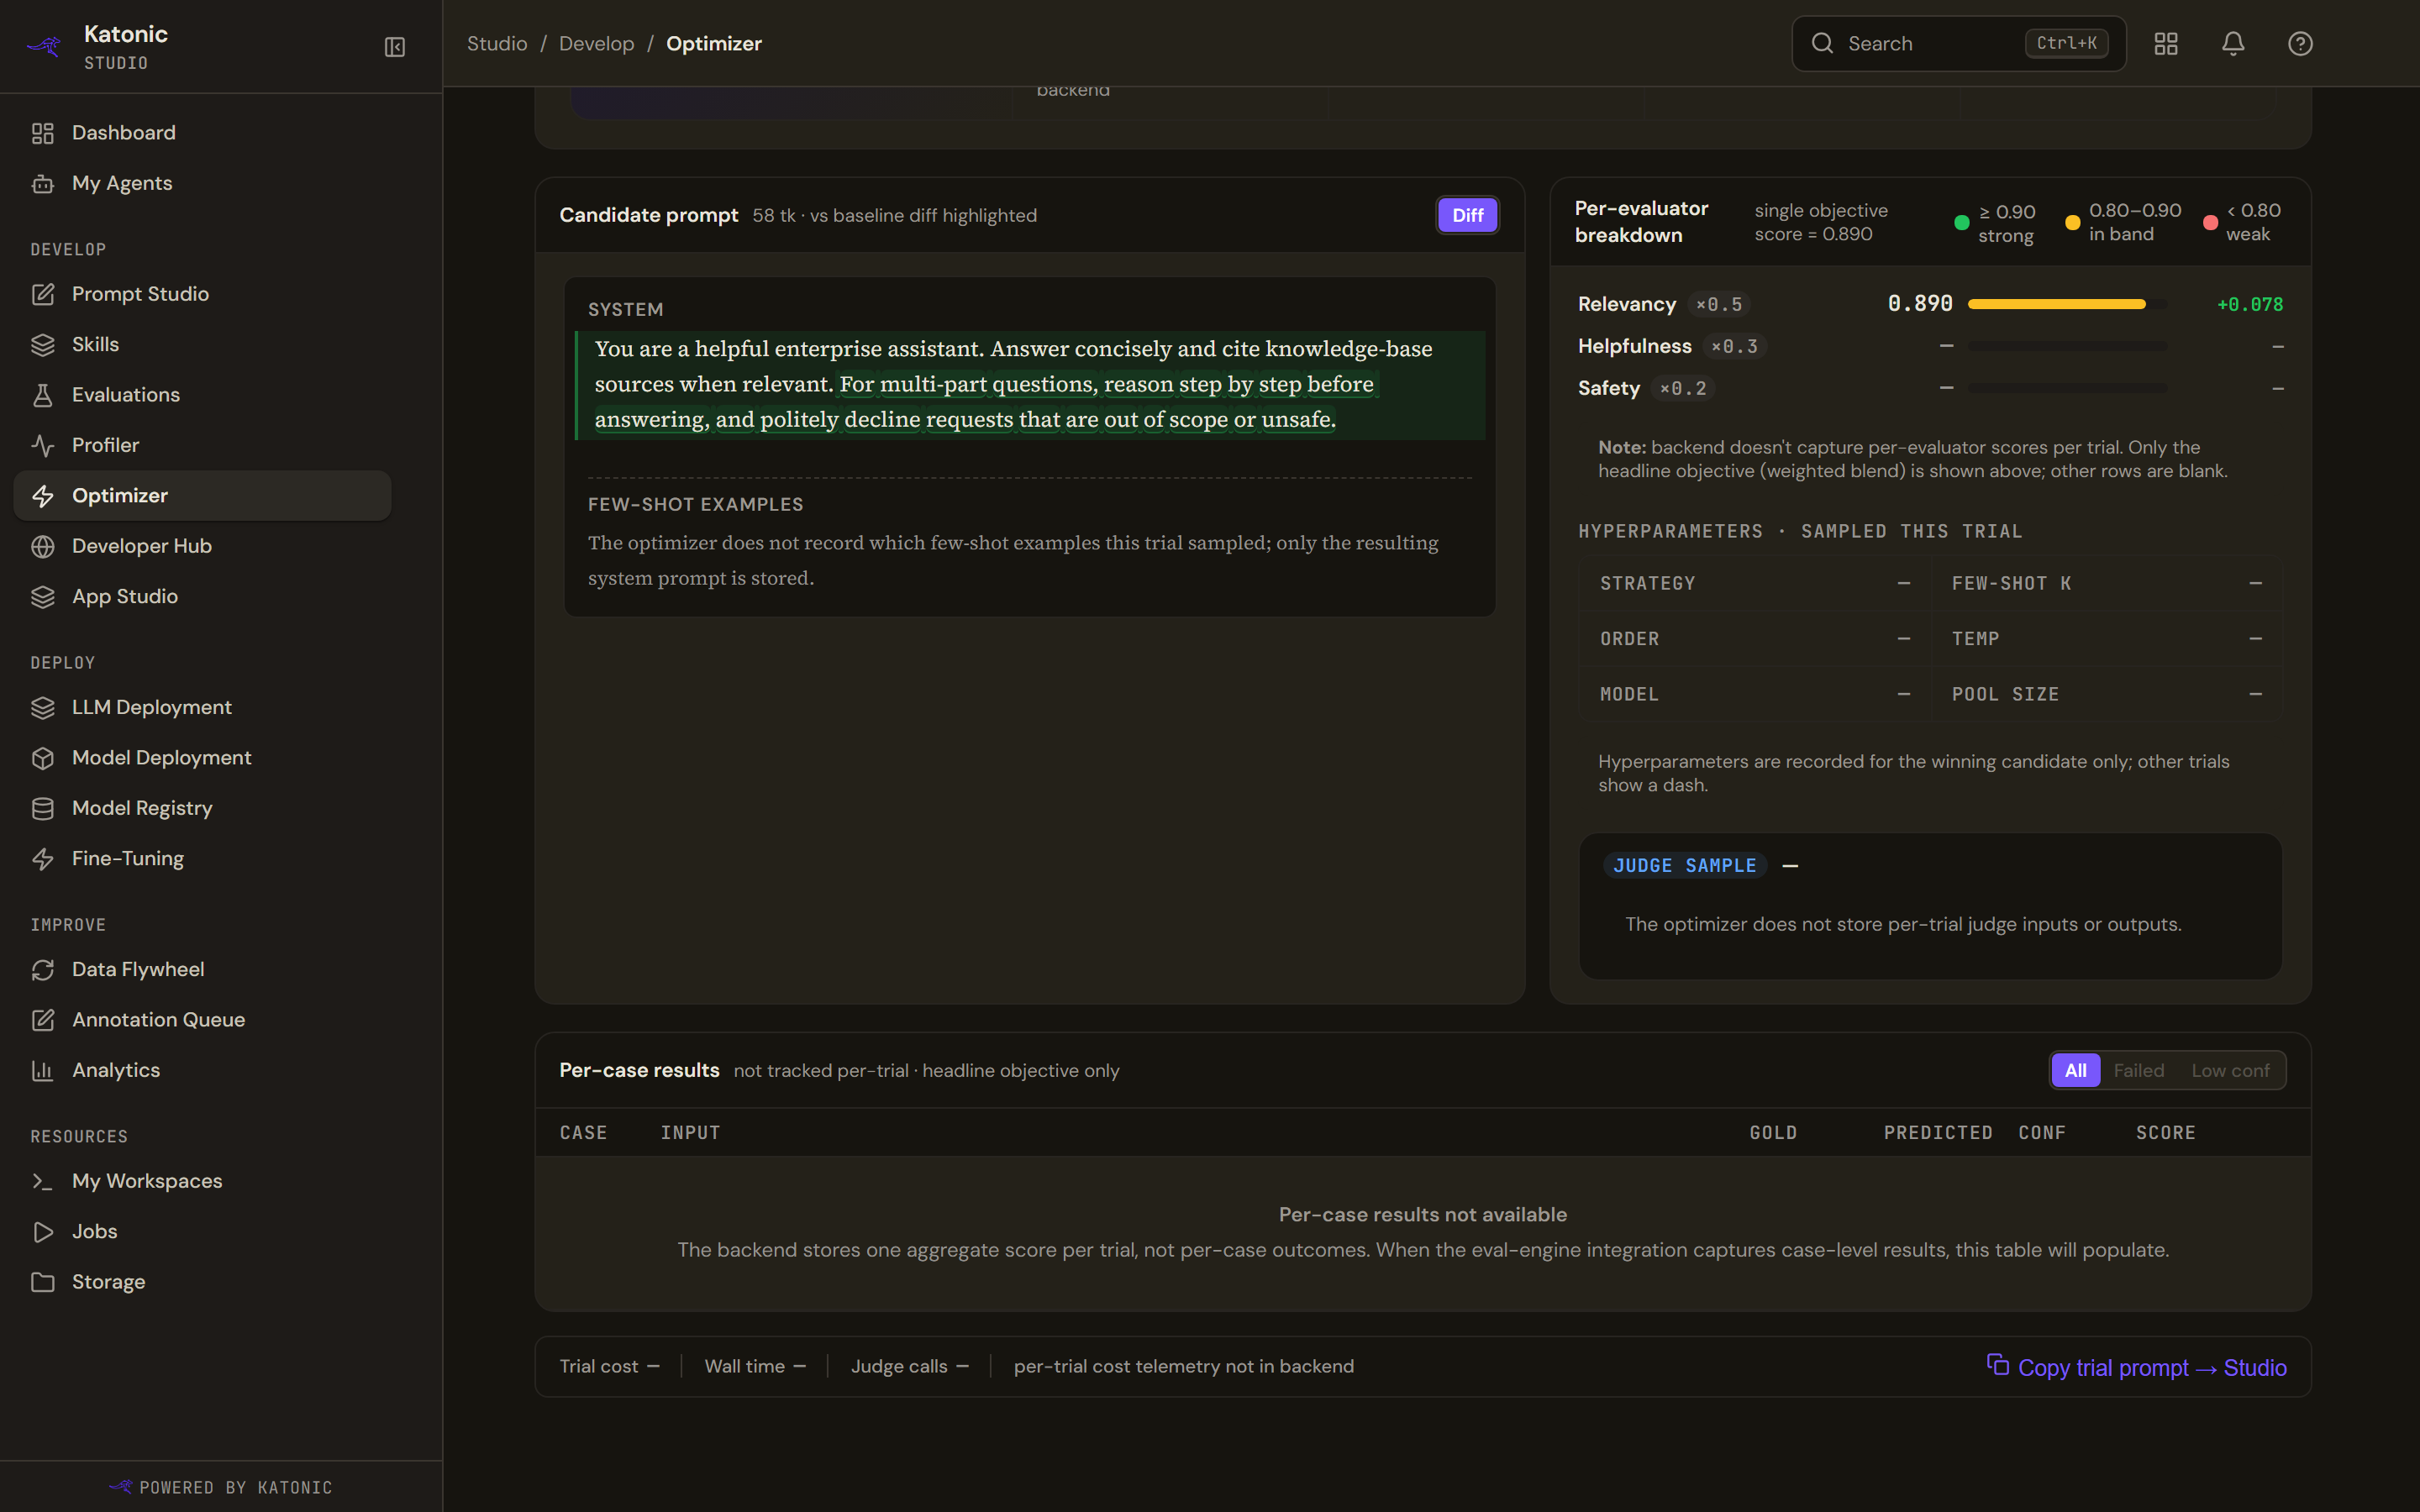
Candidate prompt shows the trial's System prompt with its additions and removals against the baseline highlighted (Diff; Full is disabled) and an estimated token count. The few-shot examples the trial used are not stored, and the card says so. Per-evaluator breakdown shows the weighted blend on the headline row with the legend ≥ 0.90 strong, 0.80 to 0.90 in band and below 0.80 weak; the optimiser does not keep per-evaluator scores per trial, so the other rows are blank. Hyperparameters · sampled this trial lists Strategy, Few-shot K, Order, Temp, Model and Pool size; only the winning trial reads stored values here, and the optimiser records its tuned temperature and top-p in a form these cells do not read, so on current runs every cell is a dash. Per-case results and the judge sample are not available per trial. The foot's Copy trial prompt → Studio opens Prompt Studio.