Work through an agent's issues
Agents
Issues is everything wrong with the agent, grouped by what is actually broken rather than by what threw. A bad answer is an issue here, not only an exception.
Who can use it: the Builder role or higher, in a tenant licensed for agents.
The headline figures
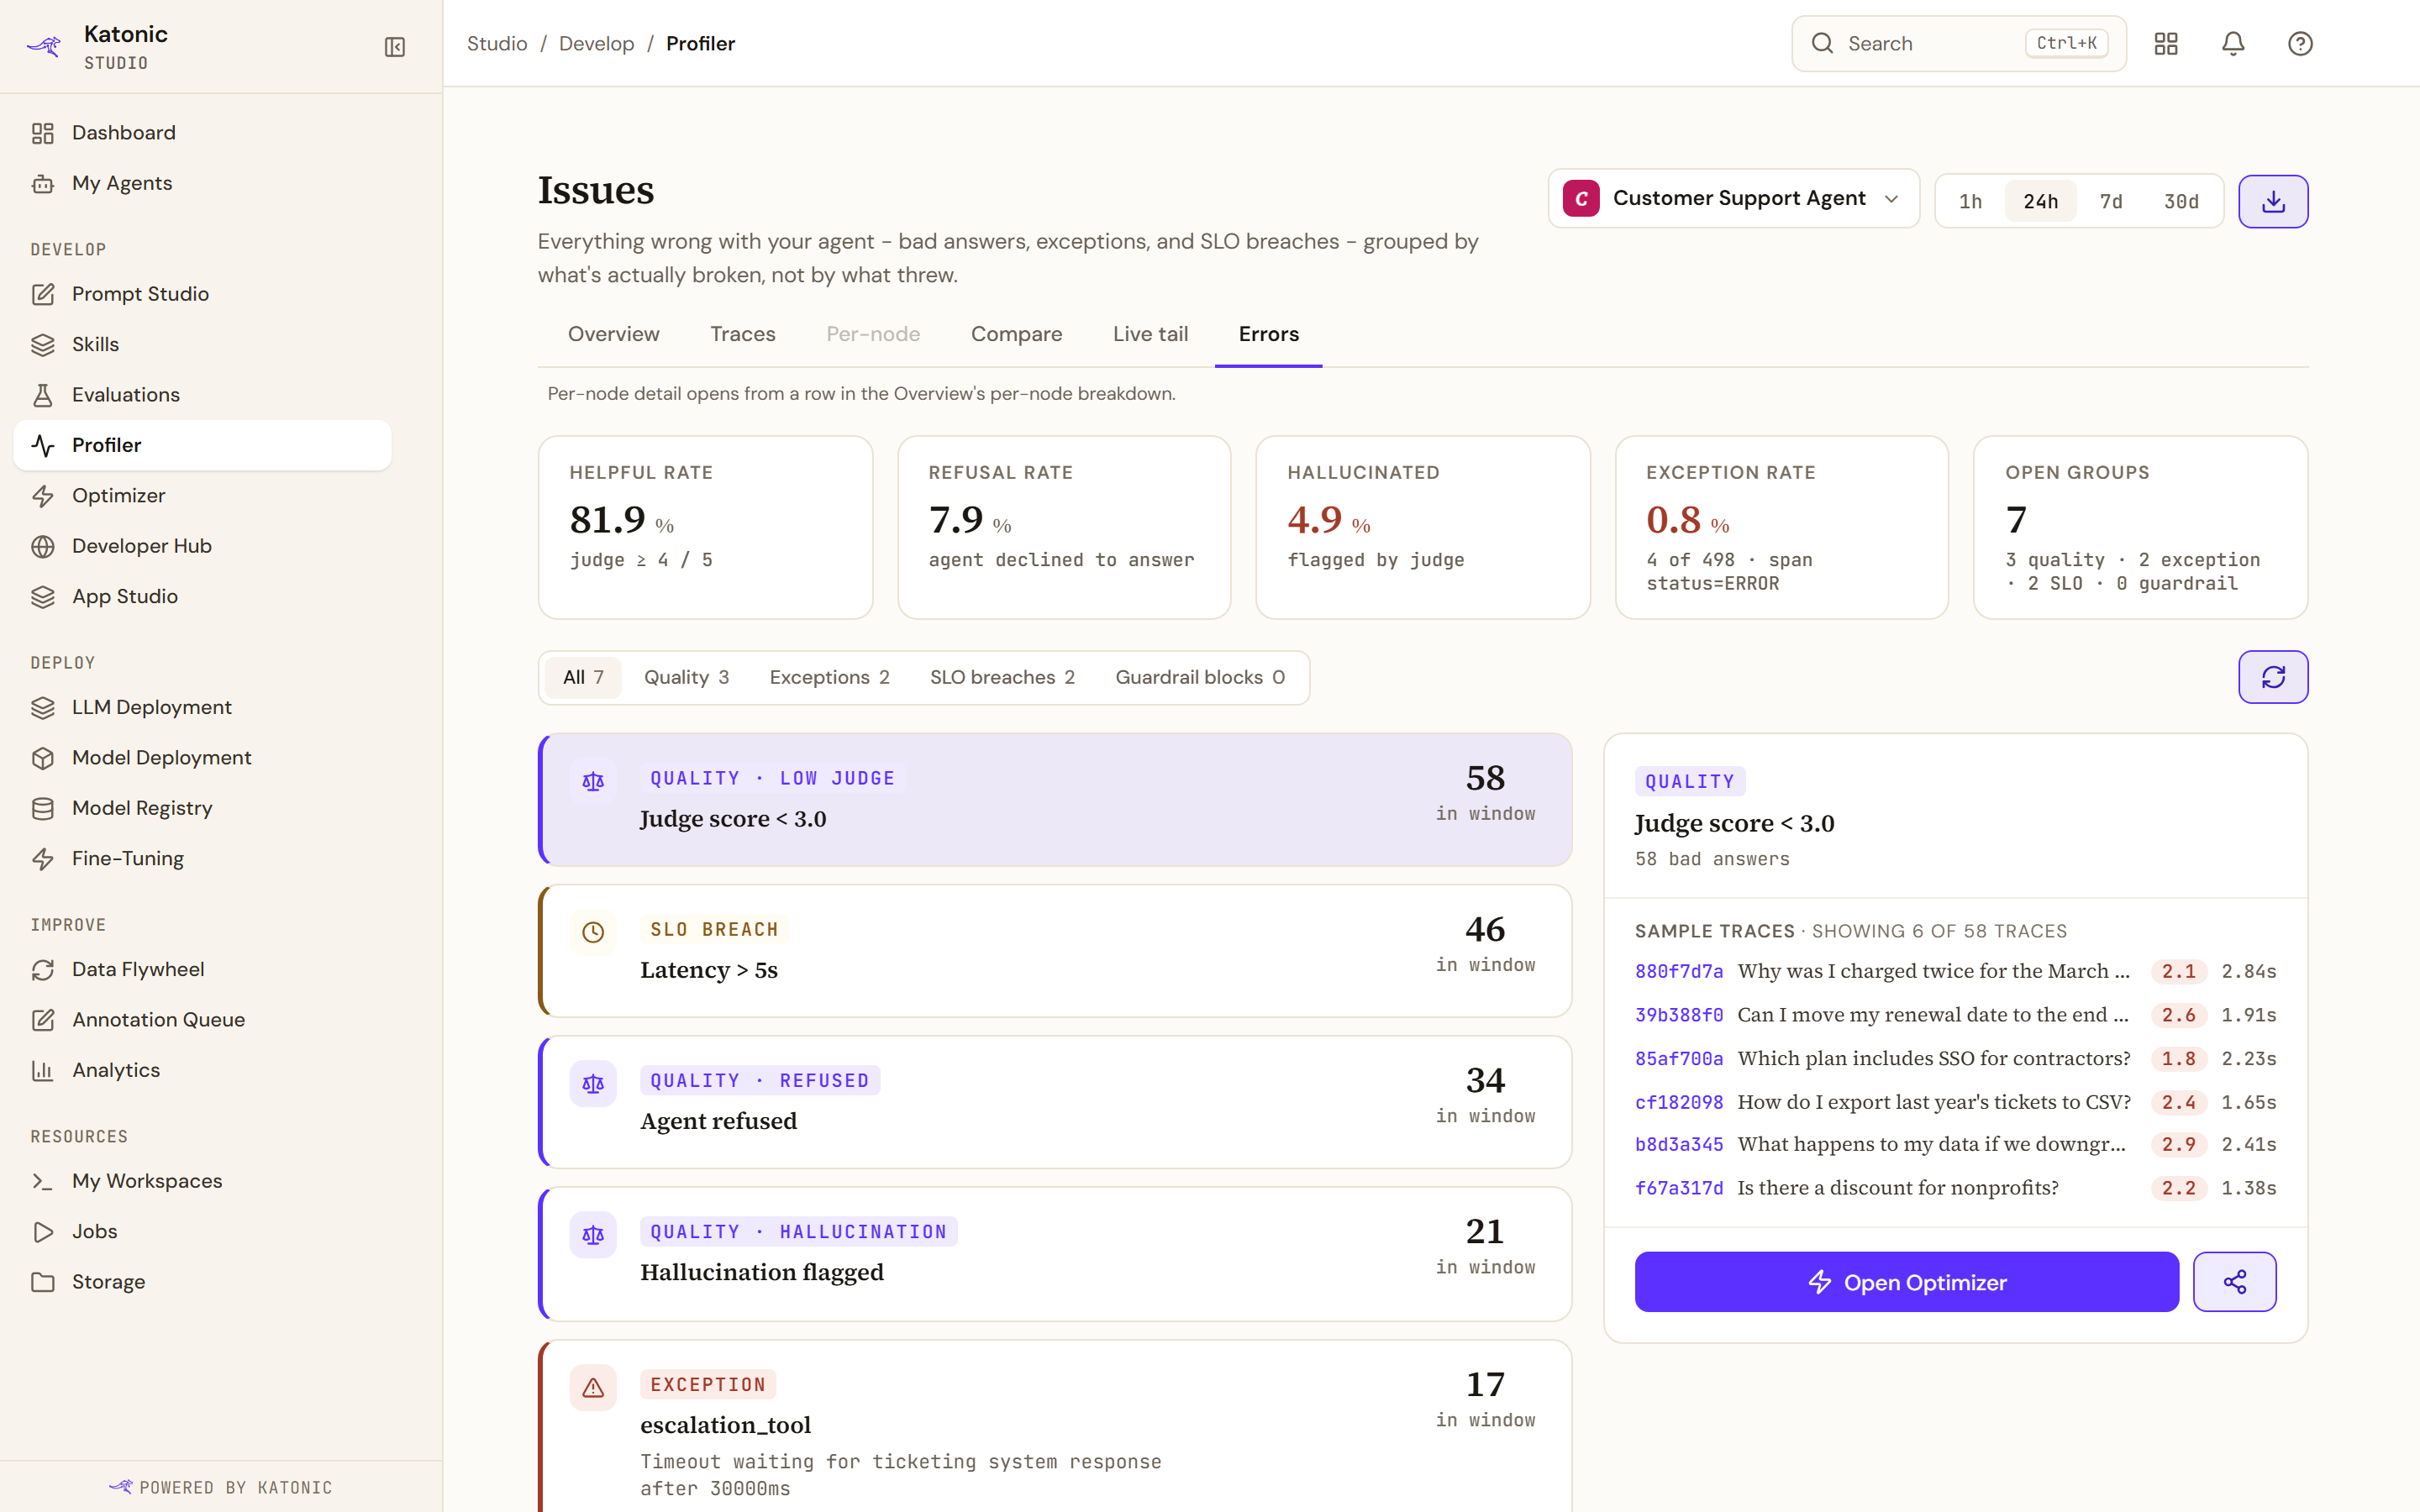
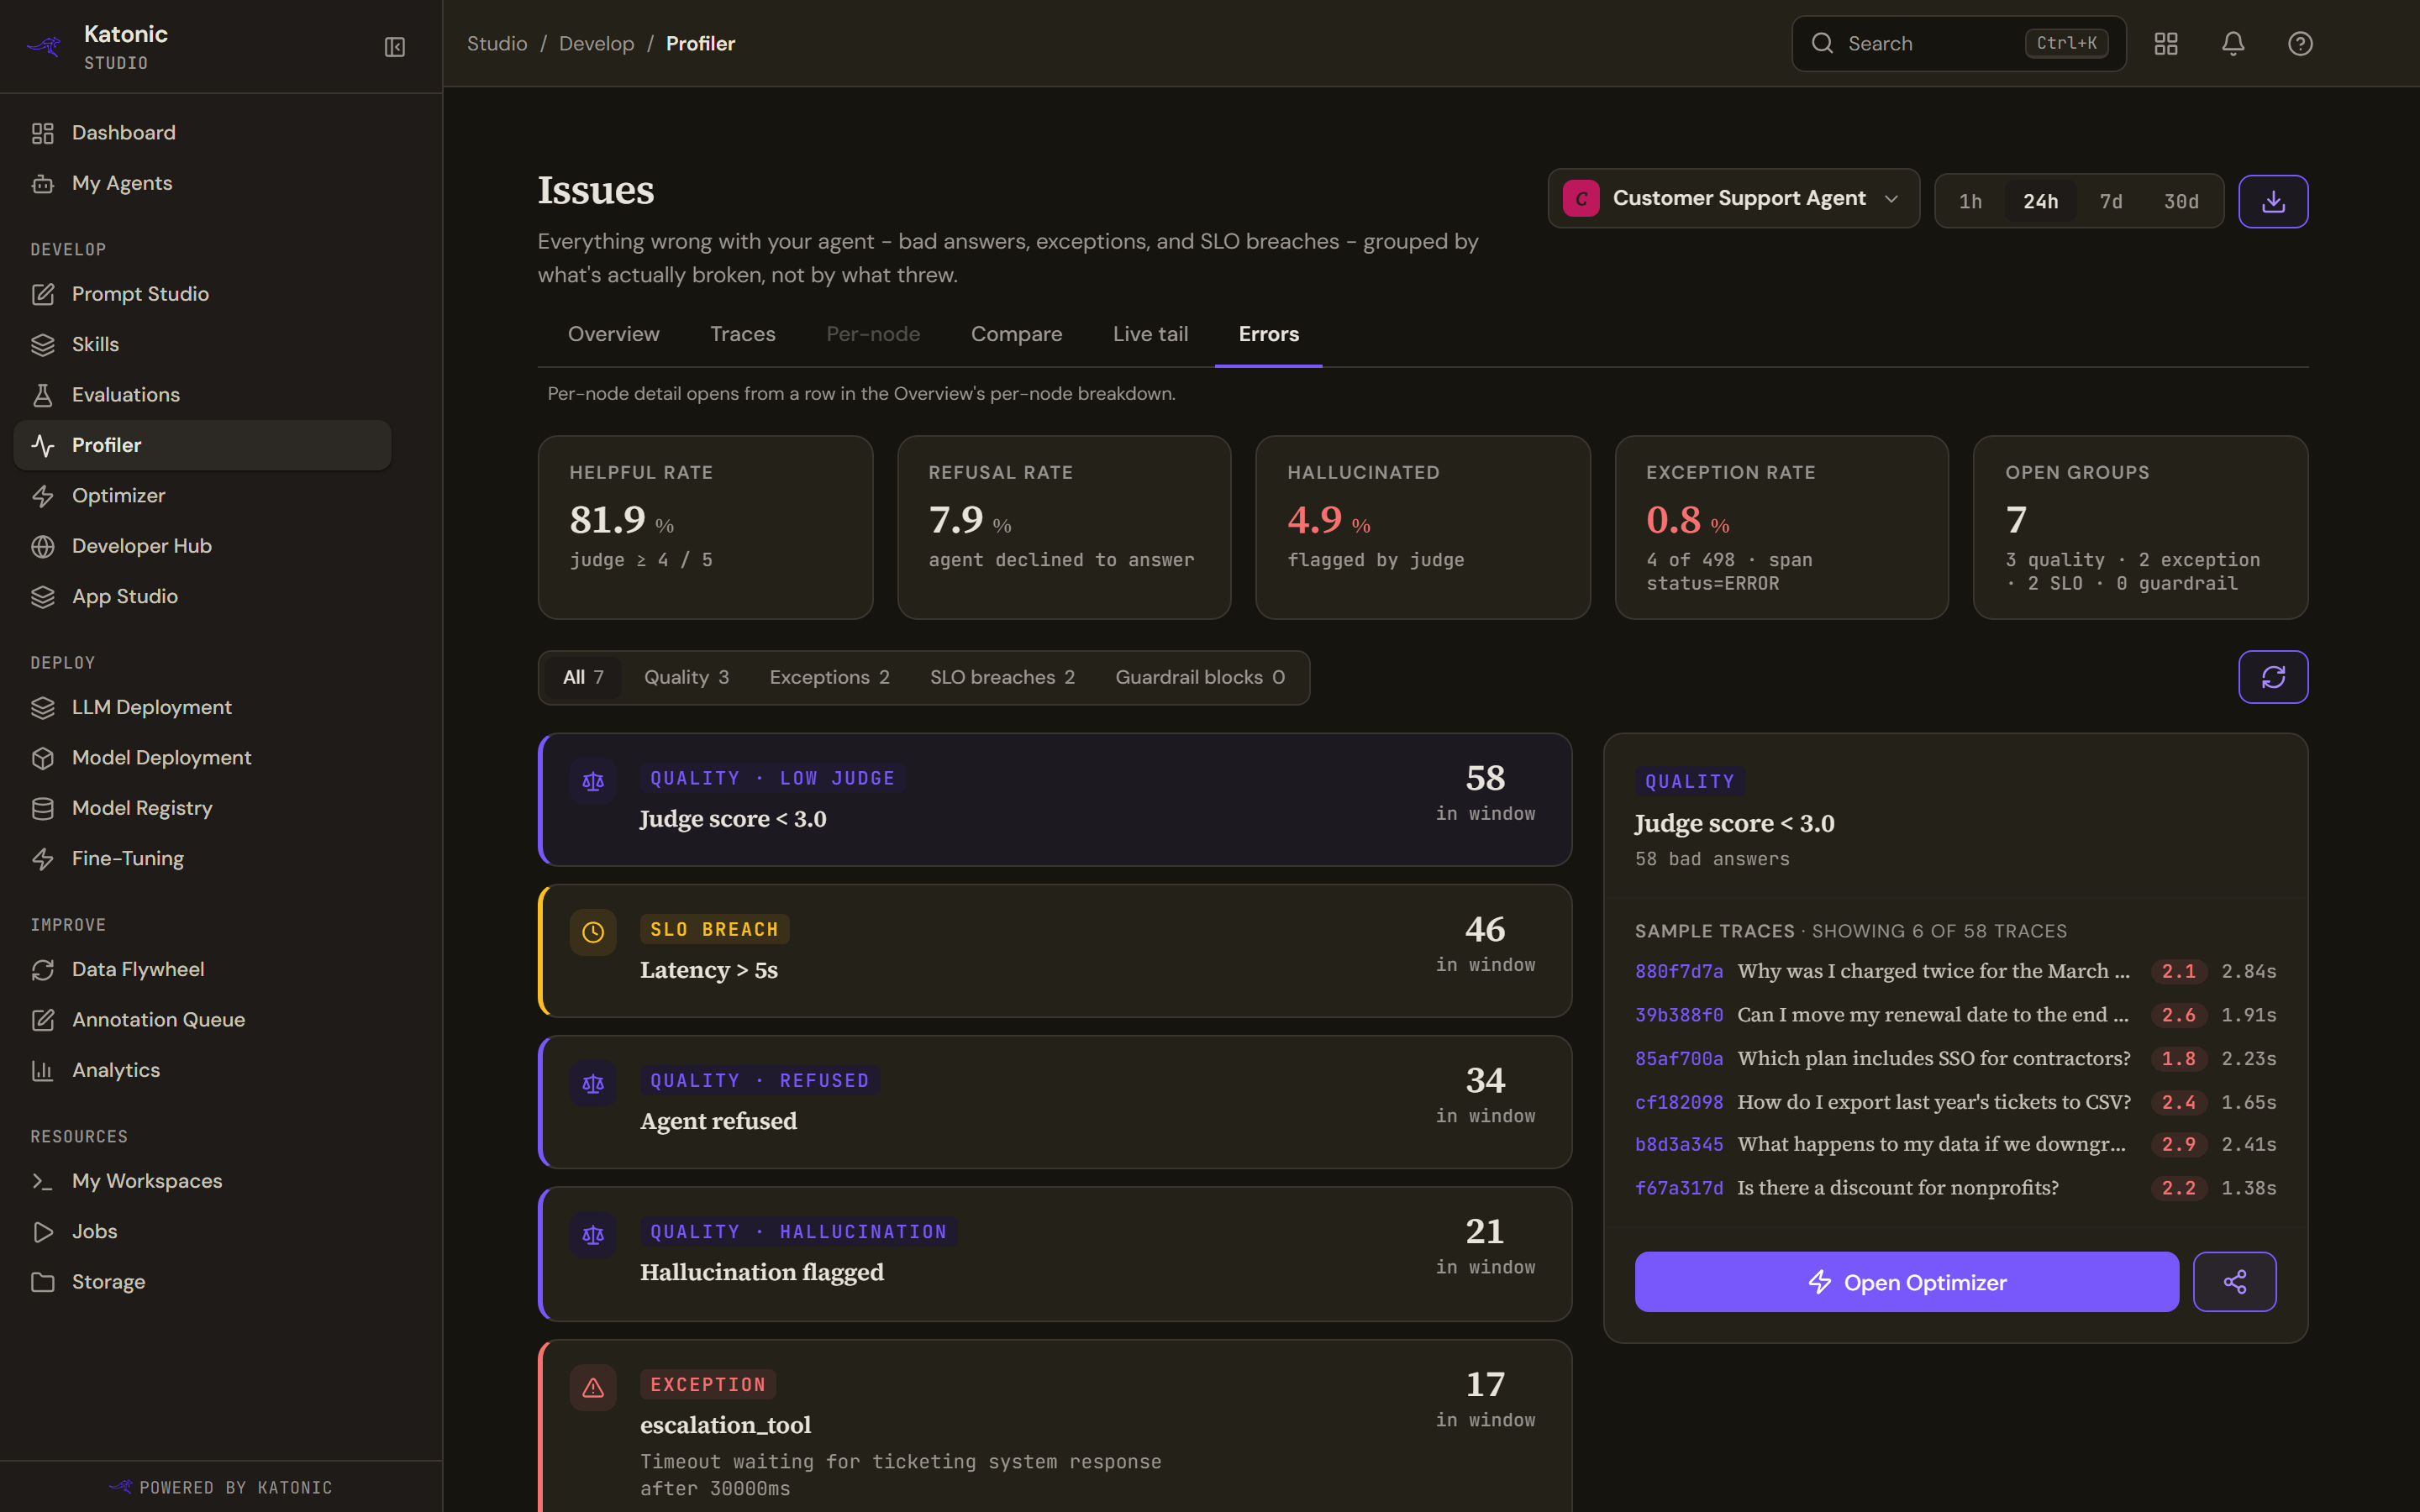
Five figures open the page: the helpful rate, counting judge scores of four and above; the refusal rate, where the agent declined to answer; hallucinated, as flagged by the judge; the exception rate, as a count of traces whose spans ended in error; and the number of open groups, broken down by kind. A figure the platform has not measured reads as a dash, never as zero.
The filter chips are All, Quality, Exceptions and SLO breaches, each with its count, beside a refresh control and an export that downloads the groups and figures as JSON.
The groups
Each group carries a badge naming its kind and, for a quality group, what kind of quality problem it is: refused, hallucination or low judge score. Under the title sit the message or a snippet, the node the group is attributed to where the platform knows it, and how many times it occurred in the window.
Selecting a group fills the rail on the right, and what you get there depends on the kind.
| Kind | The rail shows | Its action |
|---|---|---|
| Quality | The message and sample traces with their questions, scores and latencies | Open Optimizer |
| Exception | The captured exception in a code block, and sample traces | Open in Developer Hub |
| SLO breach | How many traces breached which threshold, and sample traces | Investigate node, enabled only when the group is attributed to one node |
A sample trace opens that trace in full. Each rail also offers a share control.
When there is nothing
No issues detected is the healthy state, and the note under it says when each kind of group can appear at all: quality clusters once the judge has evaluated enough traces, exception groups when spans complete with an error status, and SLO groups when a configured SLO is breached. A healthy agent stays empty, which is the point.
Troubleshooting
- Couldn't load issues. The observability service returned an error. The message says this is a service error, not a healthy agent, and Retry repeats the request.
- No quality groups, ever. The judge runner is not evaluating this tenant's traces. The empty state names that as the first condition.
- Investigate node is dimmed. The breach group is not attributed to a single node, and the tooltip says so.