Read the Profiler Overview
Agents
The Overview is the Profiler's answer to "how is this agent doing?". It leads with quality, because a fast cheap agent that answers badly is not doing well, and then shows what that quality costs in time and money.
Who can use it: the Builder role or higher, in a tenant licensed for agents.
Answer quality
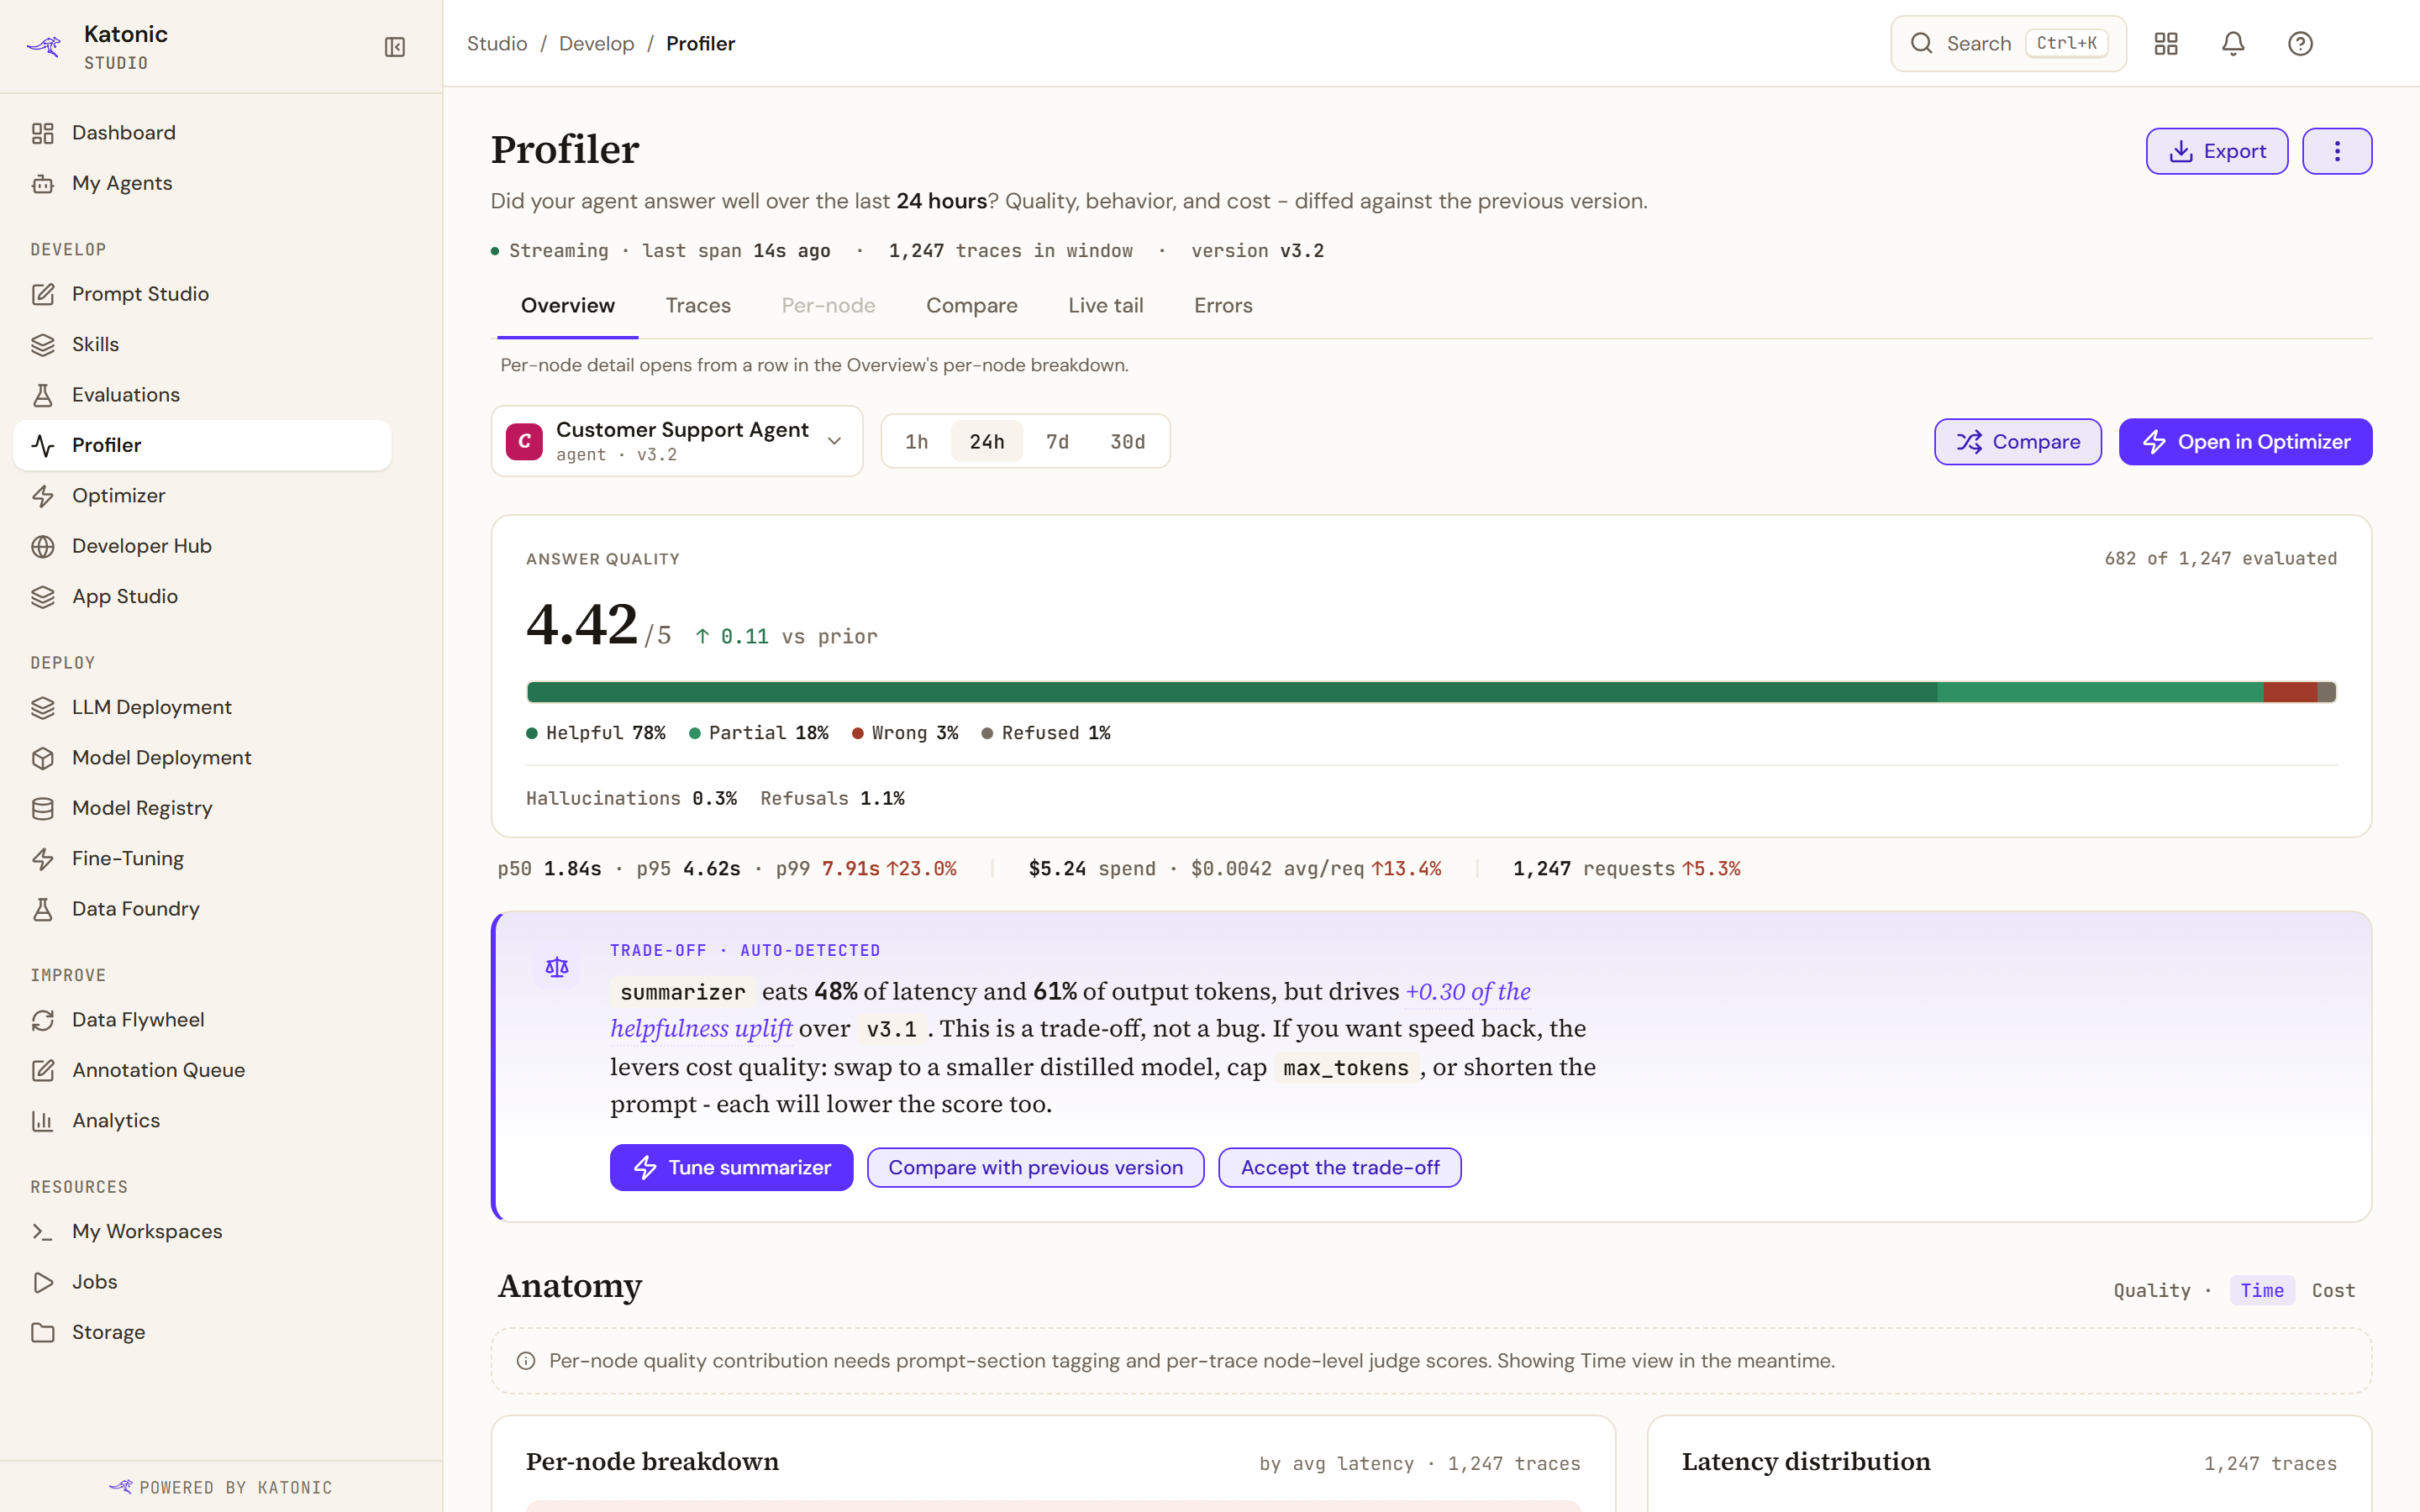
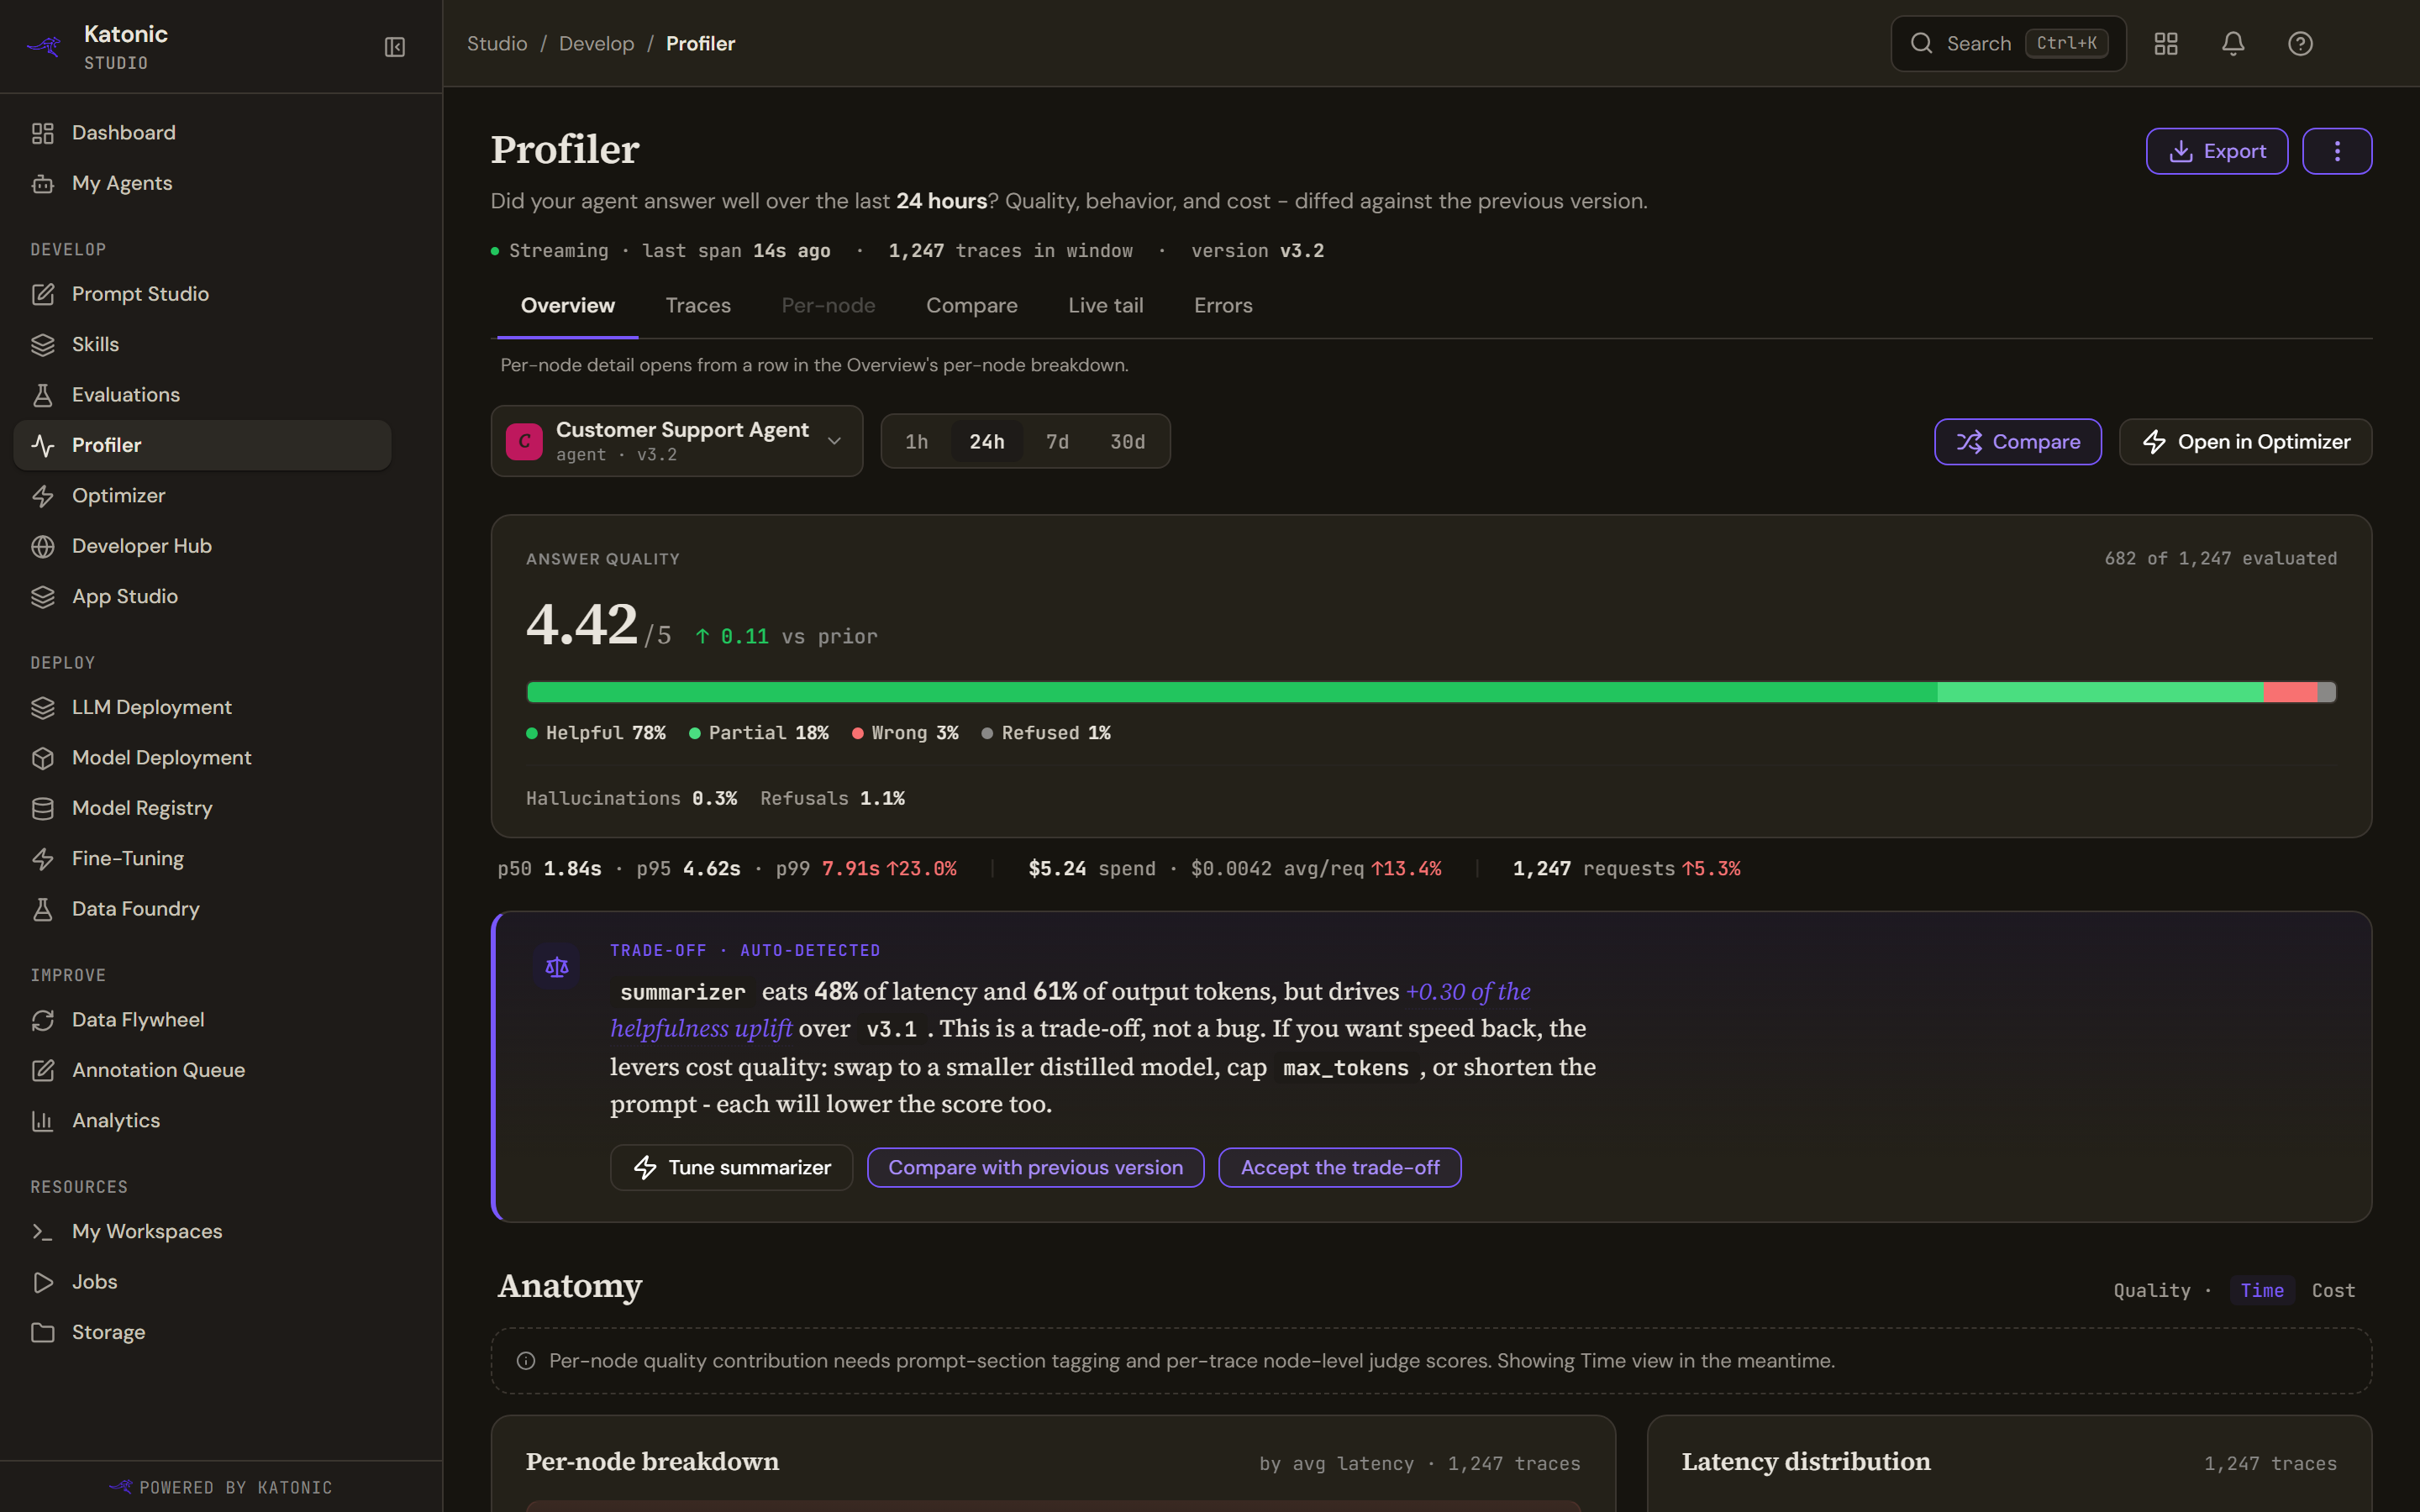
Answer quality is the first card. It shows the mean judge score out of five with its change against the previous window, how many traces were evaluated out of how many exist, and a bar splitting those answers into Helpful, Partial, Wrong and Refused. Where the judge reports them, hallucination and refusal rates follow.
If no judge has run, the card says auto-eval is not configured and that the Profiler cannot tell you whether the answers are good until a judge runs, and offers Enable auto-eval, which opens Evaluations.
Beneath it sit the figures that quality costs: the latency percentiles p50, p95 and p99 with the change on p99, total spend with the average per request, and the request count. A sample too small to be meaningful is marked as such rather than printed.
The trade-off
When one node dominates, a Trade-off card appears, marked auto-detected. It names the node, says what share of latency and of output tokens it takes, and then says whether that is worth it: either the node drives a measurable share of the helpfulness uplift over the previous version, in which case the card explains that the ways to get the time back (a smaller model, a lower token cap, a shorter prompt) will also cost quality, or it drives none, in which case the card calls it a probable regression.
Its three actions are to tune that node in the Optimizer, to compare with the previous version, and to accept the trade-off, which dismisses the card for the session.
Anatomy
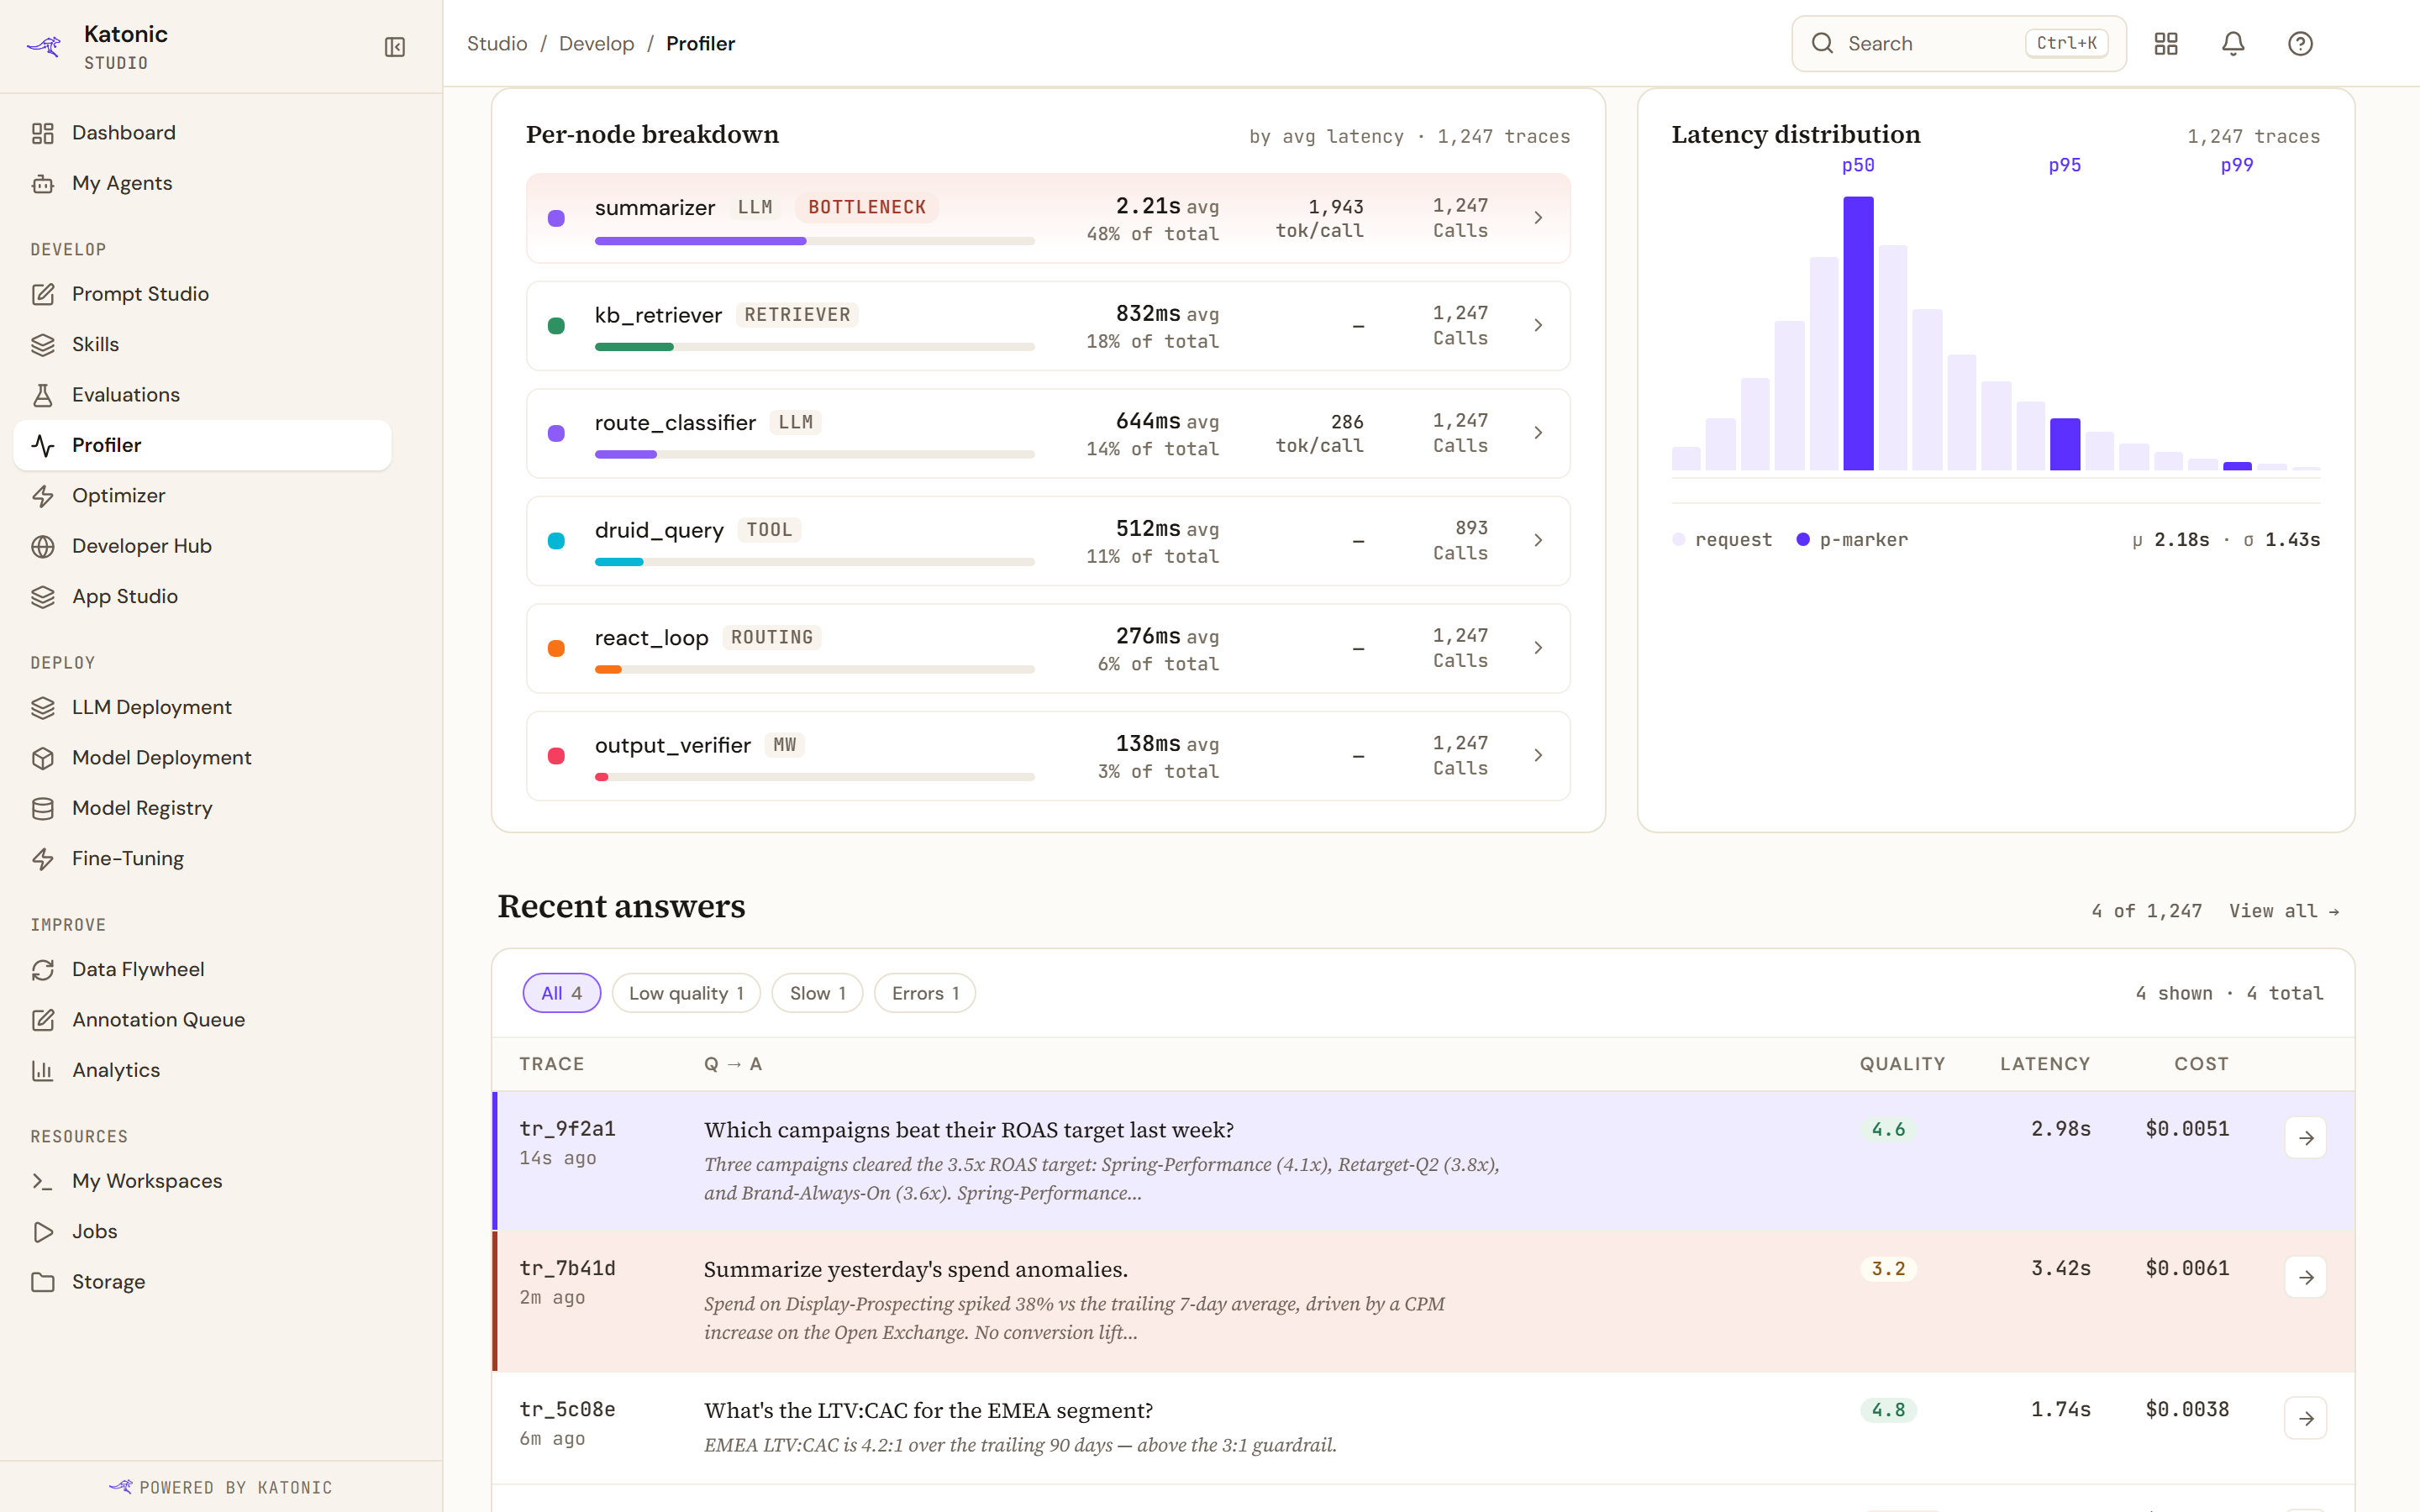
Anatomy breaks the agent into its nodes. Time and Cost switch what the rows are sorted and sized by; the Quality view is present but dimmed, and a note explains that per-node quality needs prompt-section tagging and per-node judge scores.
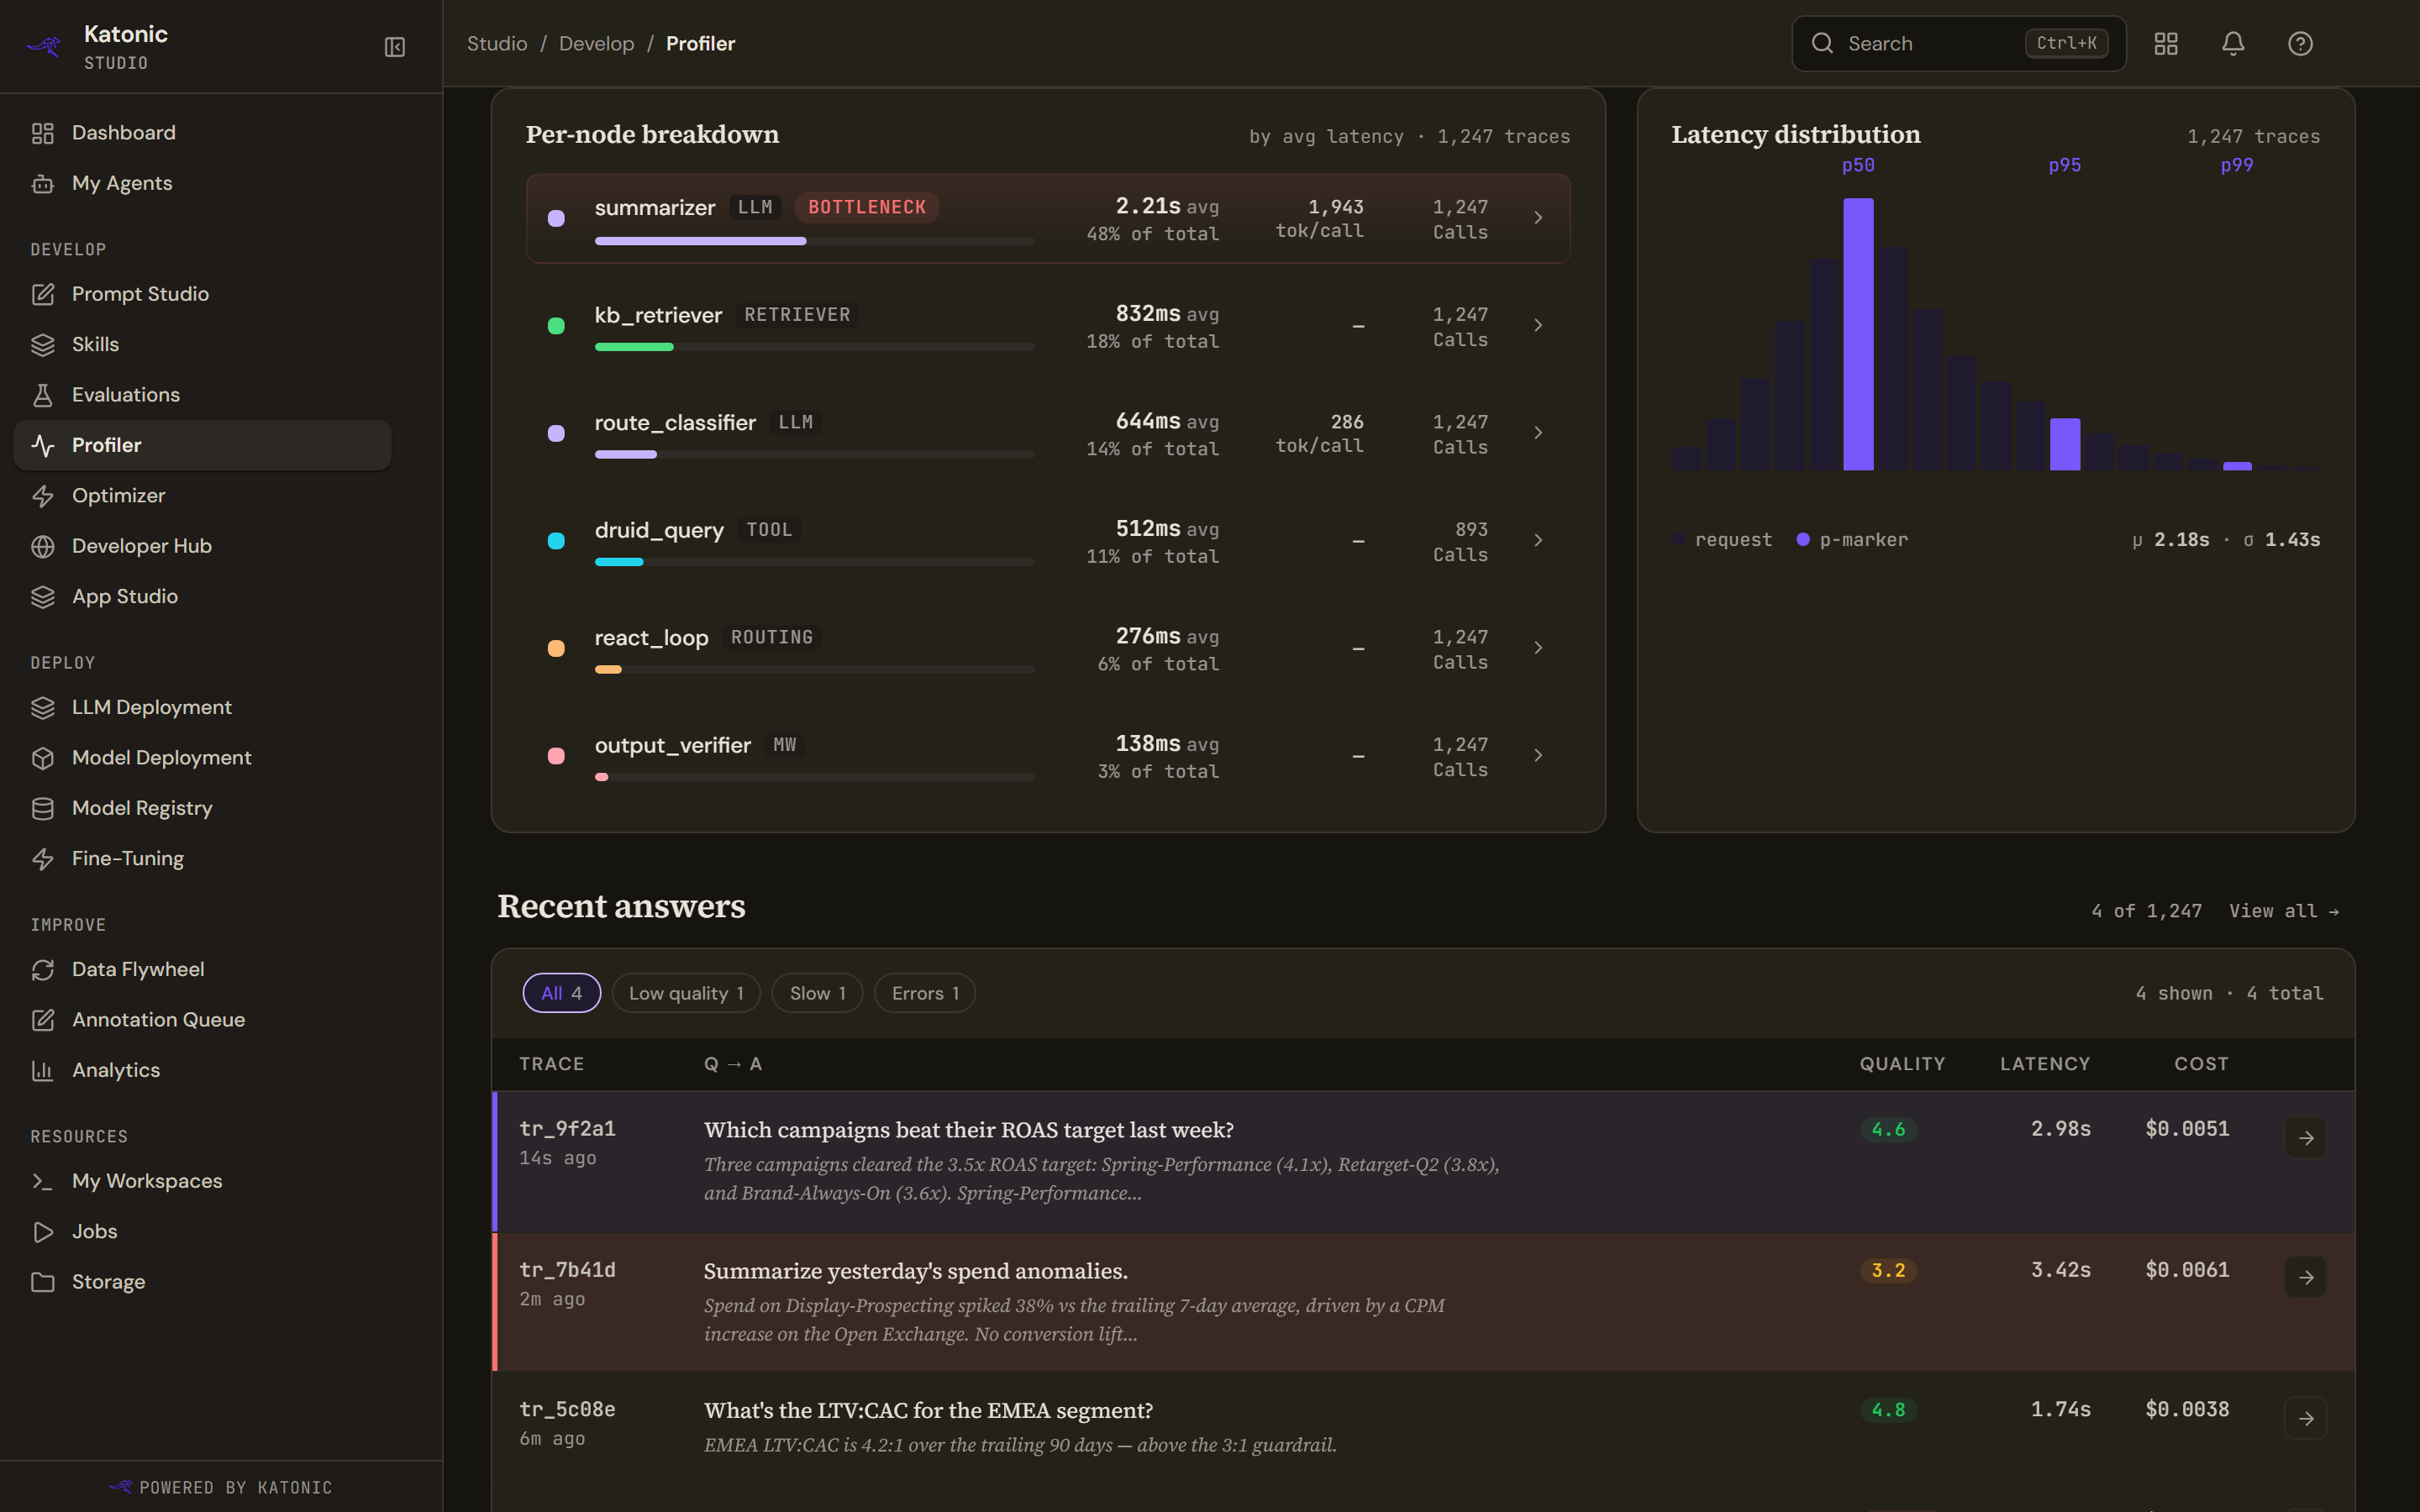
Each row names the node, its kind, a bar, the average latency or the spend, the share of the total, the tokens per call and the number of calls, and marks the bottleneck and any node with errors. Selecting a row opens that node's page.
Latency distribution beside it buckets the window's traces with the p50, p95 and p99 markers, and gives the mean and standard deviation where the service supplies them.
Recent answers closes the page with the latest traces, the filters All, Low quality, Slow and Errors, and View all, which opens Traces.
Before the first trace
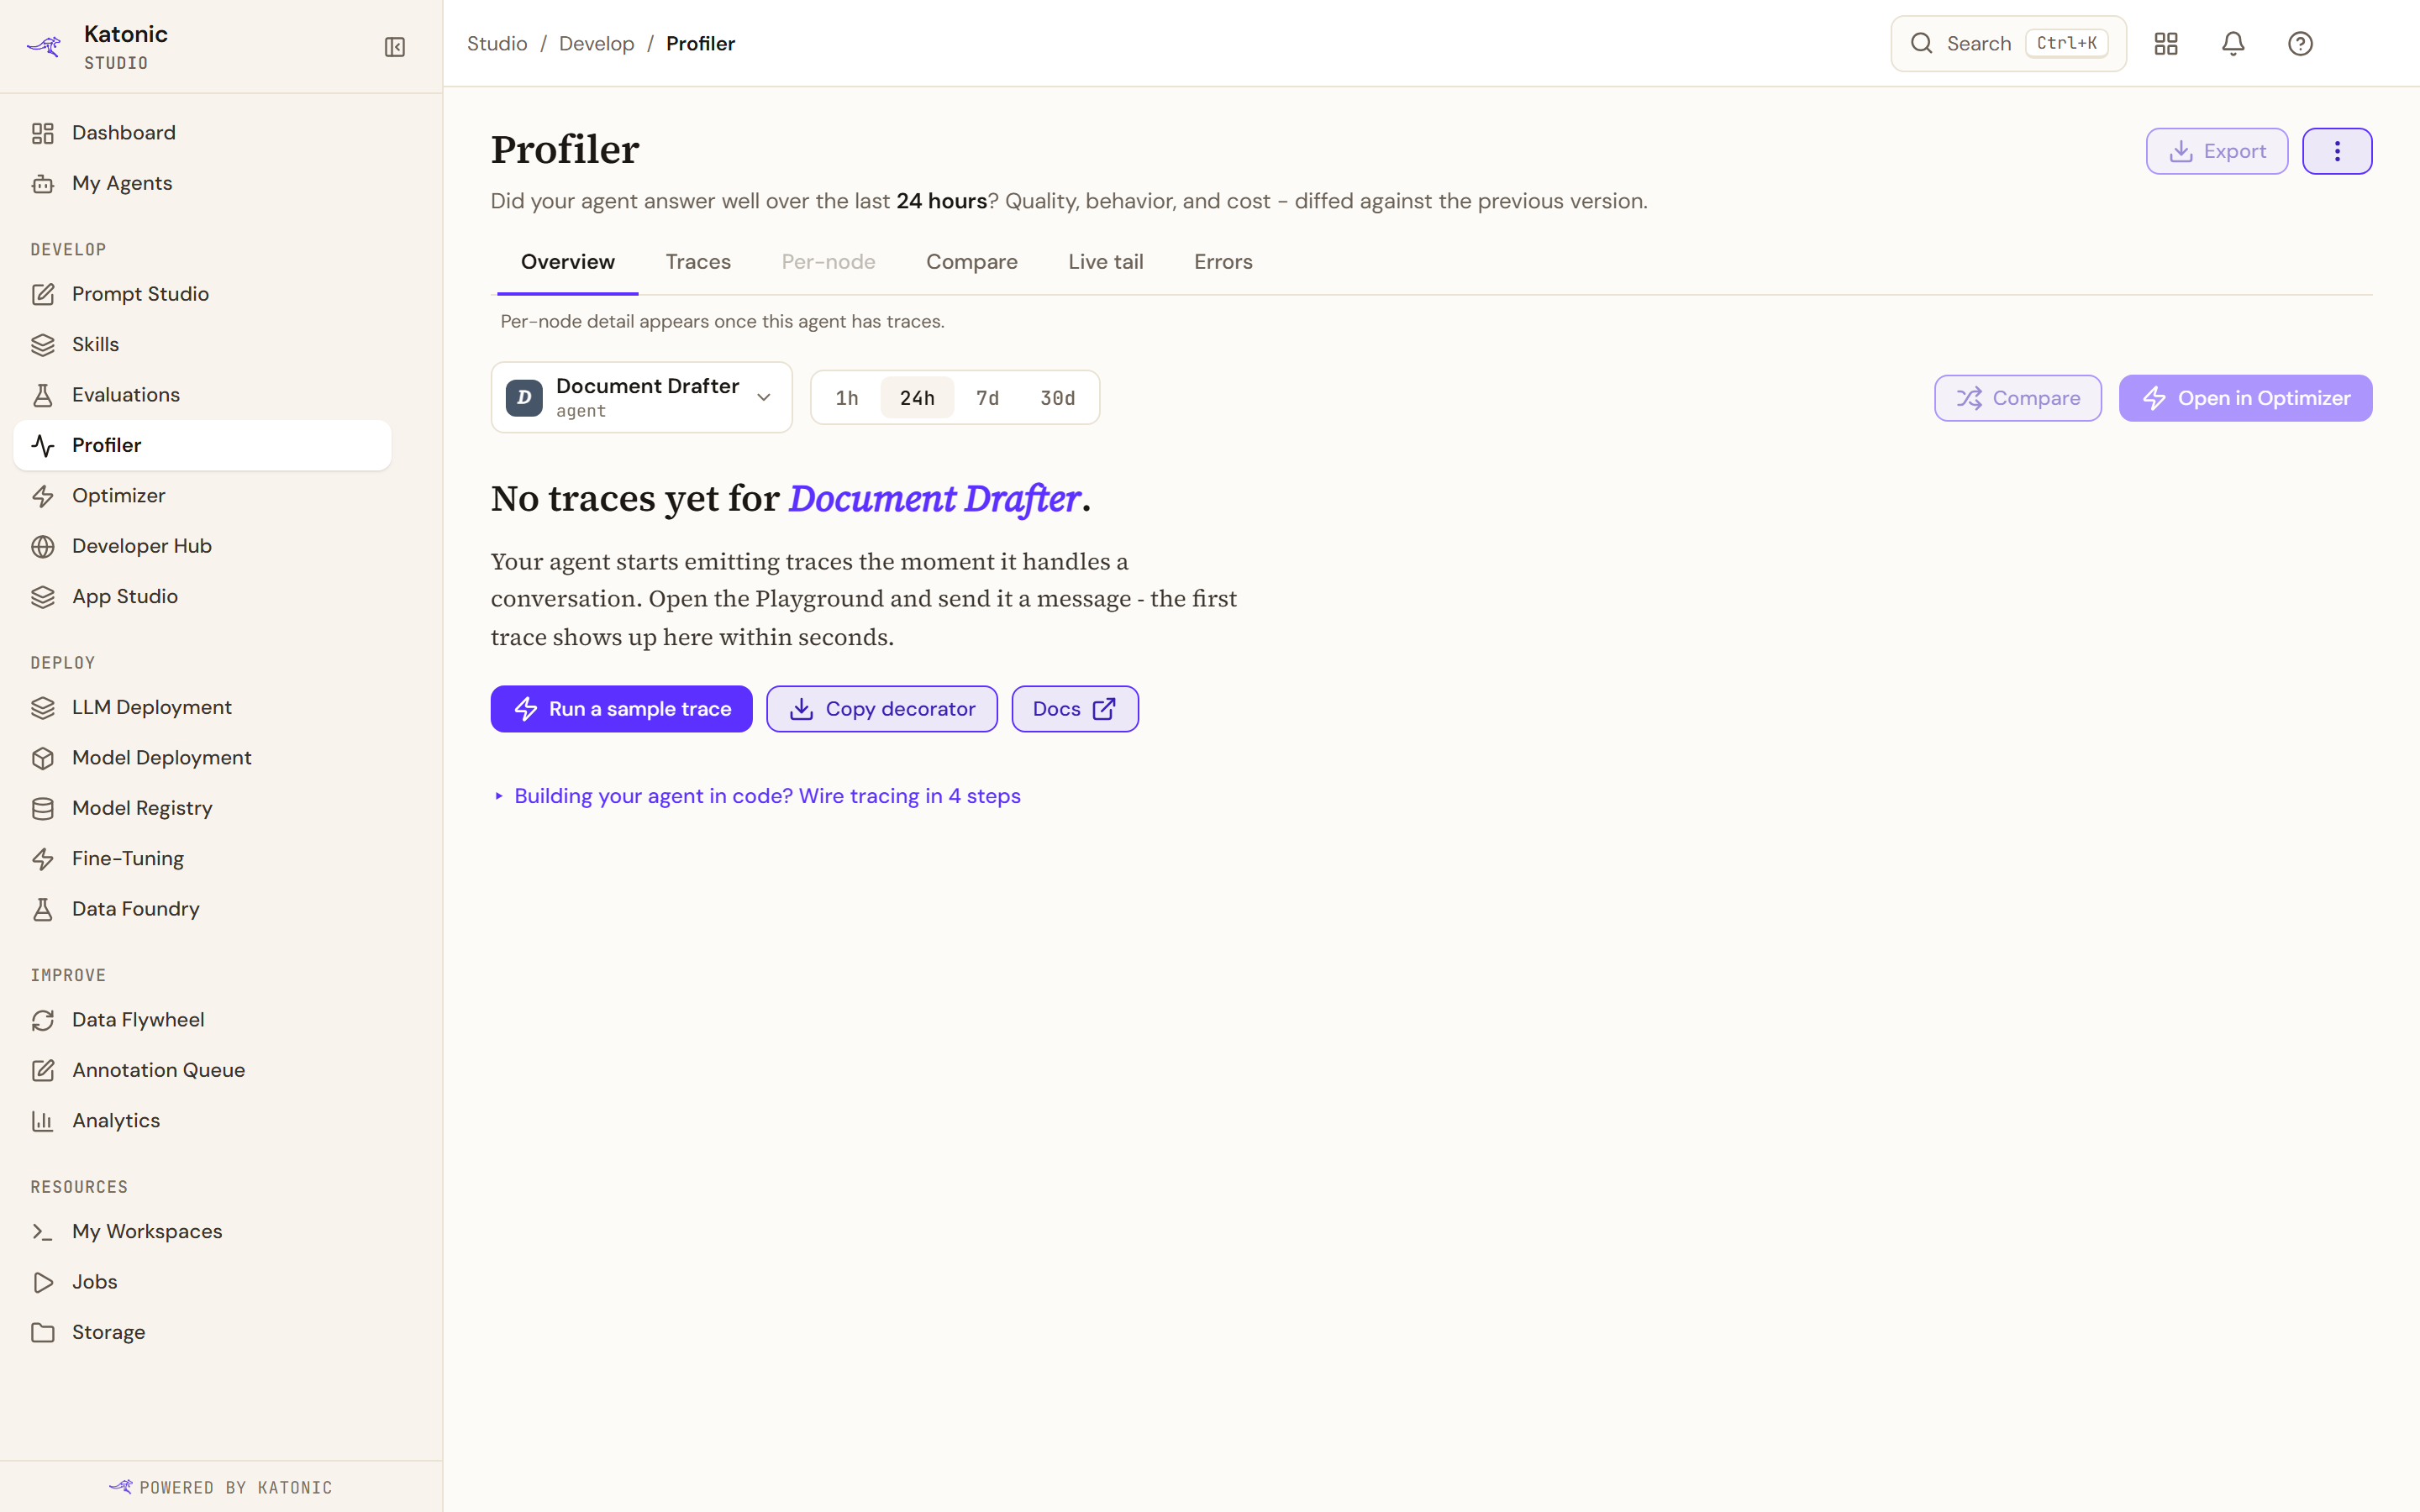
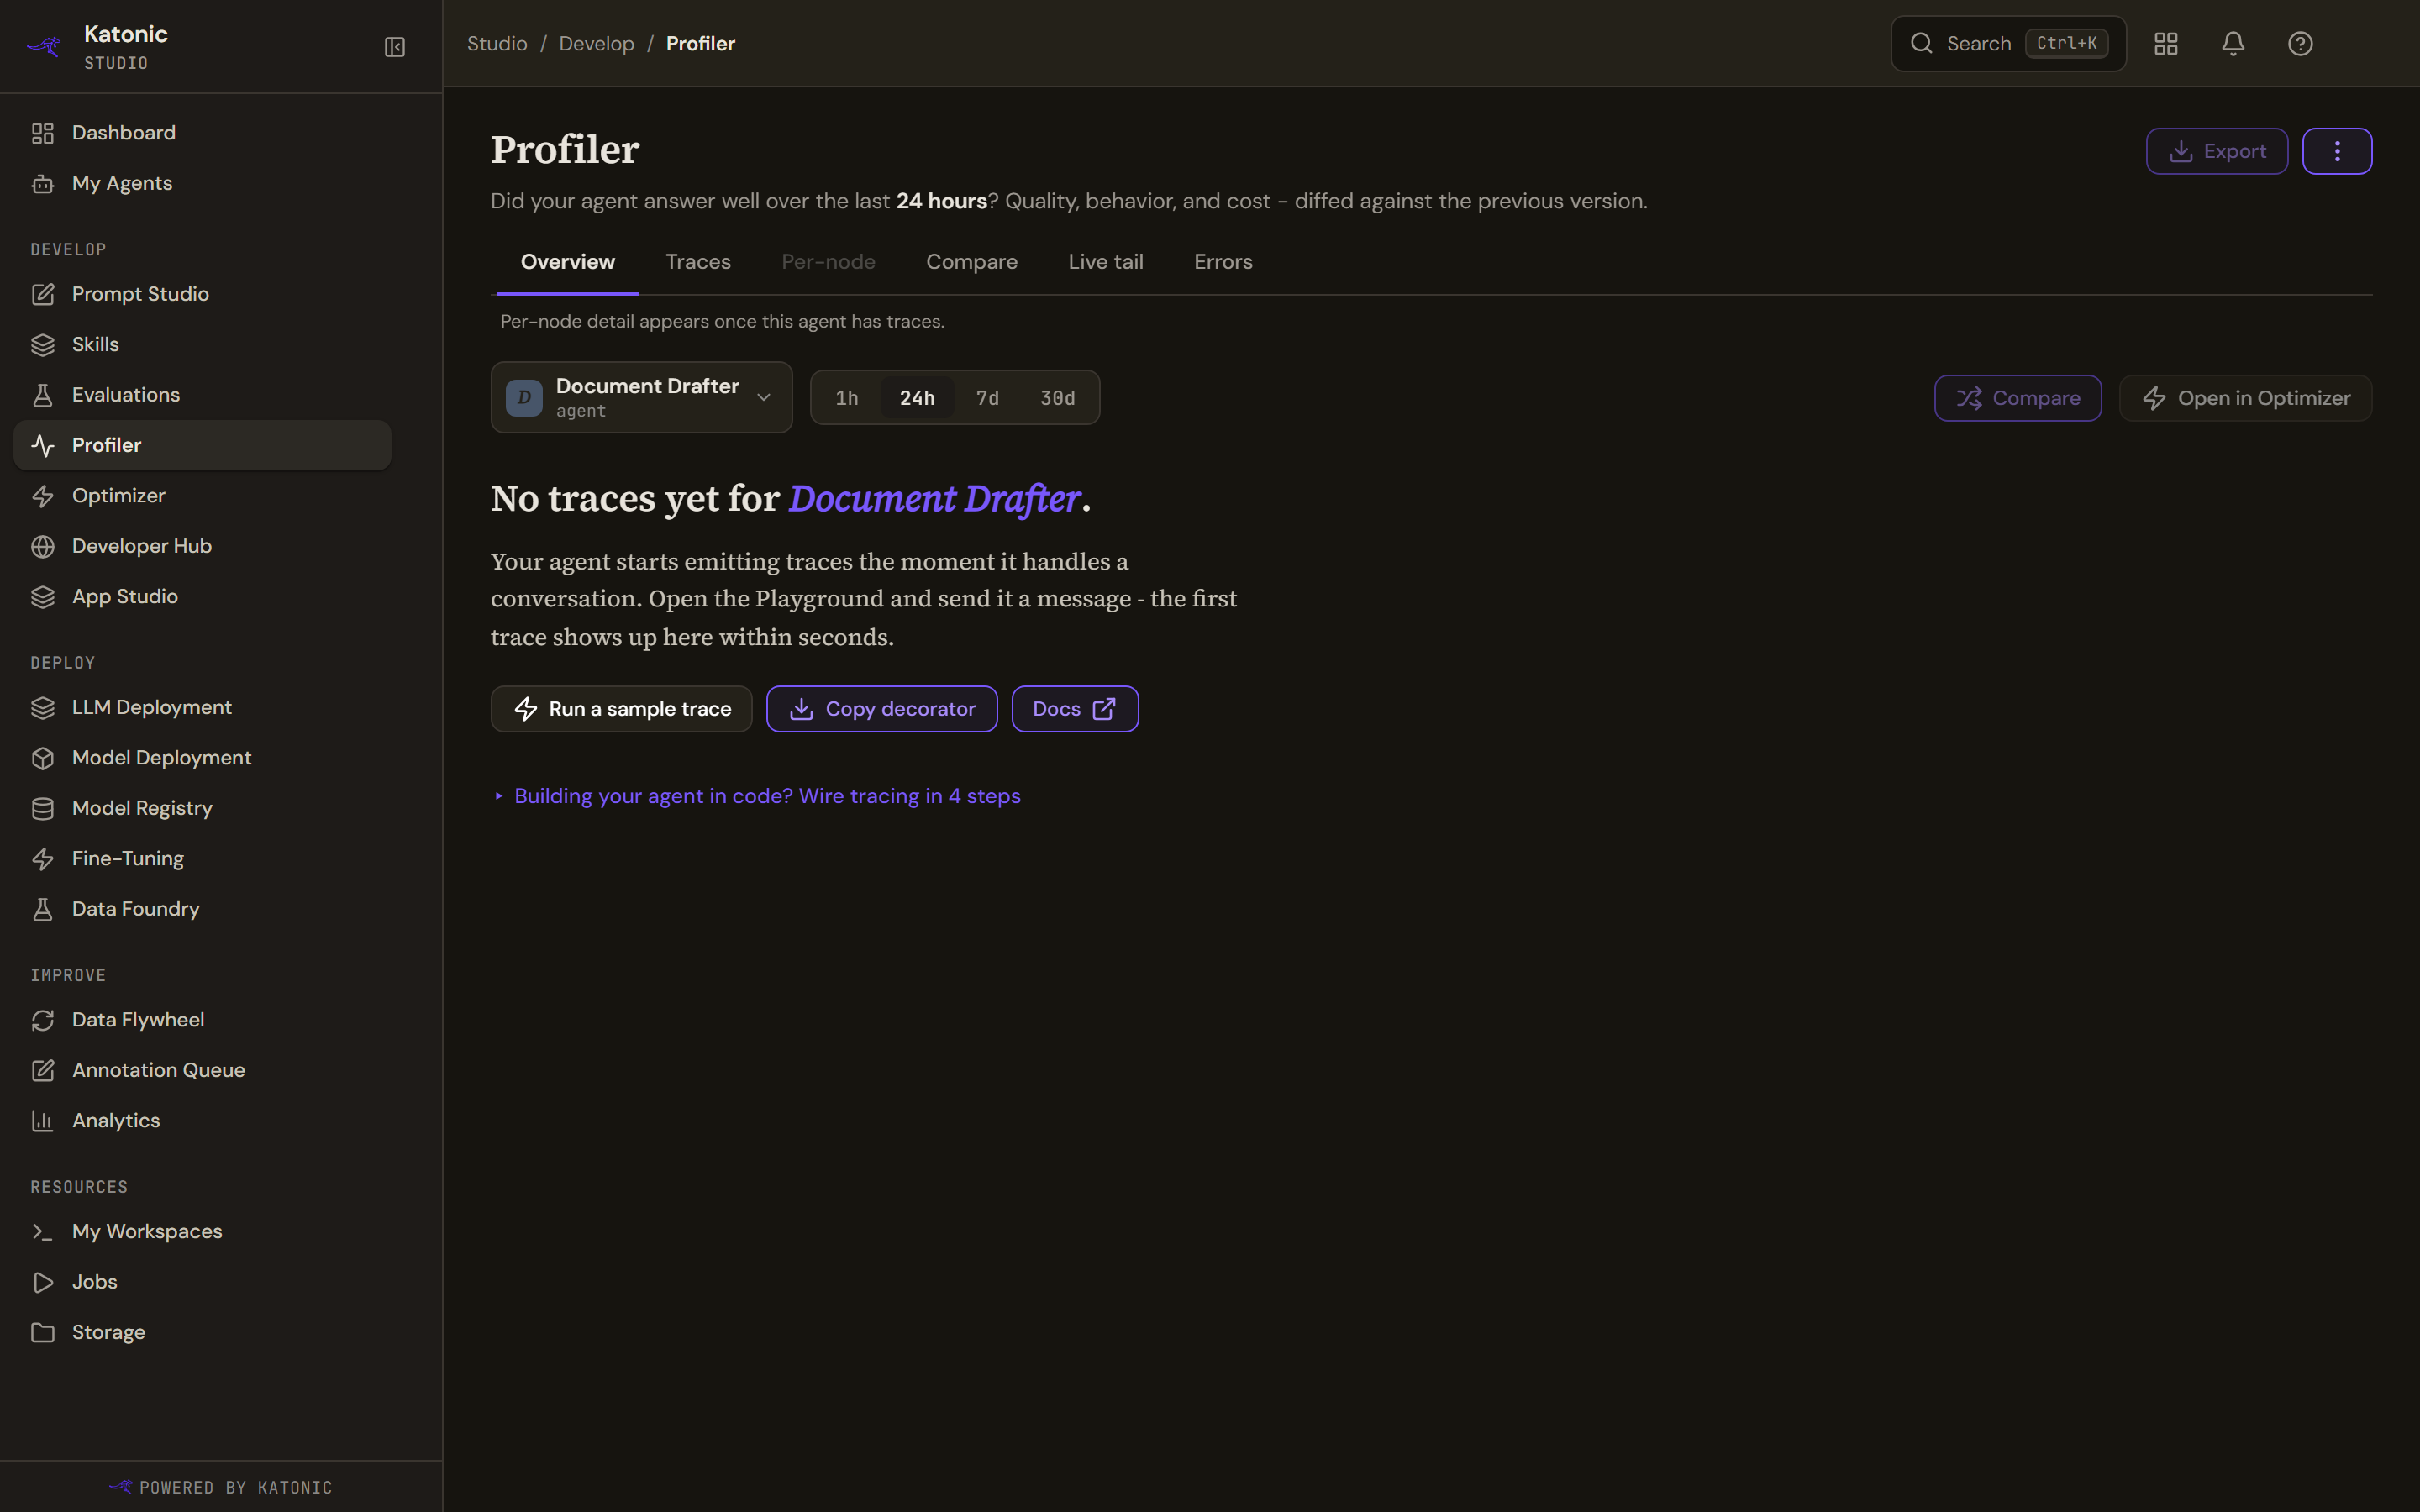
An agent that has never been traced gets a different page. It says no traces yet, explains that an agent starts emitting them the moment it handles a conversation, and offers three things: Run a sample trace, which opens the agent so you can send it a message, Copy decorator, which copies a working code snippet, and Docs.
Below that, Building your agent in code? Wire tracing in 4 steps expands into installing the SDK, sending a real turn through it, sending the first trace, and setting an optional latency SLO, with a quickstart snippet you can copy.
If no agent in the tenant has been published at all, the page says so instead and points at My agents.
Troubleshooting
- Couldn't load profiler data. The observability service returned an error. The message says this is a service error and not an absence of traces, and Retry repeats the request.
- The score is a mean over very few traces. The evaluated count sits beside it. Run more conversations, or widen the window.
- Export is dimmed. The window has no traces to export.