Read one trace in full
Agents
A trace page is one answer, taken apart. It opens from a row in Traces, from a sample trace in Issues, or from the worst-answers table on a node's page.
Who can use it: the Builder role or higher, in a tenant licensed for agents.
The answer and the verdict
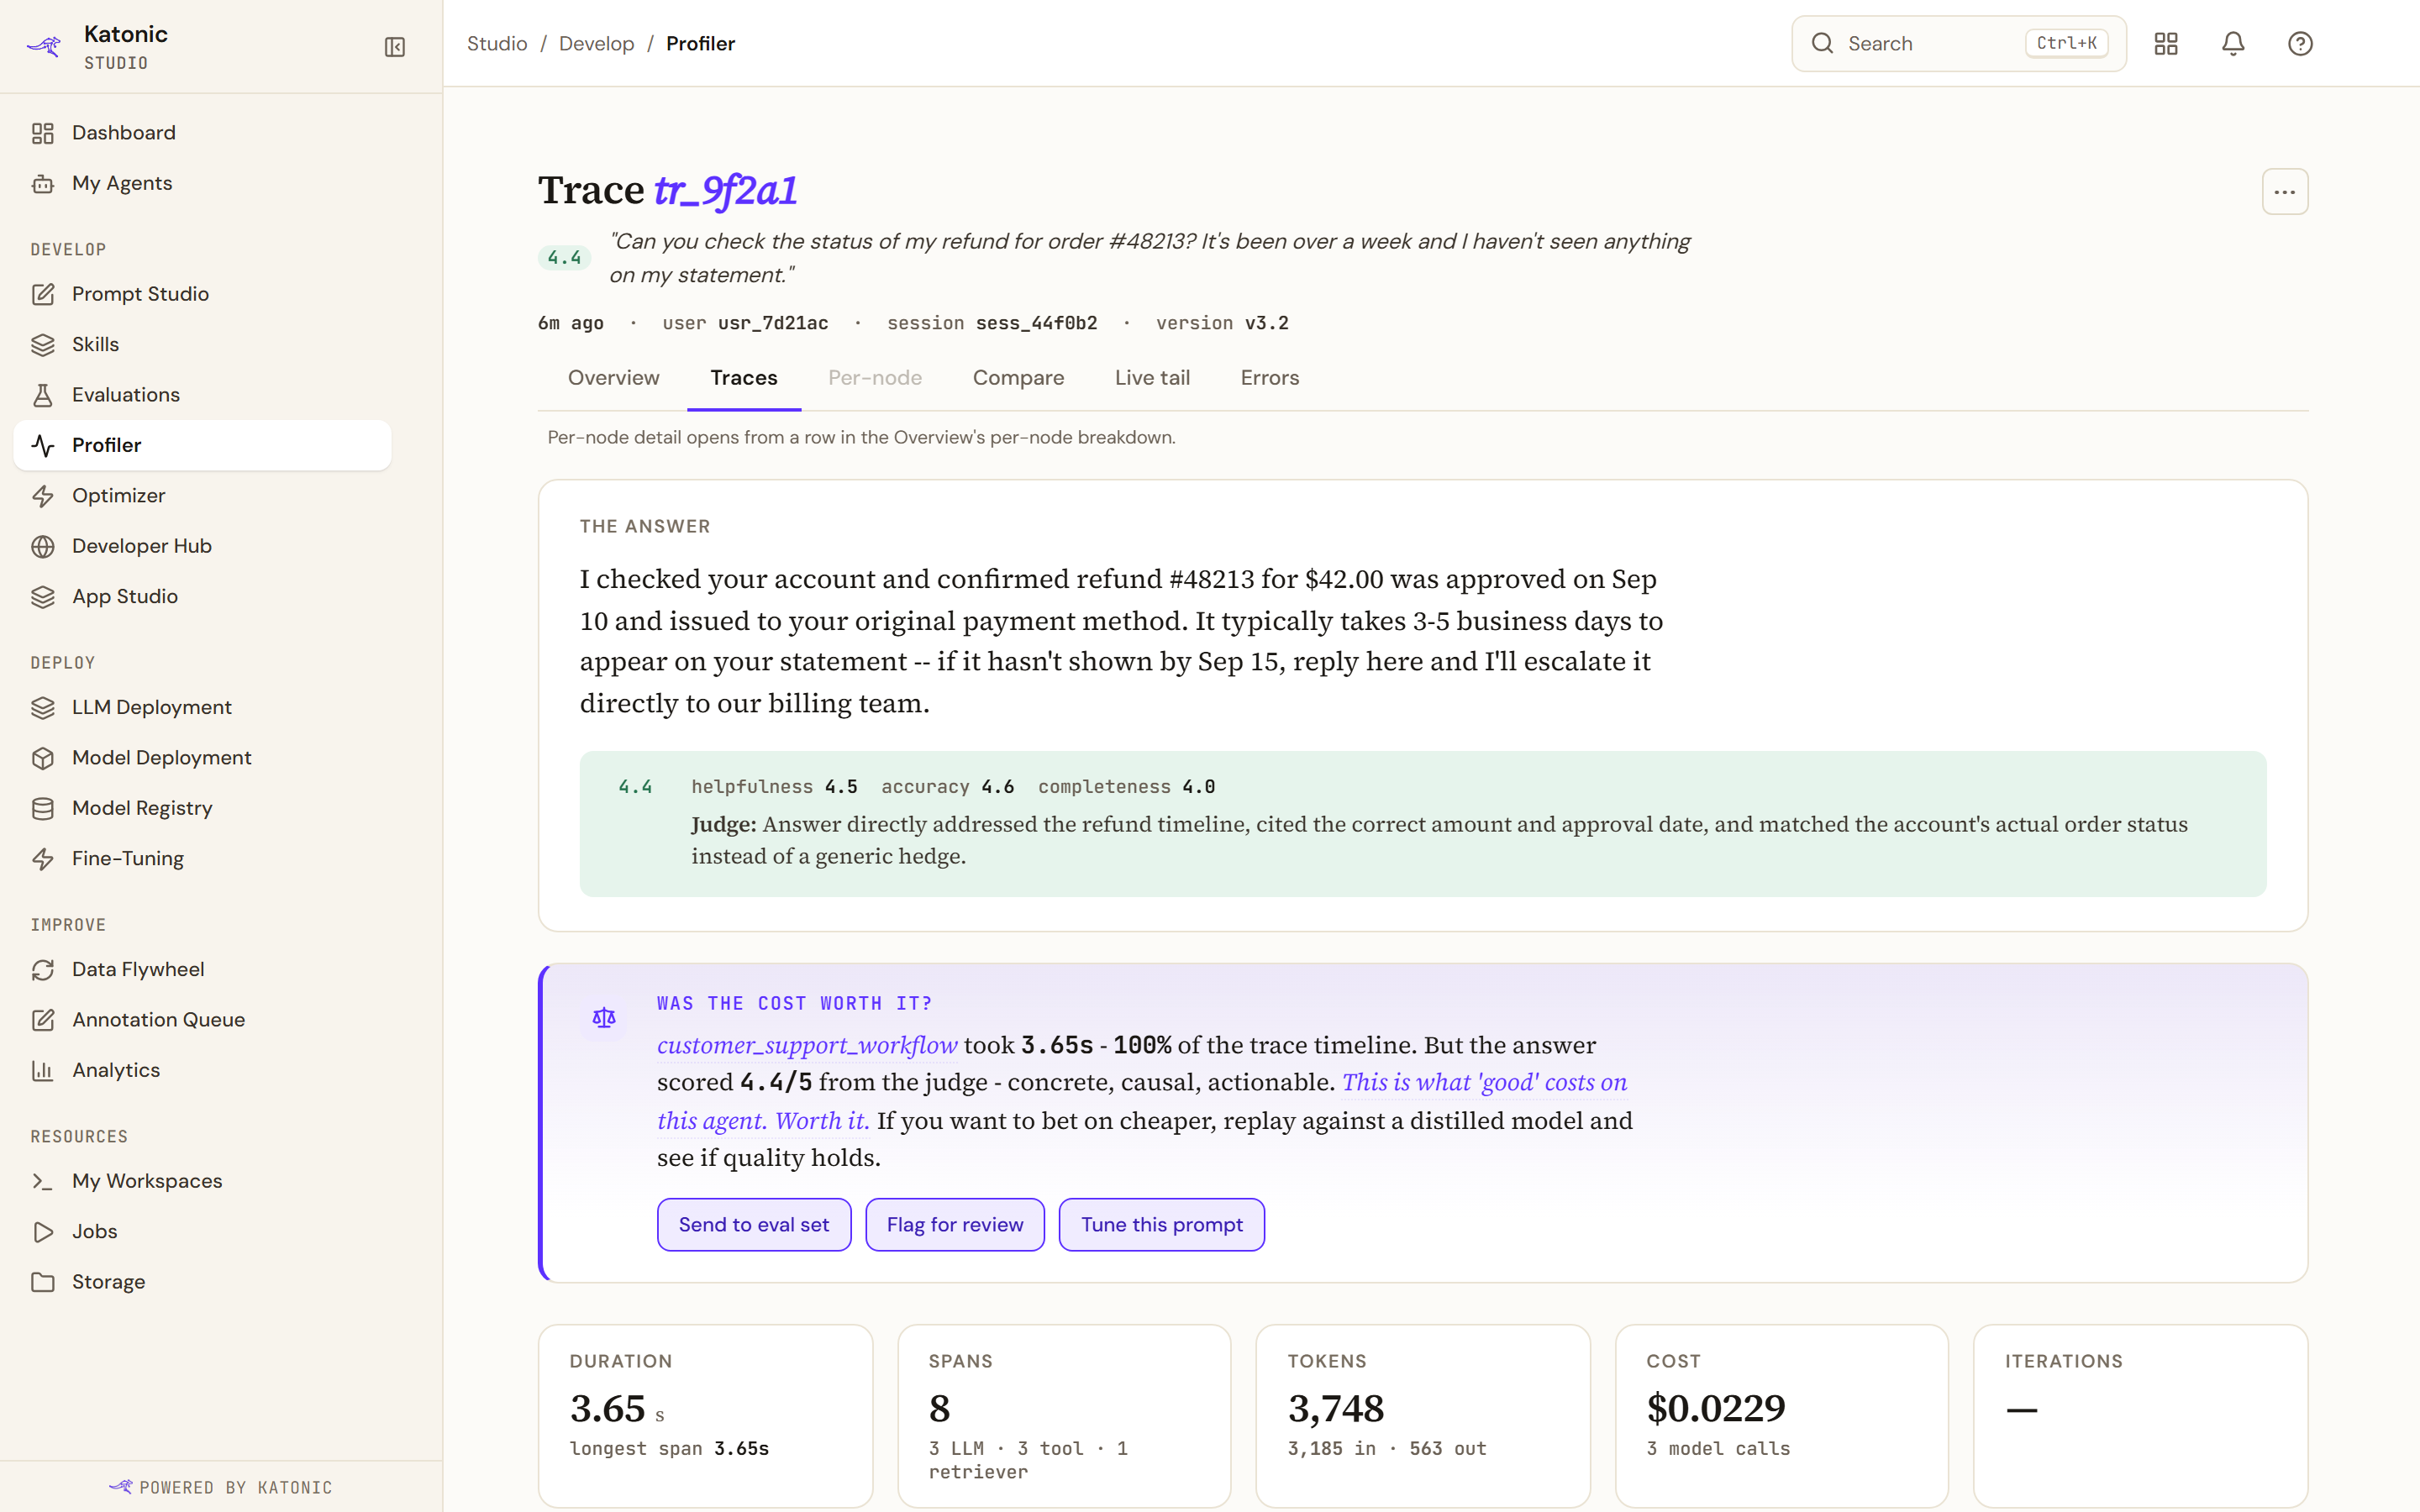
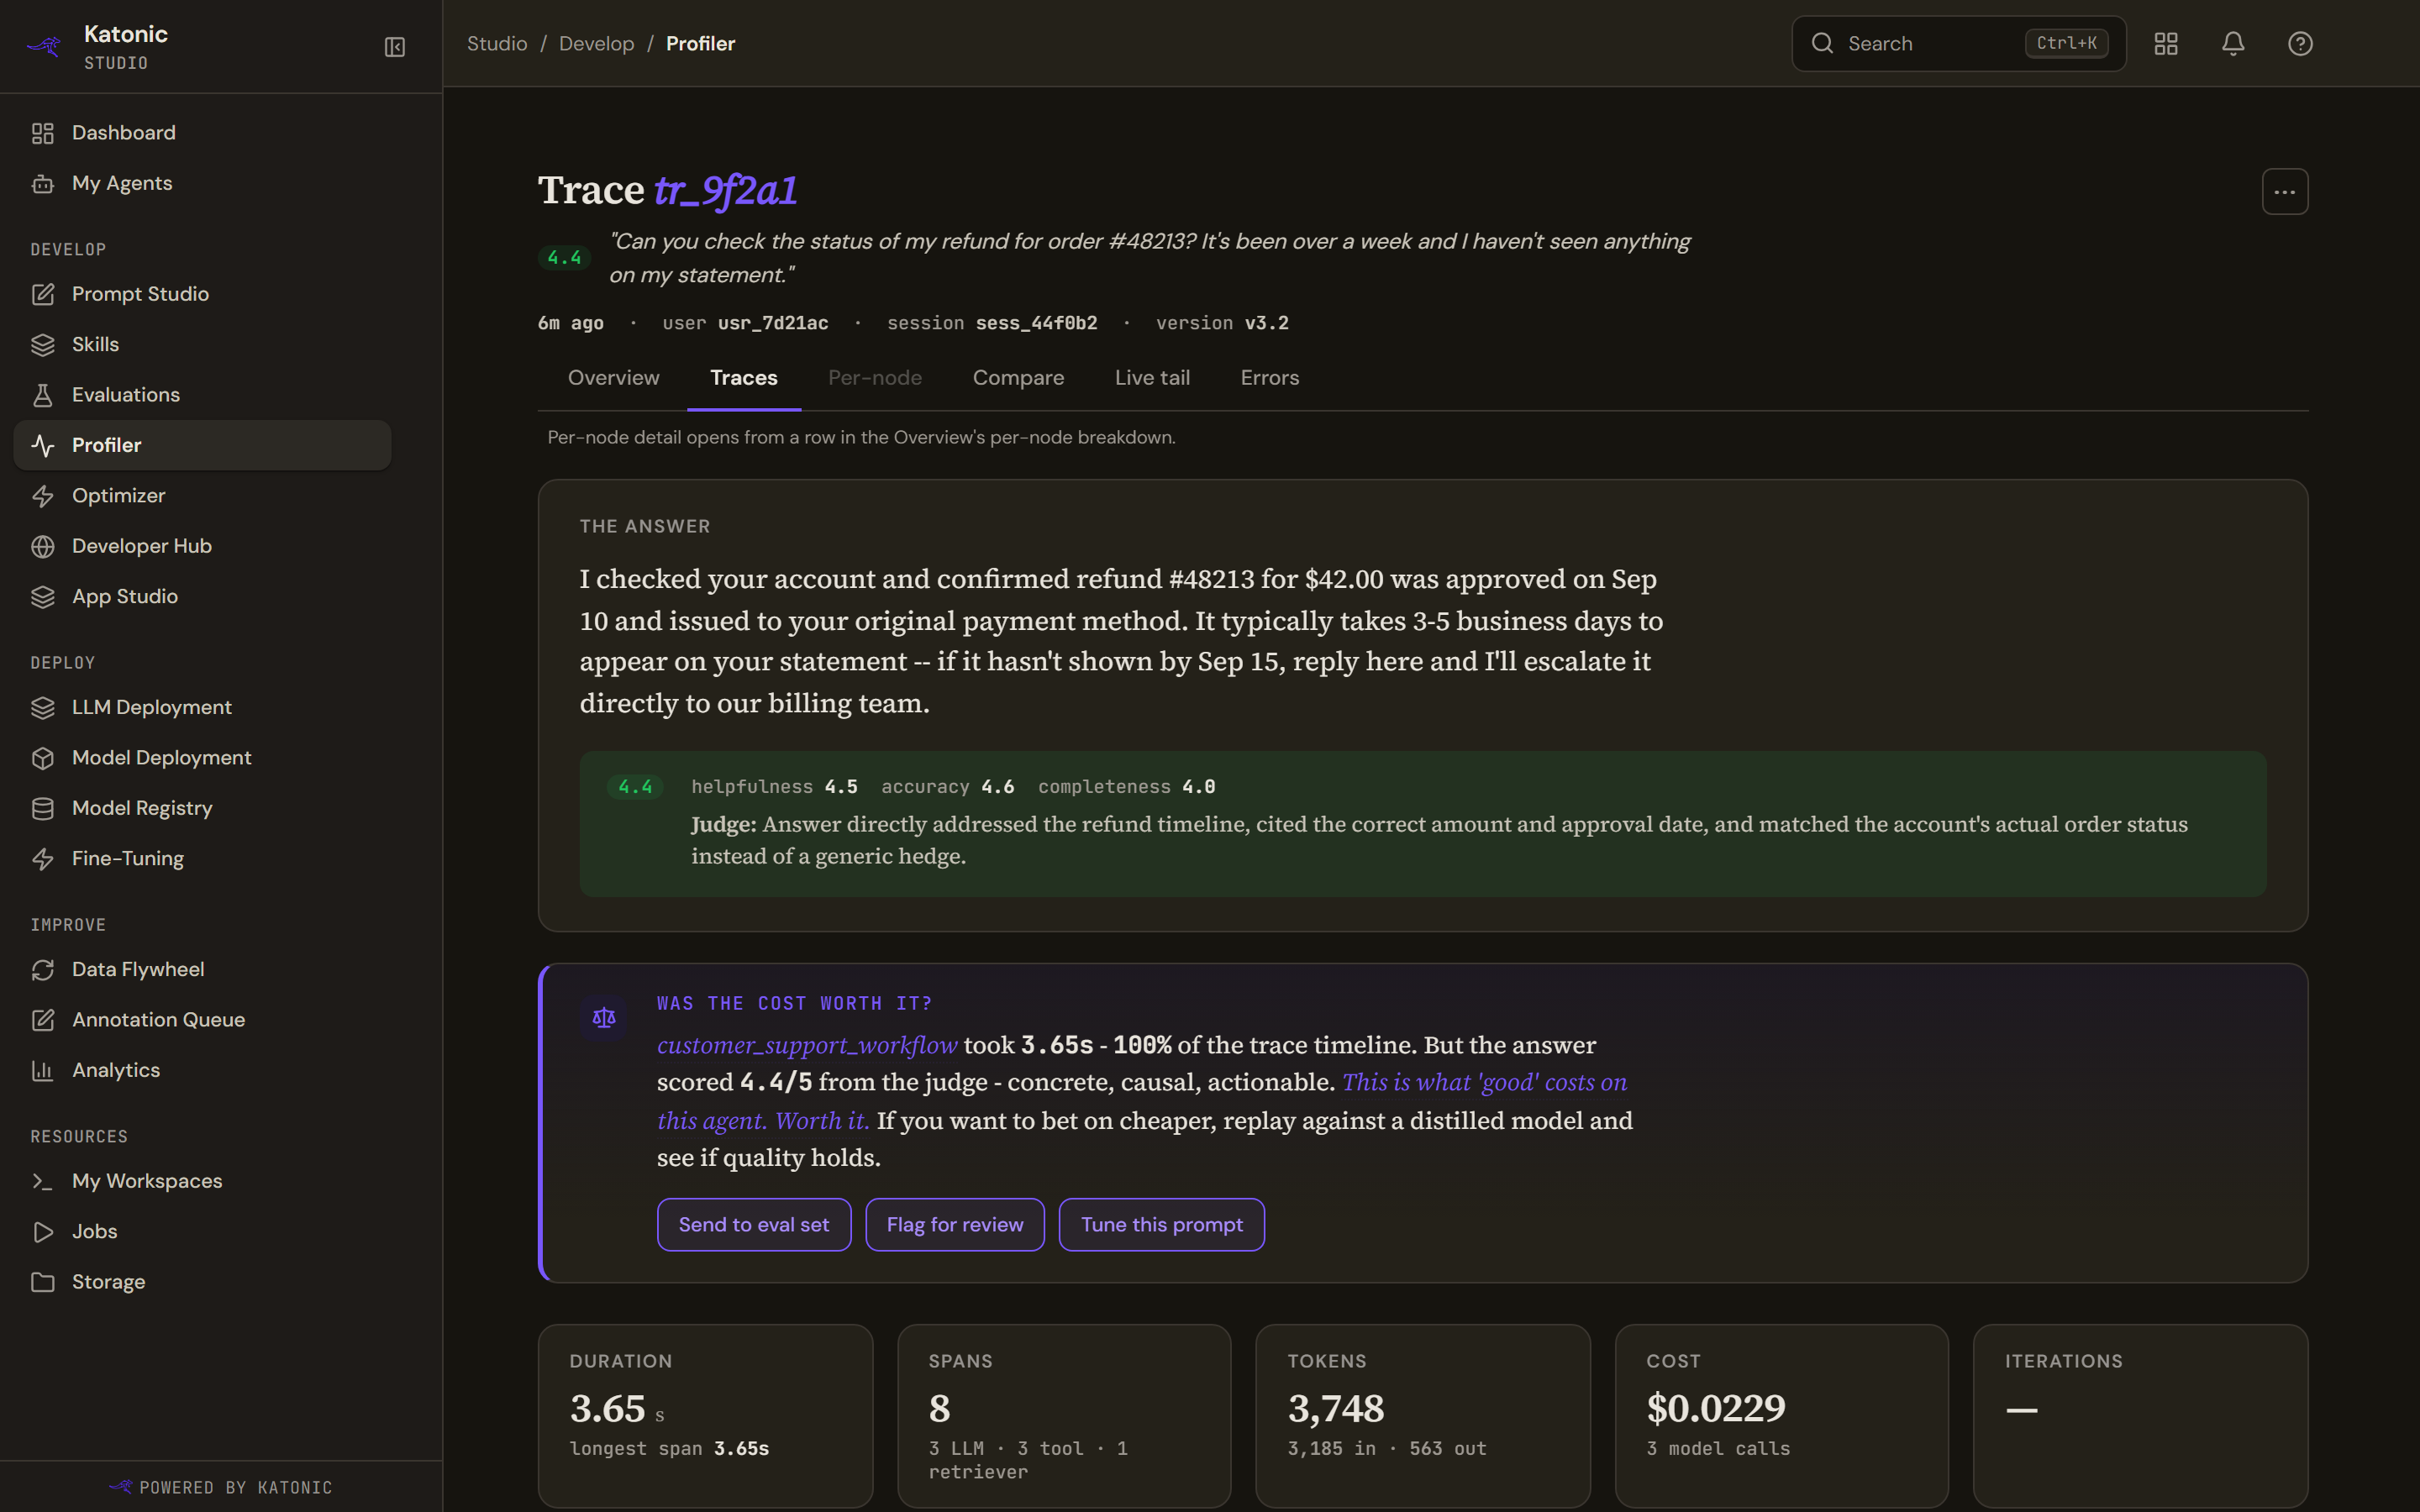
The header carries the short trace id, the judge's badge and the question, then when it ran, who asked, the session and the agent version. The overflow menu offers exactly two things, Share, which copies a link, and Download JSON, the full payload. There is no replay control: nothing earns a place in that menu until replay is real, so it is absent rather than dimmed.
The answer is the text the agent actually returned, with the judge's per-dimension scores and its reasoning beneath. A trace that errored before producing output says so instead.
Was the cost worth it? is the verdict card. It names the span that dominated the trace and the share of the timeline it took, then says one of three things: the answer scored well and this is what good costs on this agent; the answer scored badly and you paid full cost for it, with a pointer to the judge's reasoning; or the judge has not reached this trace, so there is no quality verdict to weigh the cost against. Tune this prompt opens the Optimizer for the agent, carrying the agent and this trace.
Five figures follow: Duration, turning red when it exceeds the latency SLO, with the longest span named; Spans, counting the steps in the trace; Tokens, in and out; Cost, with the number of model calls; and Iterations of the agent loop.
The waterfall
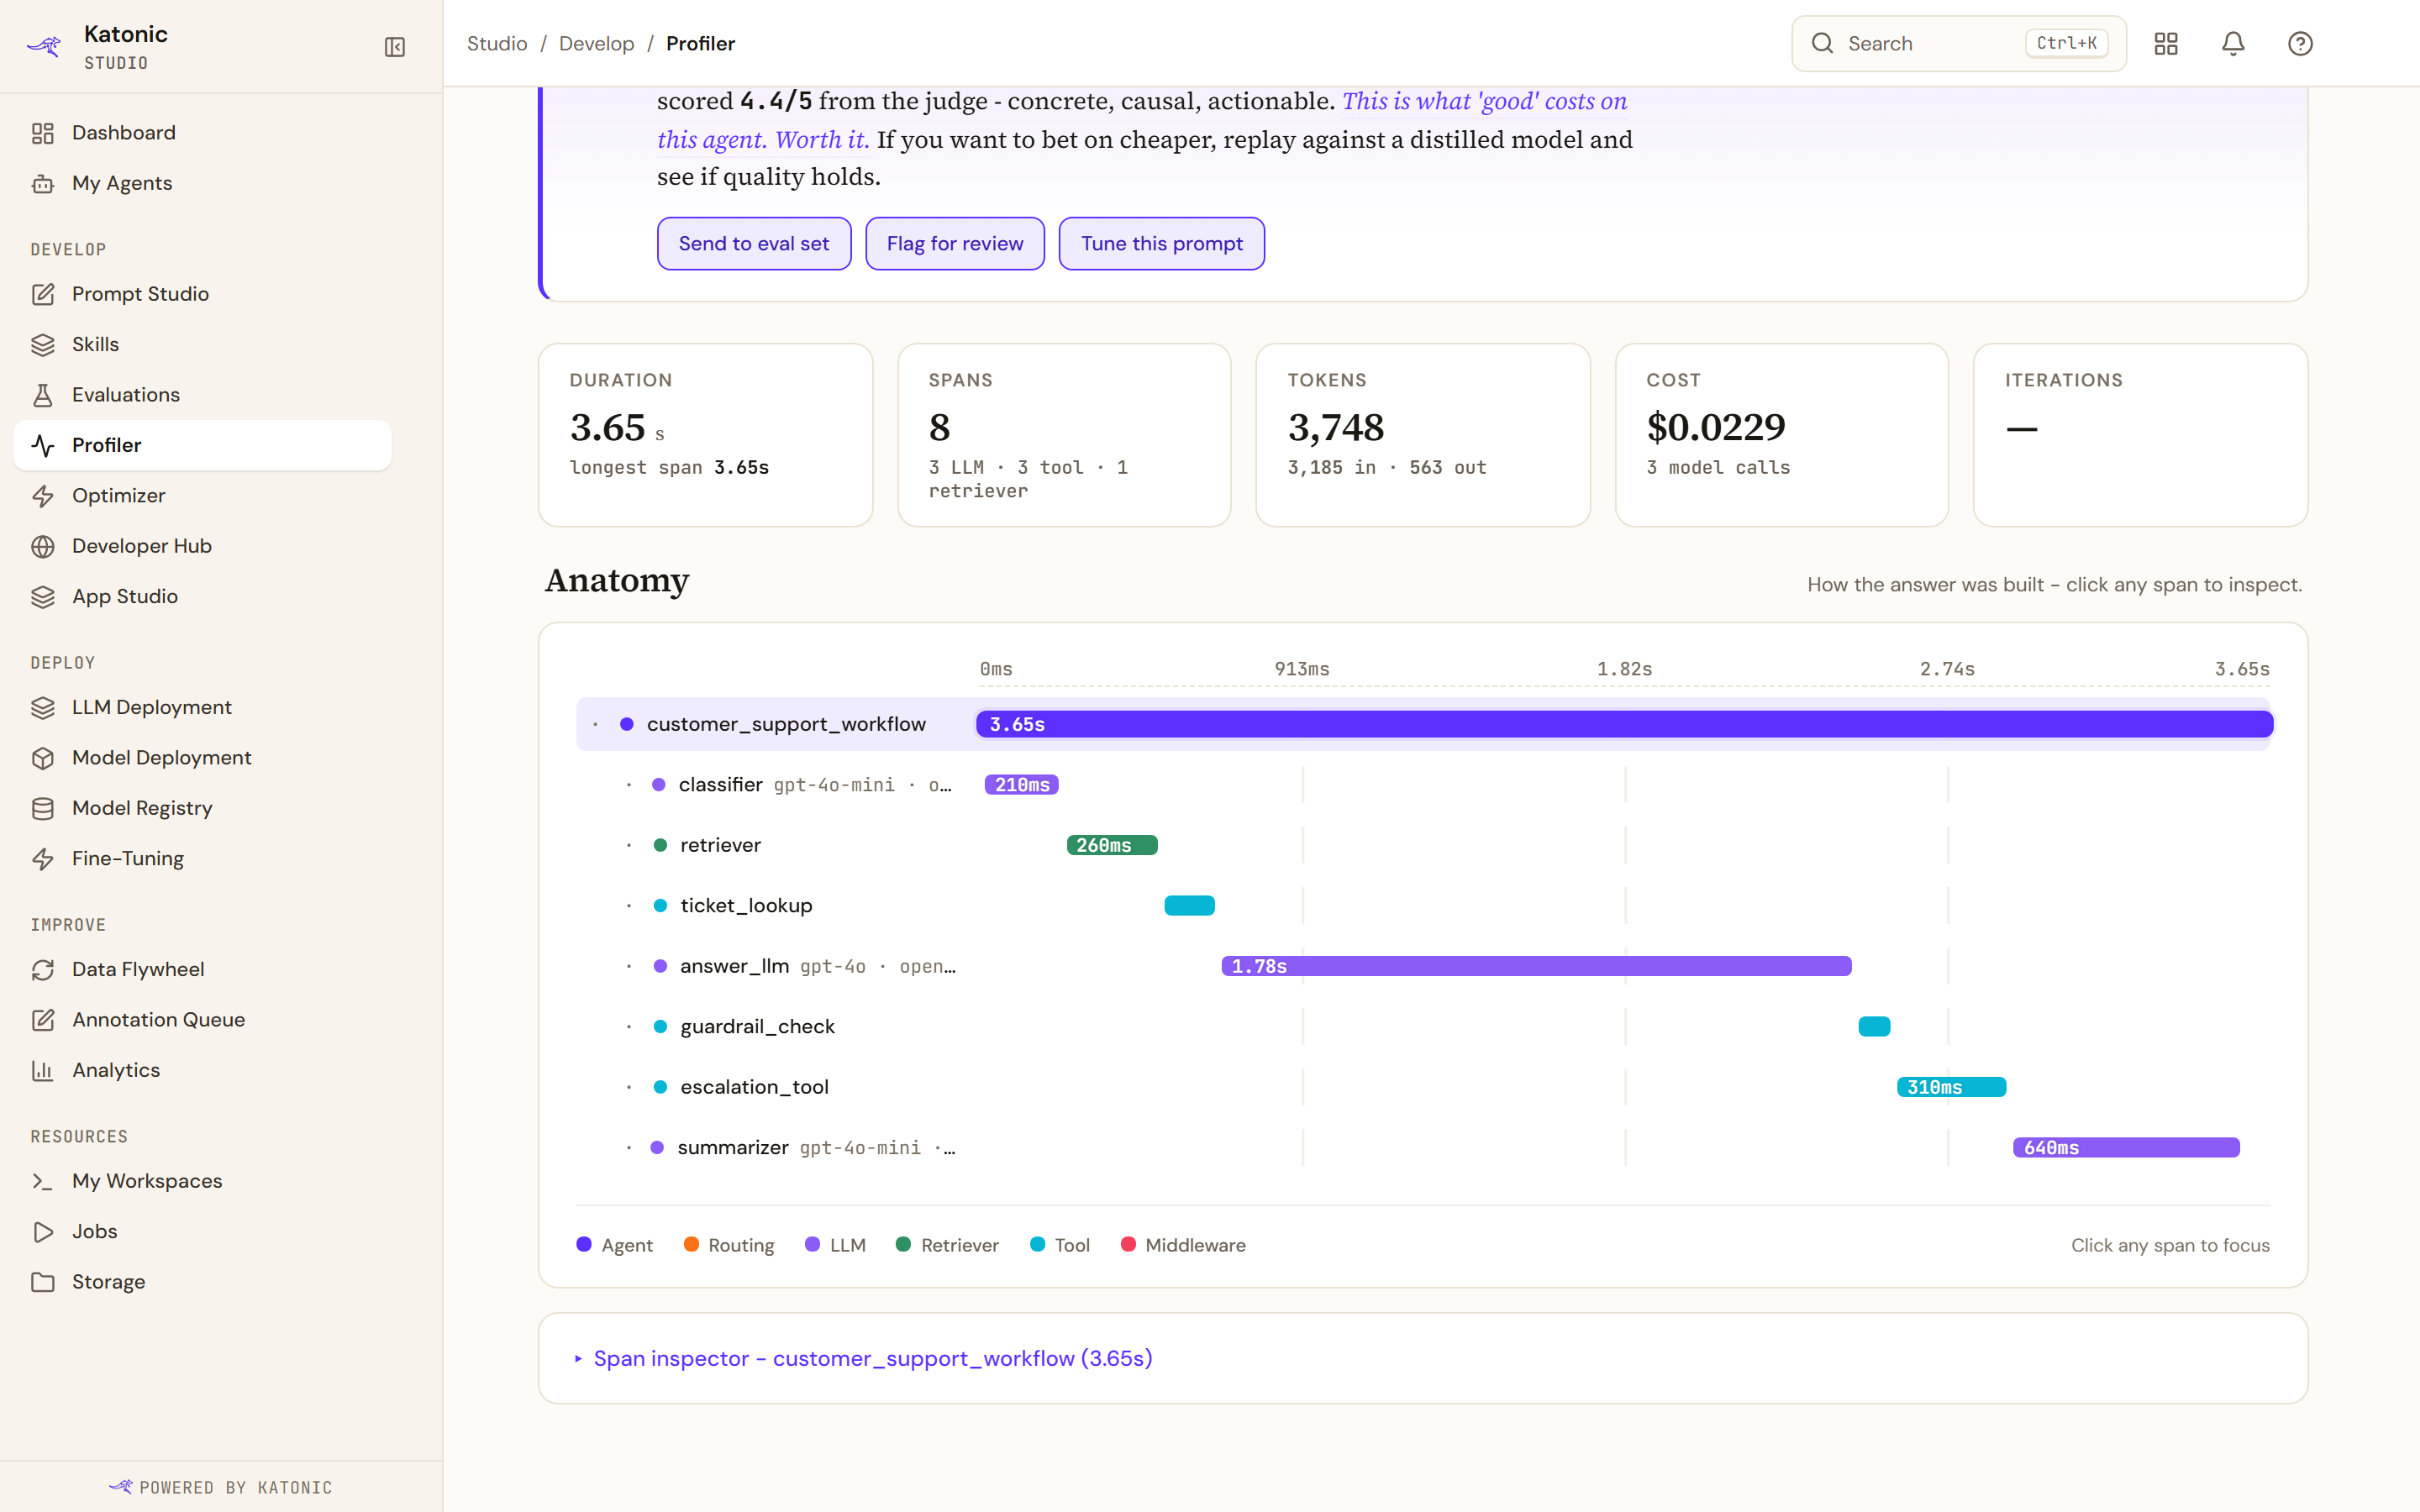
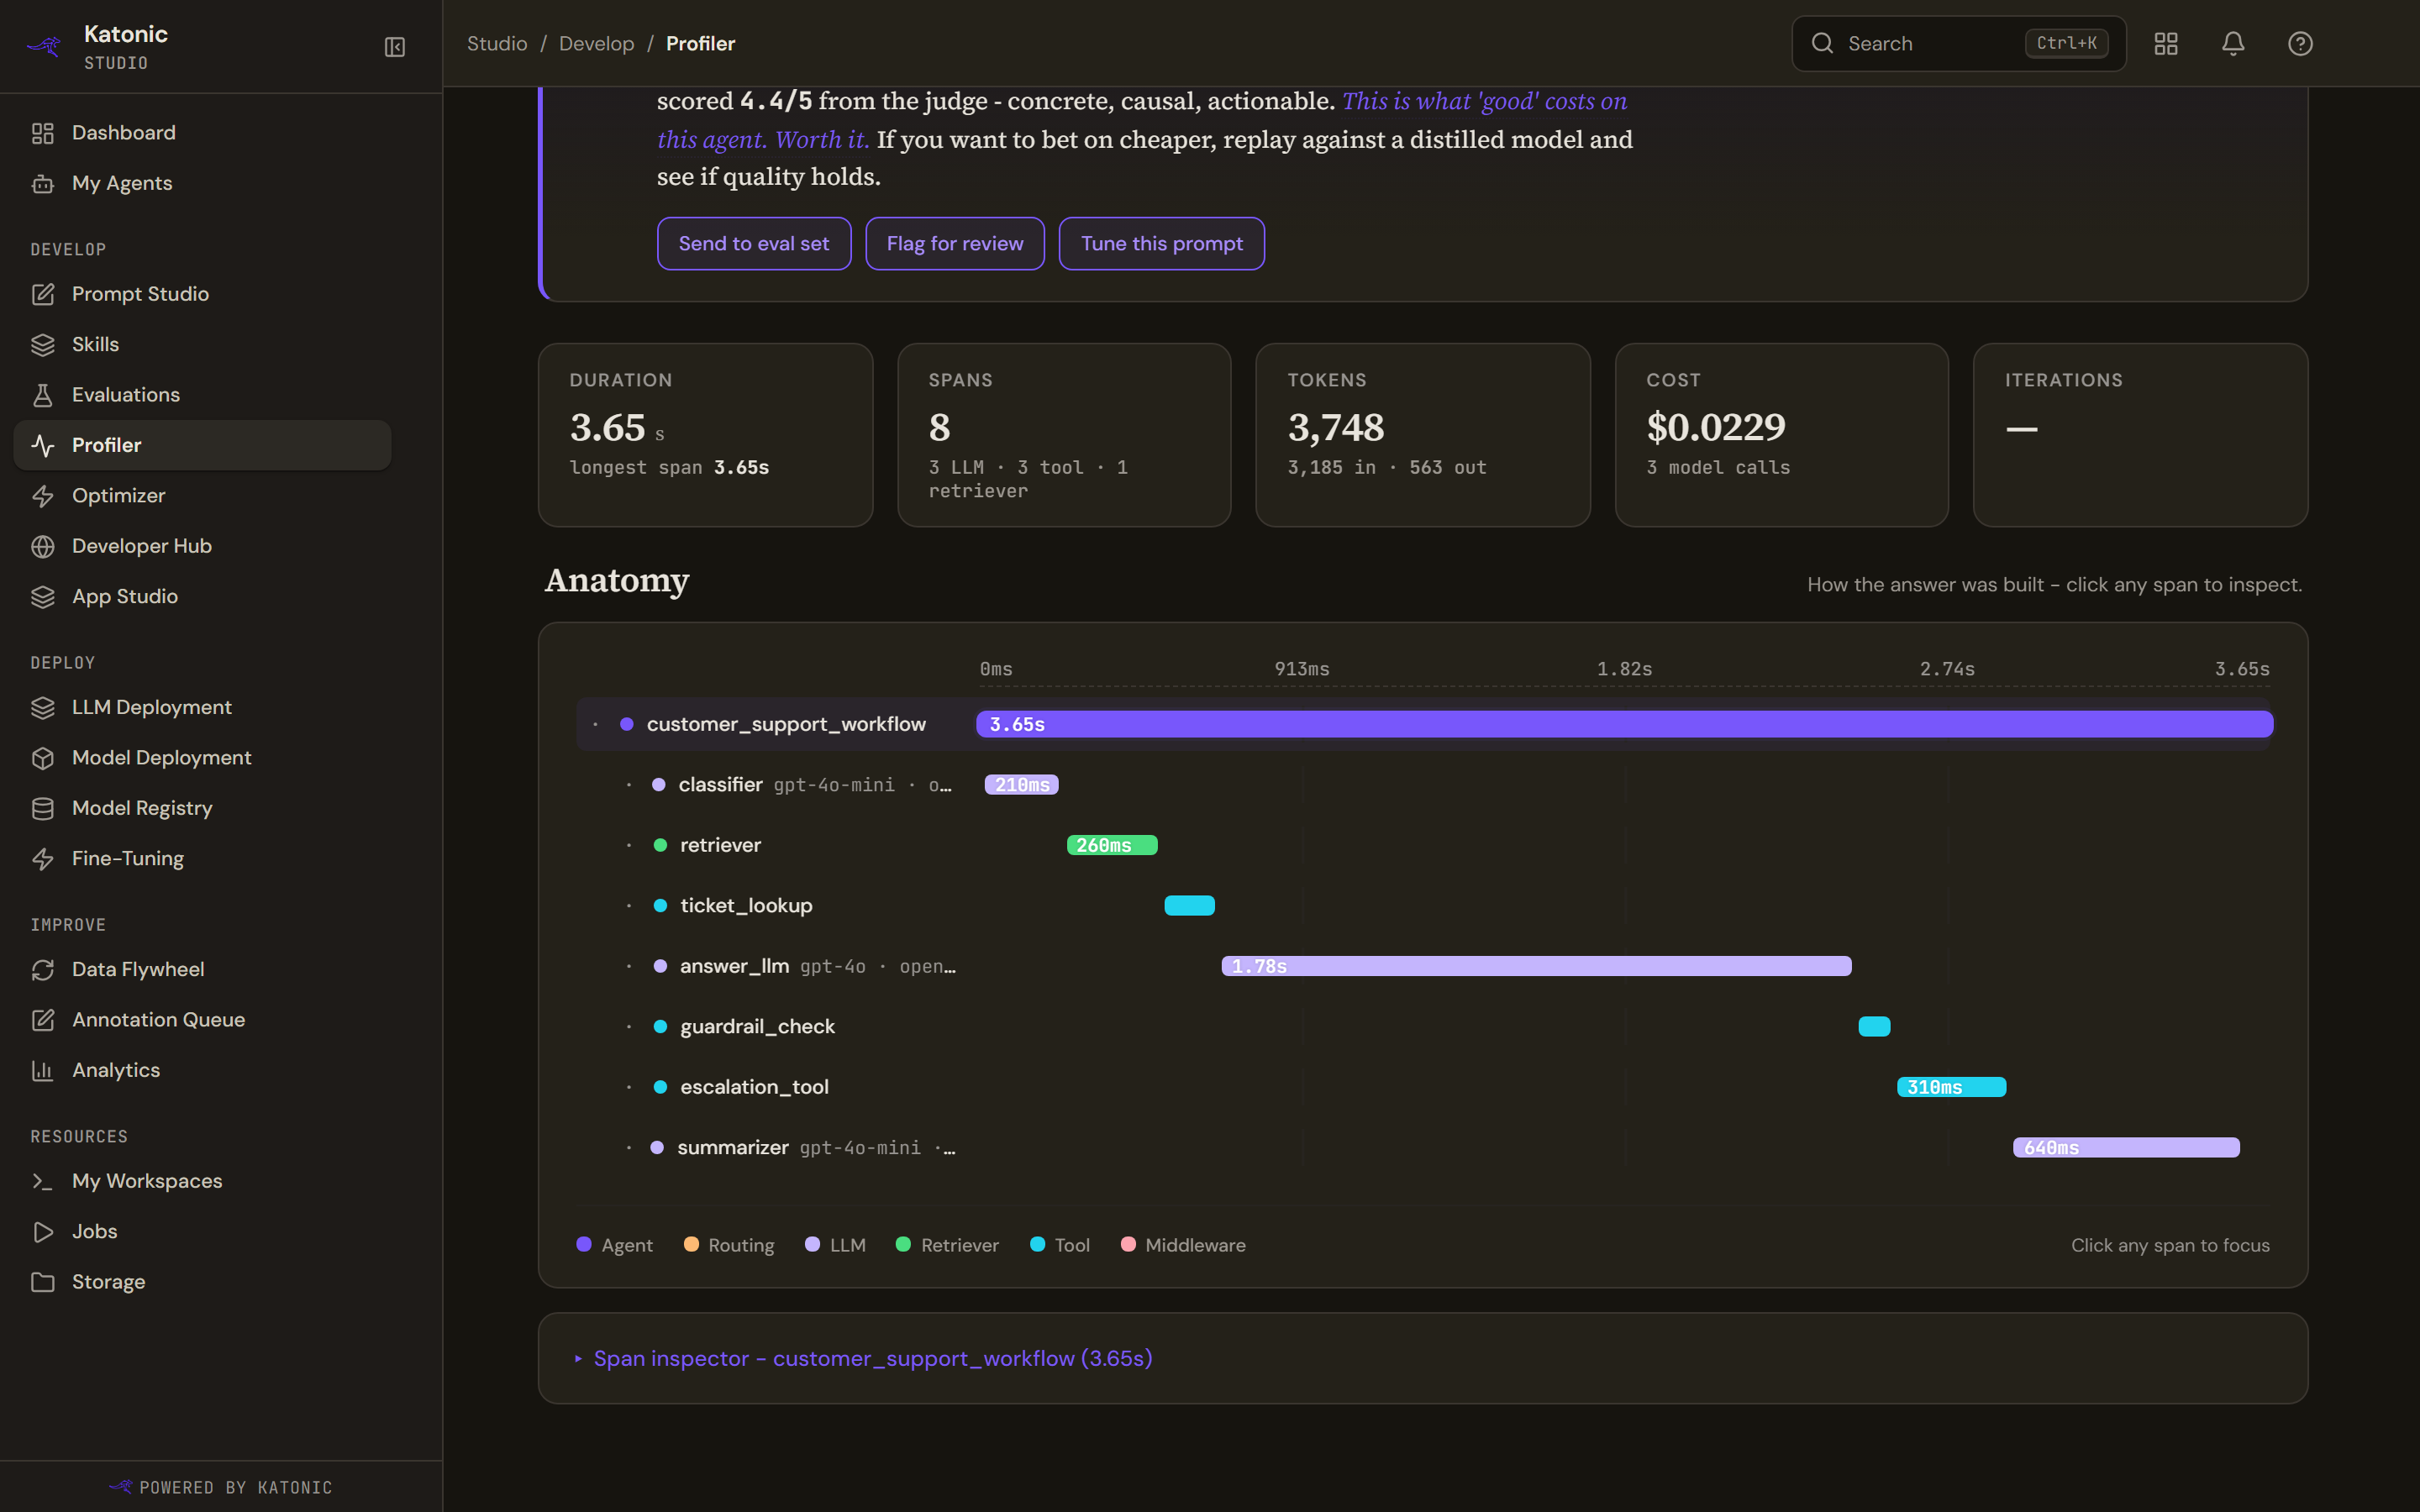
Anatomy is the waterfall: how the answer was built, span by span, against a time ruler scaled to the real duration. Each row gives the span's name and its duration, and the legend below names the kinds of step a trace can contain: agent, routing, model, retriever, tool and middleware.
One span
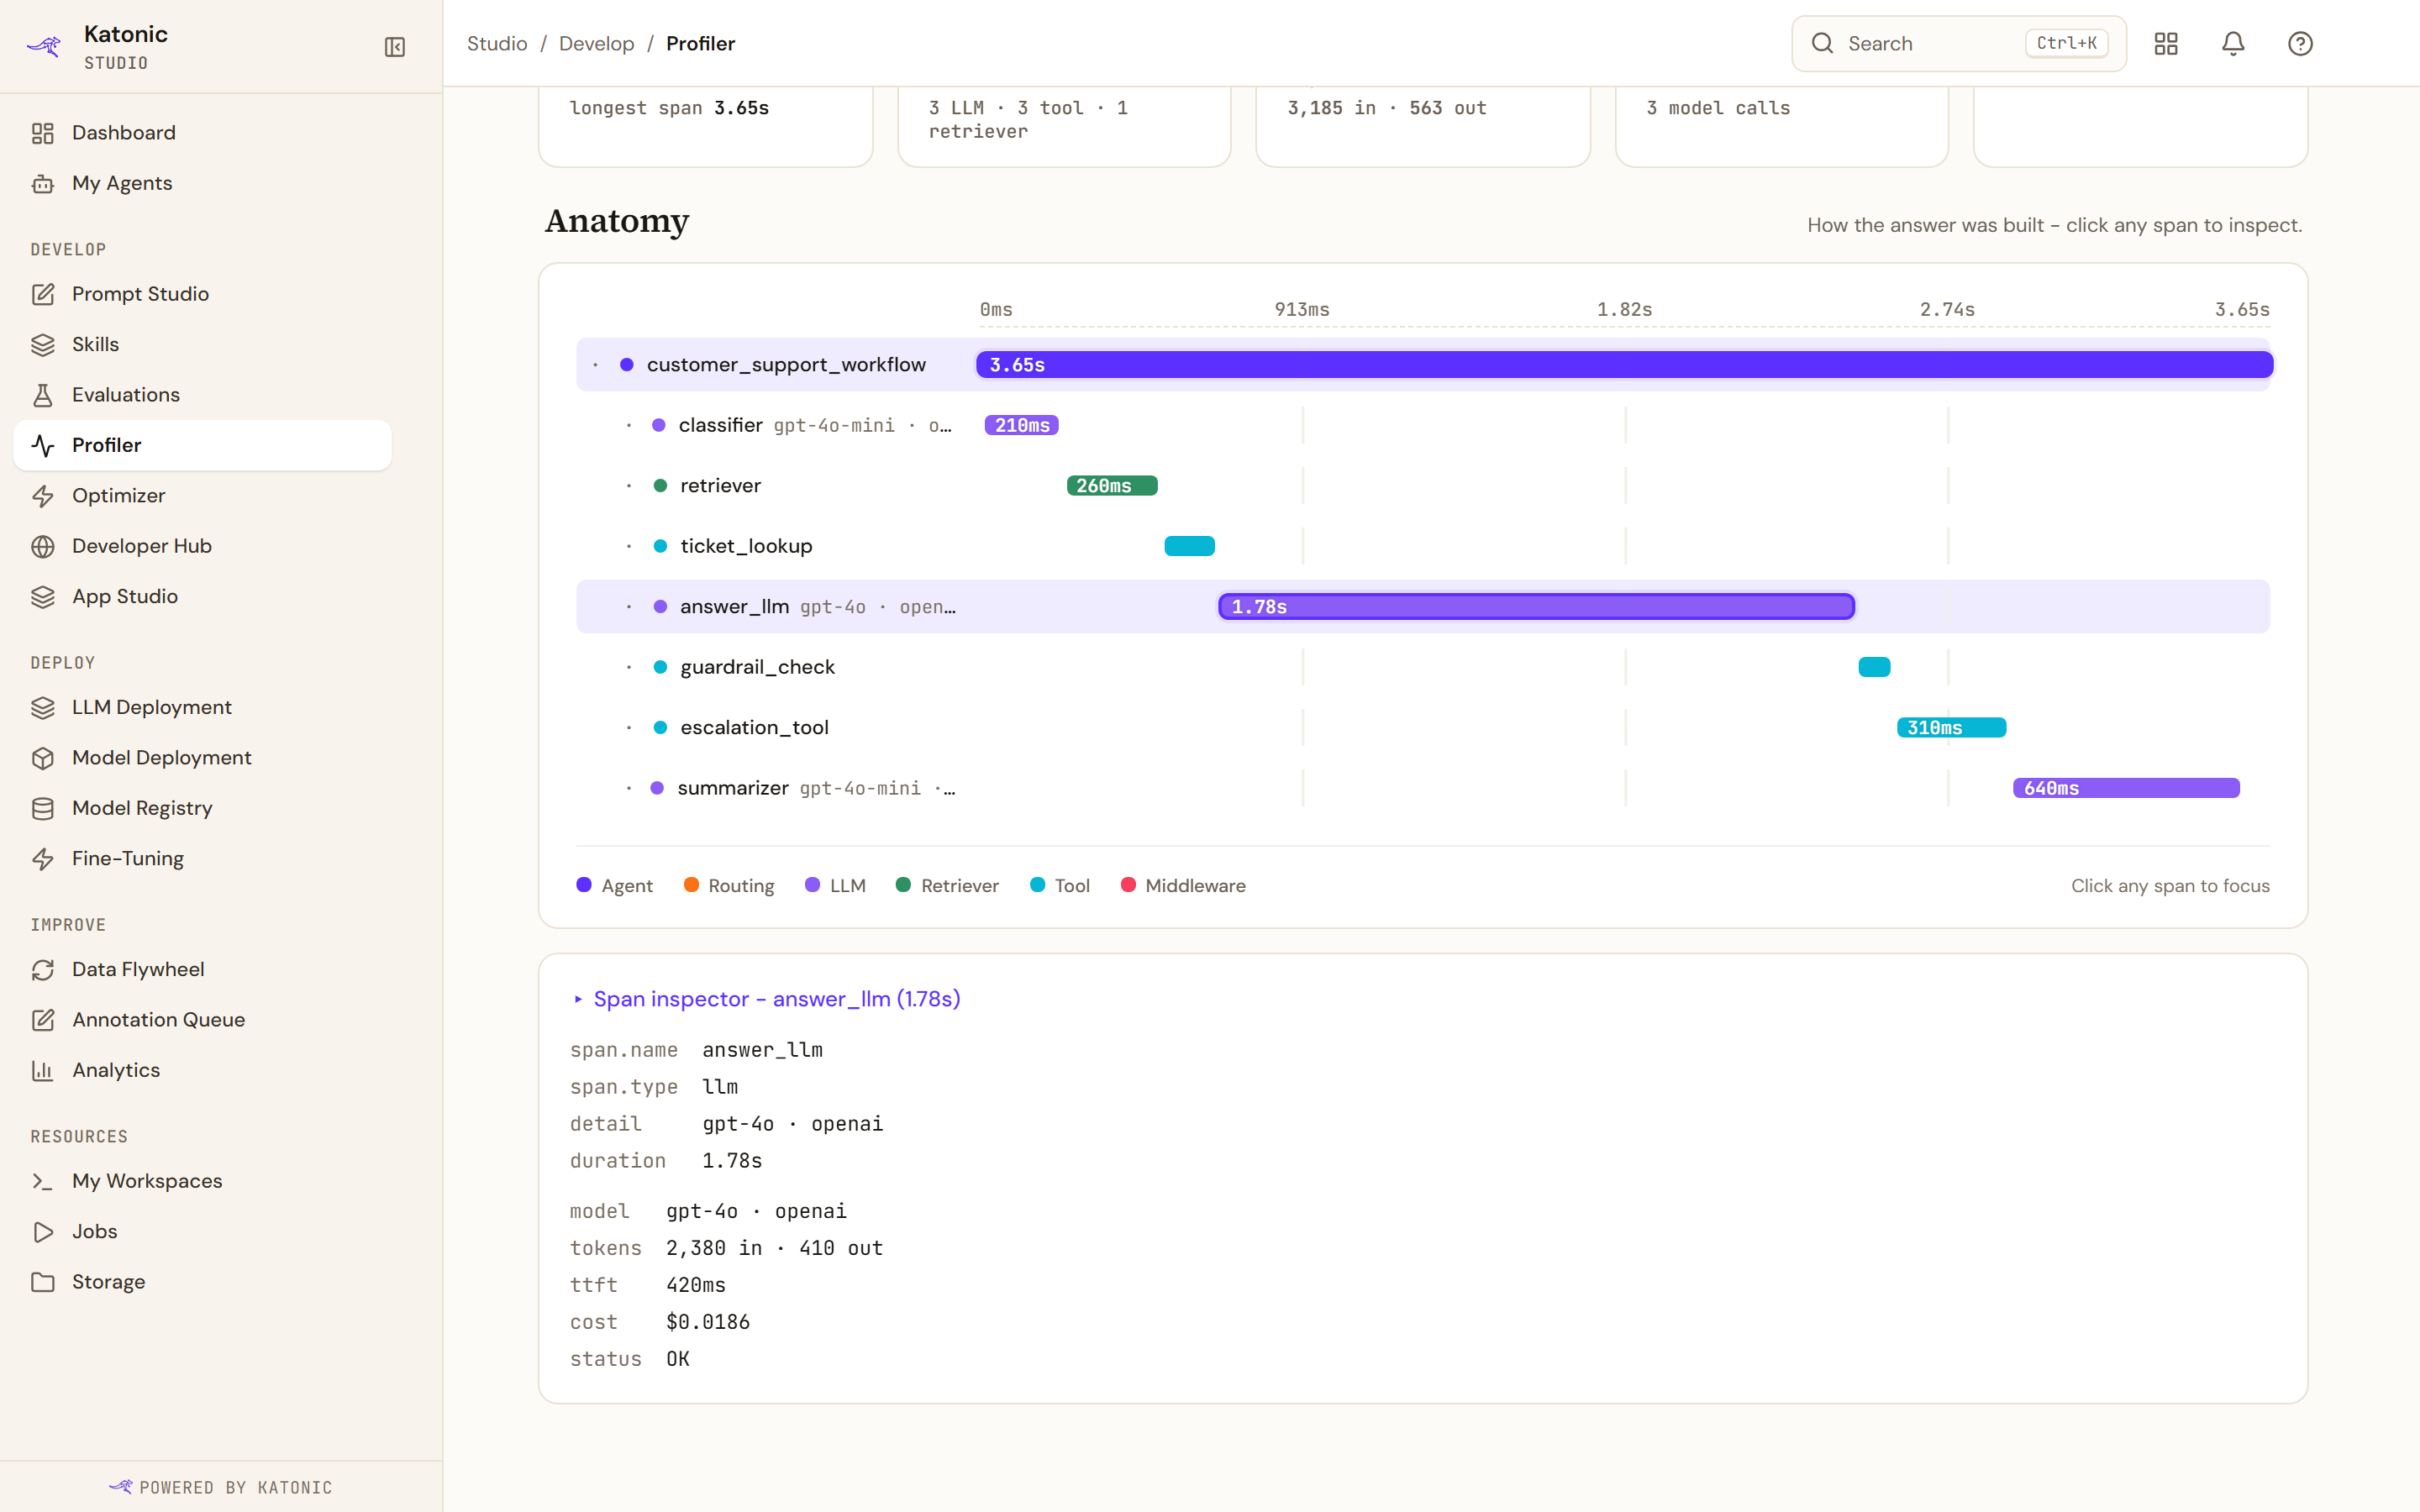
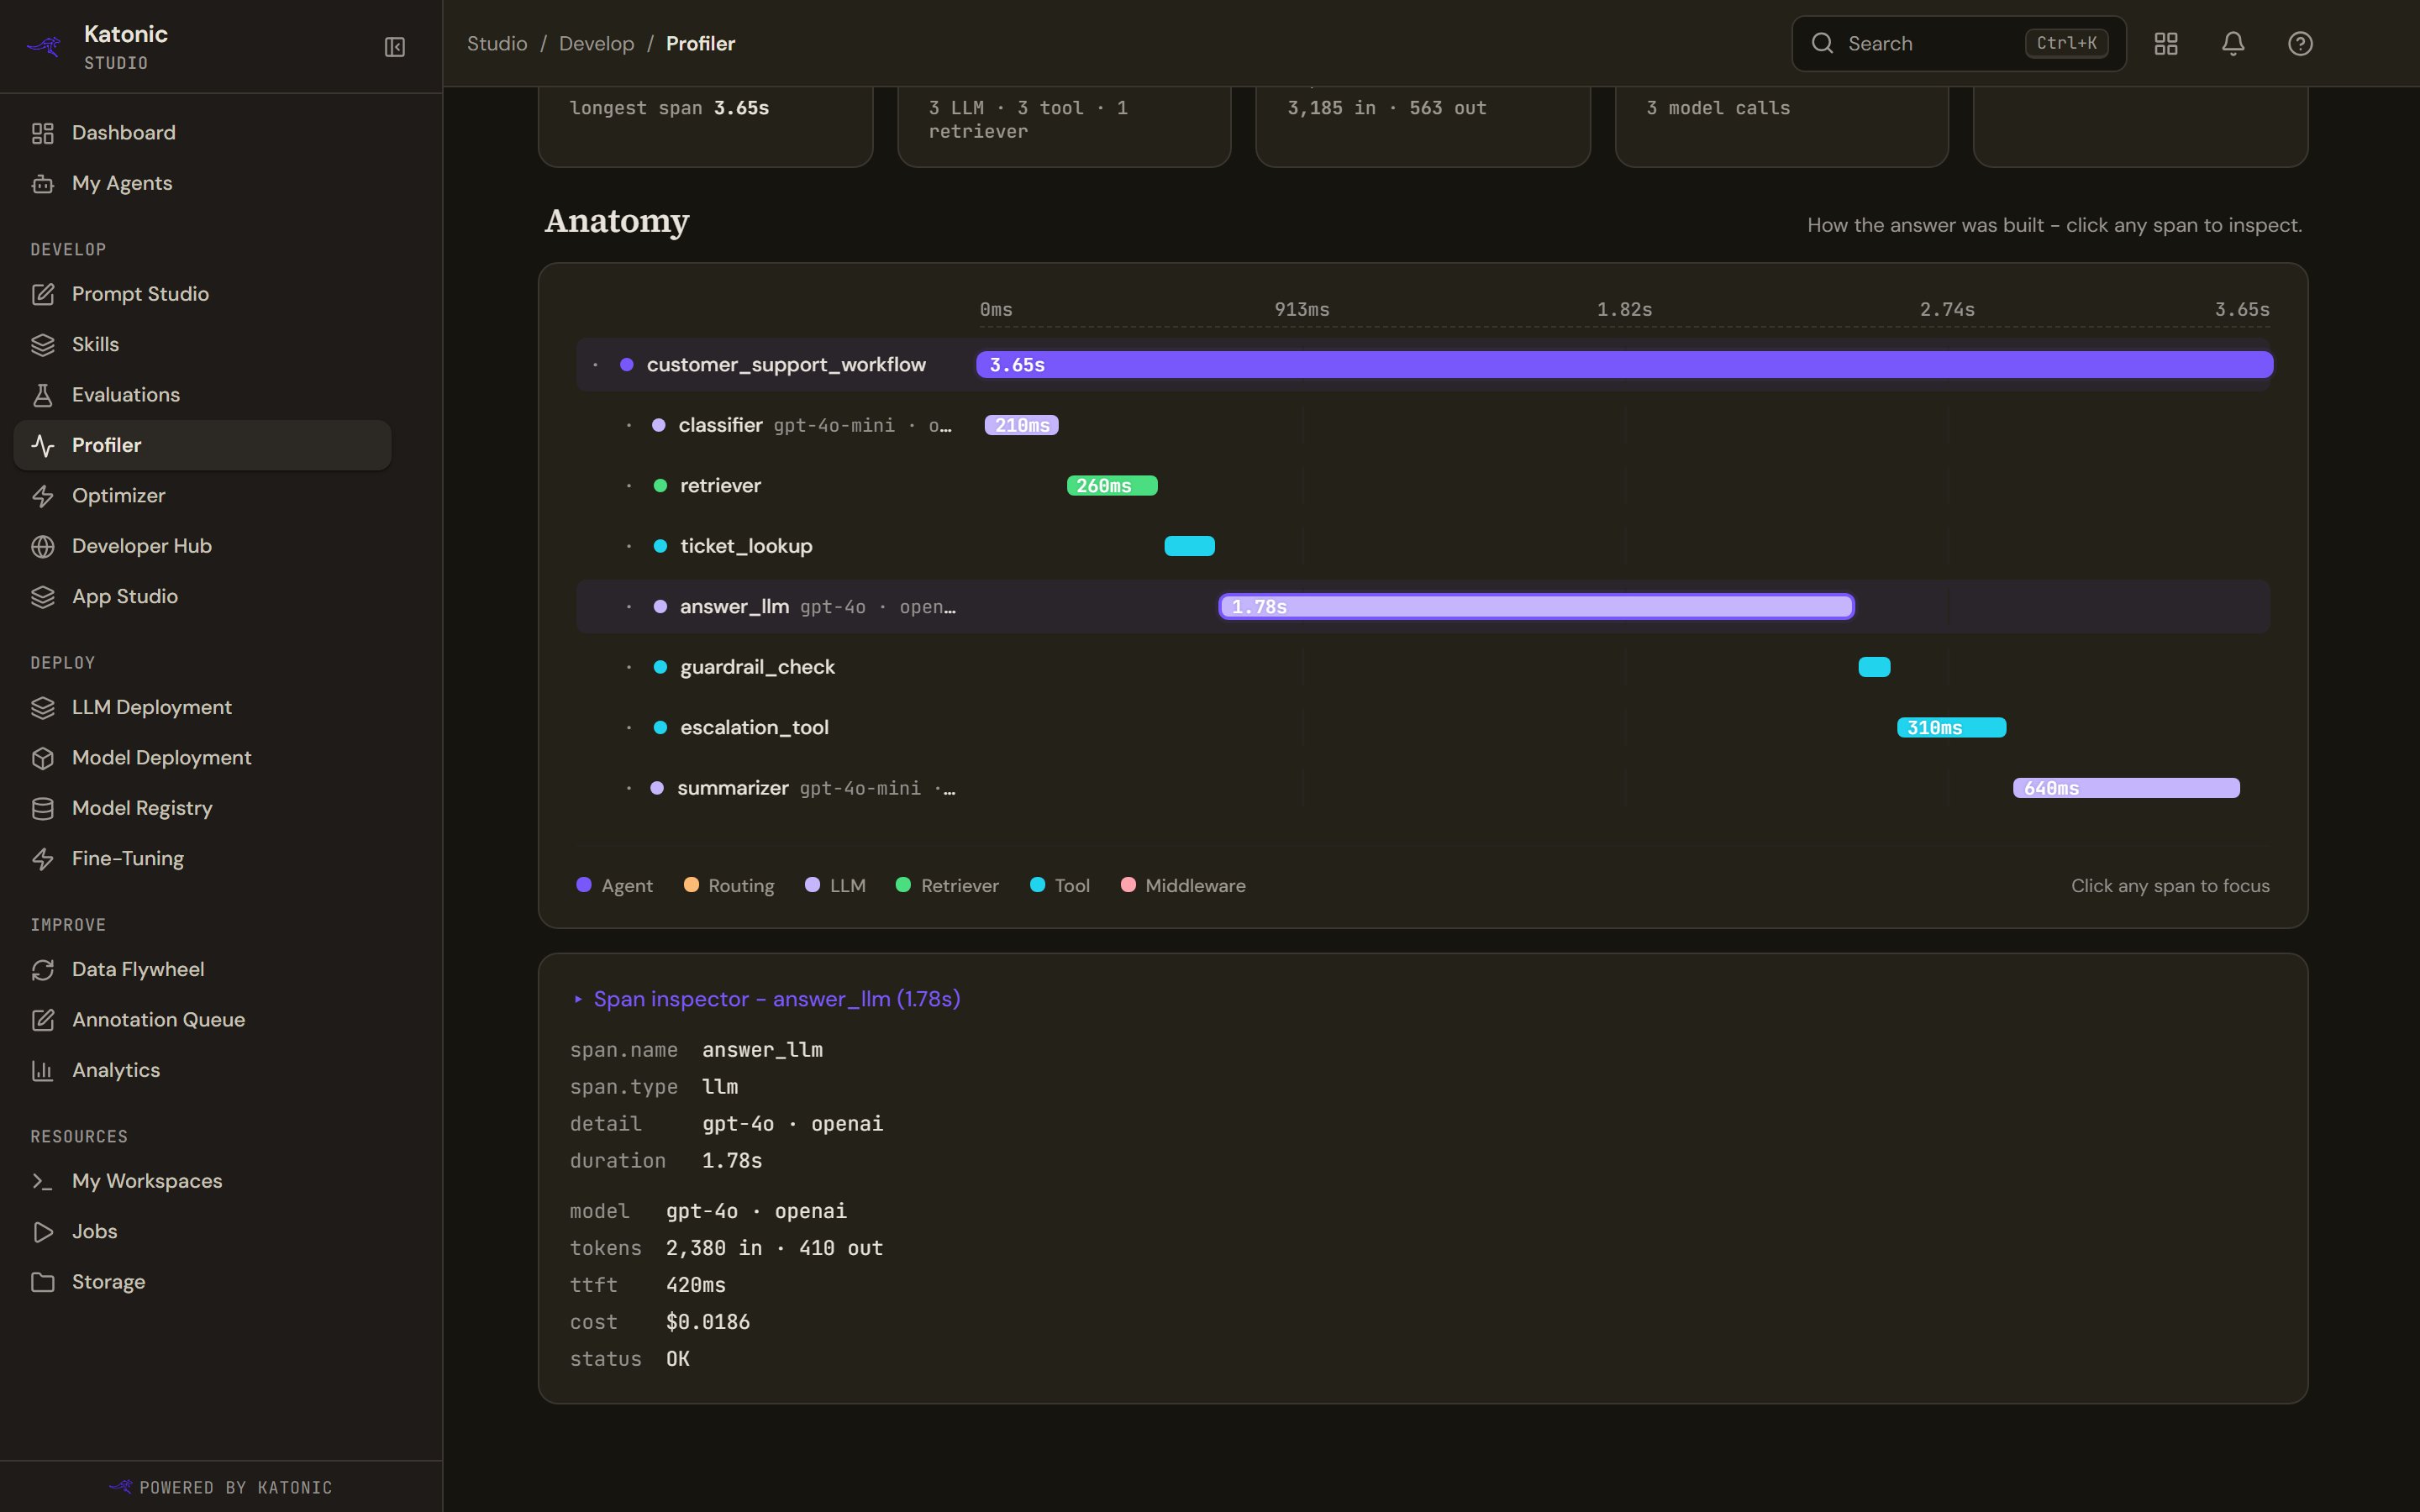
Selecting a span opens the inspector under the waterfall with the span's name, kind, detail and duration. Where the platform captured them, it also shows the model and provider, the tokens in and out, the time to first token, the decode rate, the cost and the status. A span with none of those says so, and notes that it may predate per-span capture or simply not be a model call. Every field on this page, and in the JSON it downloads, is defined on Trace and span fields.
Troubleshooting
- No waterfall data for this trace. The trace may be too recent to have reached the observability pipeline, or the id may be wrong. The page suggests trying again in about thirty seconds or picking another trace.
- The per-kind counts under Spans read zero. The names the platform records for a step and the names this figure counts are different sets, so nothing lands in any of them. The span count itself, the durations, the order and the totals are unaffected.
- There is no thumbs-up or thumbs-down on a trace. Feedback has no home to go to yet, so the control was removed rather than left to discard clicks.