Find an answer in the Profiler's traces
Agents
Traces, titled Recent answers, is every conversation the agent handled in the window, with the answer it gave and the judge's score. It is where you go from "quality dropped" to "these are the answers that dropped it".
Who can use it: the Builder role or higher, in a tenant licensed for agents.
The table
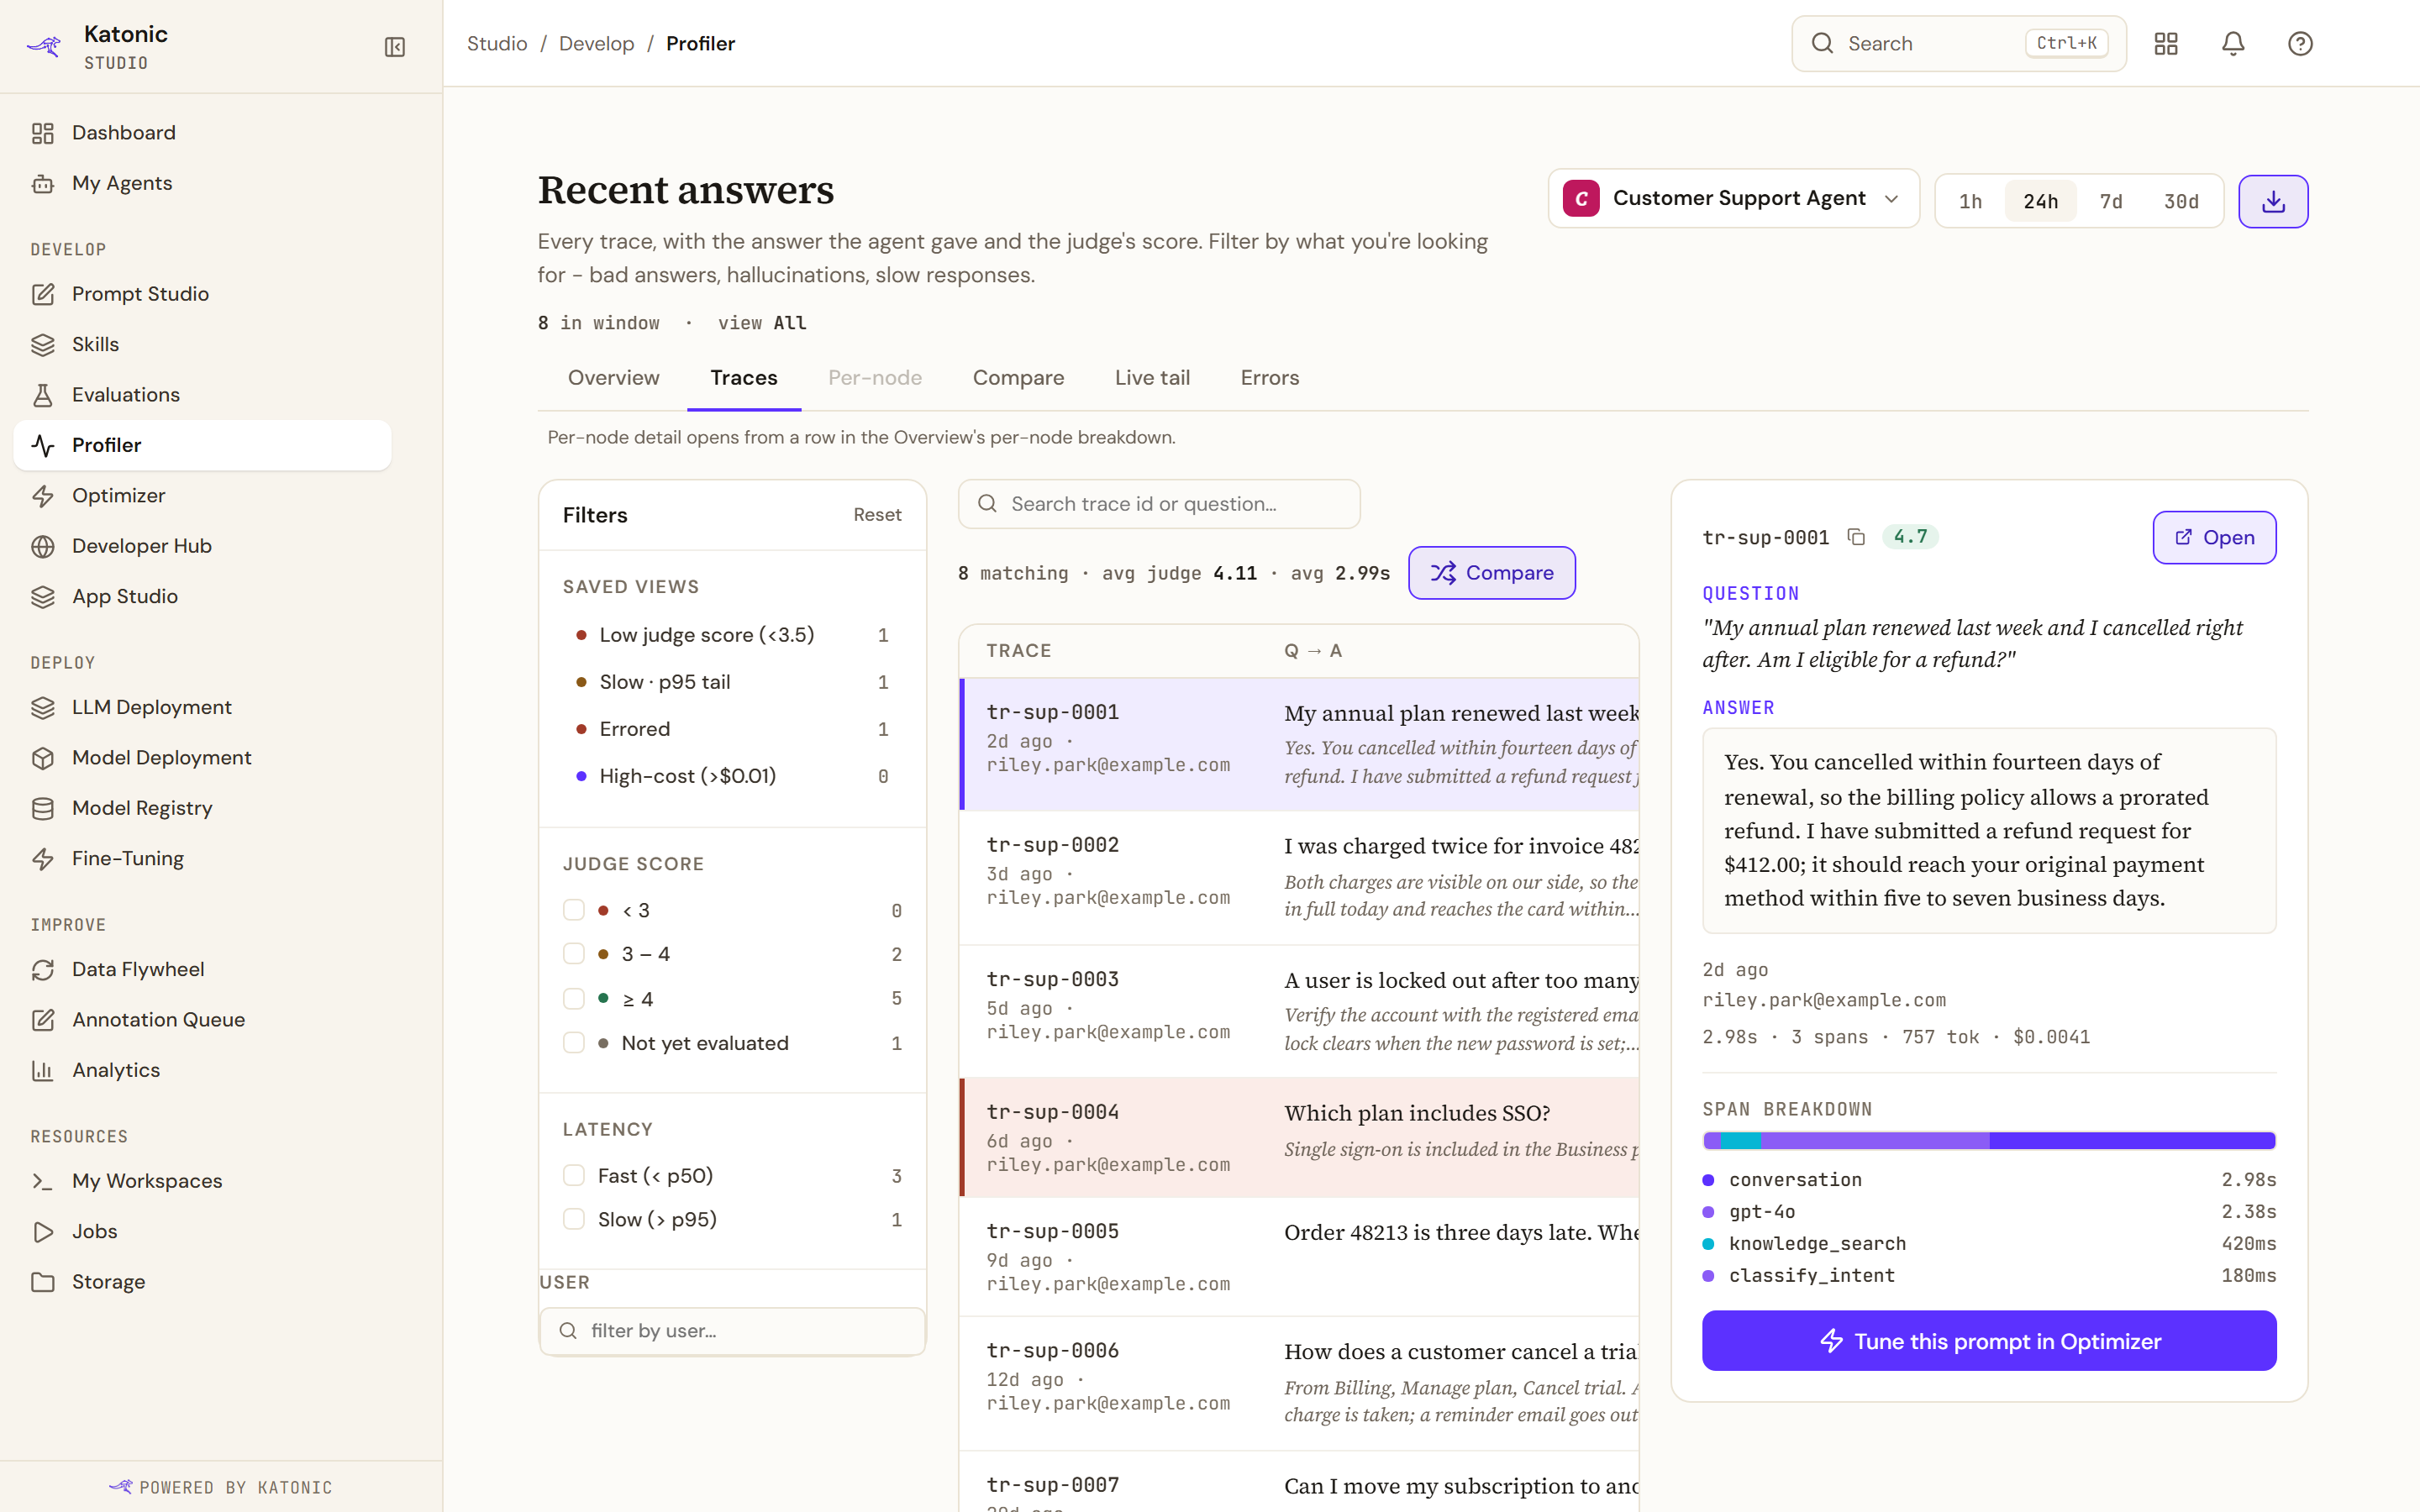
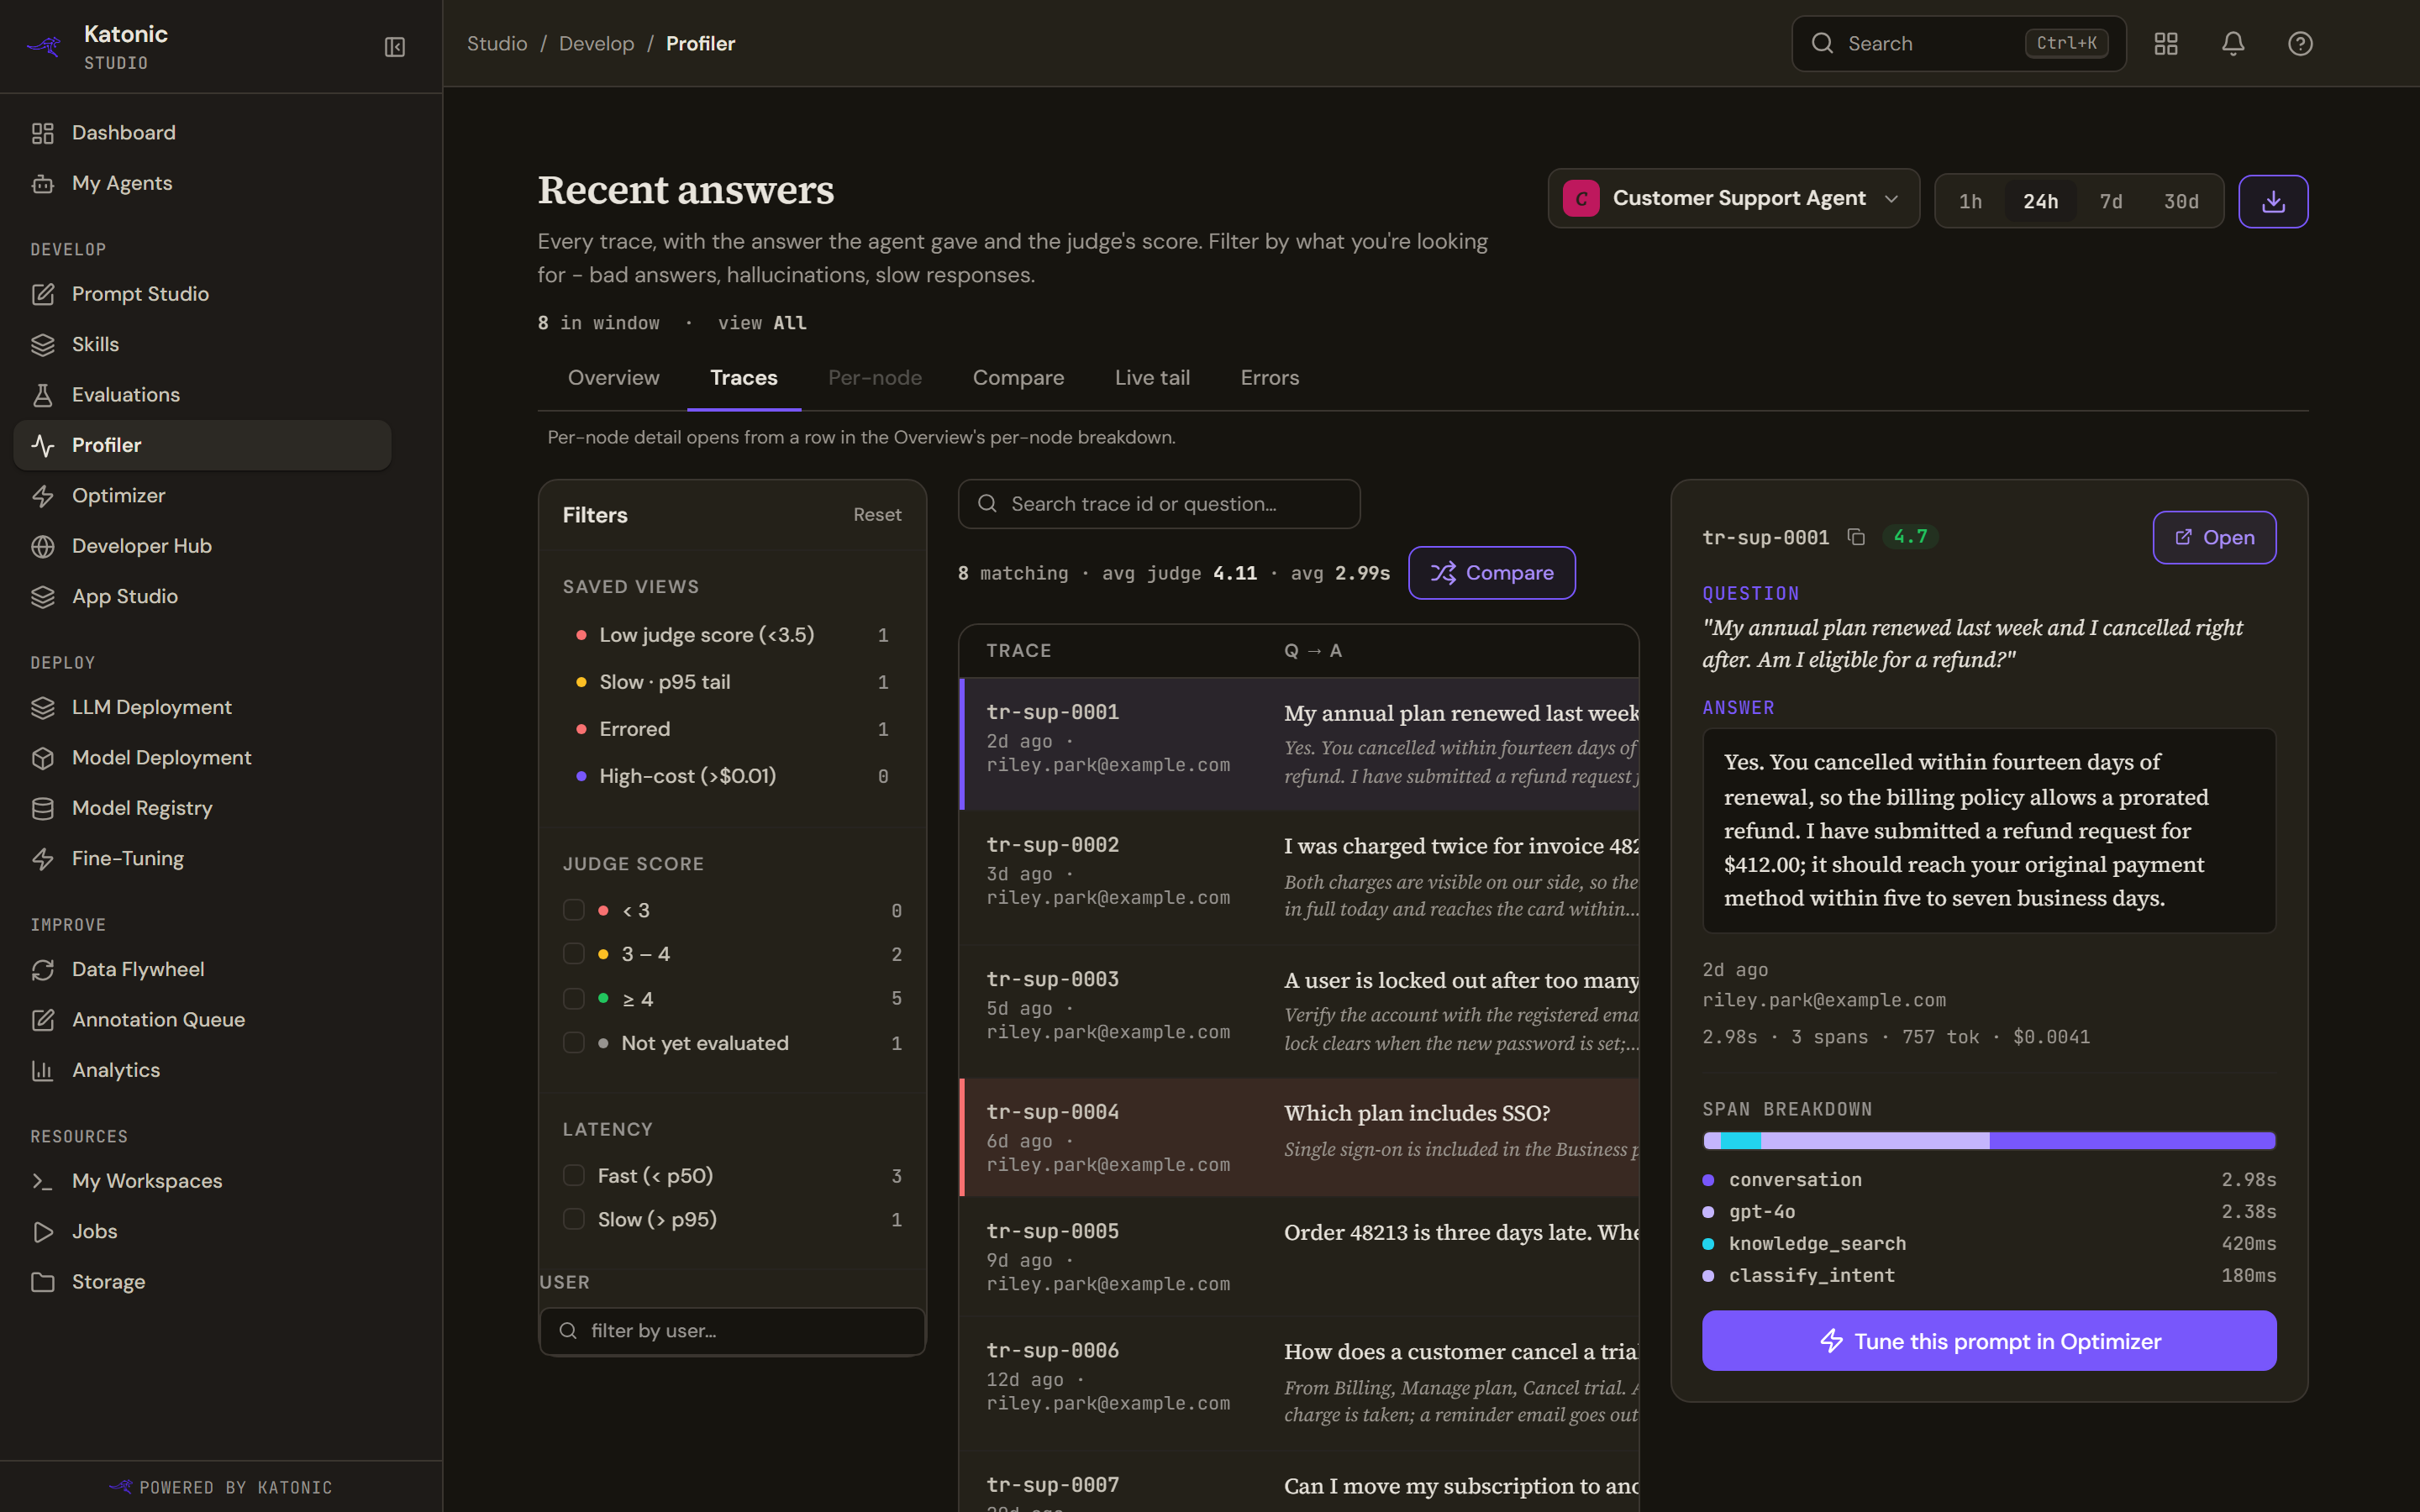
Each row is one trace: its id and who asked, the question and the answer, the quality score, the latency and the cost. The line above the table counts what matches and gives the average judge score and latency for that selection, so narrowing the filters re-states the averages for the subset. The header carries its own agent picker and window, and a download icon that exports the list as JSON.
The preview beside the table is always open: the first matching trace is selected when the page loads and whenever the filters drop the one you had chosen, and selecting a row changes it. With the preview open, the table scrolls sideways to its Quality, Latency and Cost columns. Compare opens the version comparison.
Filters
The rail on the left narrows the list, and Reset clears it.
| Group | What it offers |
|---|---|
| Saved views | Low judge score, the slow tail, errored traces, and high-cost traces, each with its real count |
| Judge score | Below 3, 3 to 4, 4 and above, and not yet evaluated |
| Latency | Faster than the median, slower than the 95th percentile |
| User | A free-text match on who asked |
The counts are computed from the traces in the window, so a bucket with nothing in it reads zero rather than disappearing. The search box above the table matches a trace id or the text of a question.
The preview
The preview shows the trace id with a copy button and the judge's badge, then the Question and the Answer; a trace that failed says it has no answer. Below that: how long ago it ran, the user, the session, the duration, the number of spans, the tokens and the cost.
Once the trace's spans have loaded, Span breakdown adds a proportional band, the six slowest spans by name and duration, and one sentence naming the bottleneck span and the share of the trace's time it took.
Open opens the whole trace. Tune this prompt in Optimizer opens a new Optimizer run carrying this agent and this trace, so you do not pick either again. There is no replay control: the platform has no replay endpoint, so the button that promised one was removed rather than left inert.
Troubleshooting
- Couldn't load traces. The observability service returned an error; Retry repeats the request. This is not the same as an agent with no traces, which says so plainly.
- No traces match the current filters. The window has traces but the filters exclude them all. Reset clears the rail.
- No traces in this window yet. Widen the window, or run conversations through the agent.
- There is no filter for the nodes a trace touched, because a trace row does not carry its node list.