Govern the platform day to day
Once people use the platform, governing it becomes a routine: watch what it costs, decide which tool calls need a person, keep guardrails on the agents, read the audit log and keep an eye on health. Every surface in this stage is in the Control Room, and each has more than this page covers.
Who can use it: the Admin role. The Auditor grant opens Policies, Audit Log, Analytics and Budgets; the Security grant opens Guardrails; the Operator grant opens Monitoring and Platform Alerts. Policies need the agent governance licence and Guardrails the guardrails licence.
Recorded on .
Watch spend
On the Dashboard, Spend · 24h shows the day's model spend through the AI Gateway and reads Budget breach when an alert has fired. Limits are set under Budgets.
- Create a budget alert
Select New Alert. In New Budget Alert, enter an Alert name, pick a Period (Daily, Weekly, Monthly) and a Scope (Global, Team with Select a team…, or Agent with Select an agent…), set the Threshold (USD) and Warn at (%) (1 to 99). Under Notifications, add a Slack Webhook URL, Email Recipients or a Webhook URL that receives a JSON POST. Select Create Alert.
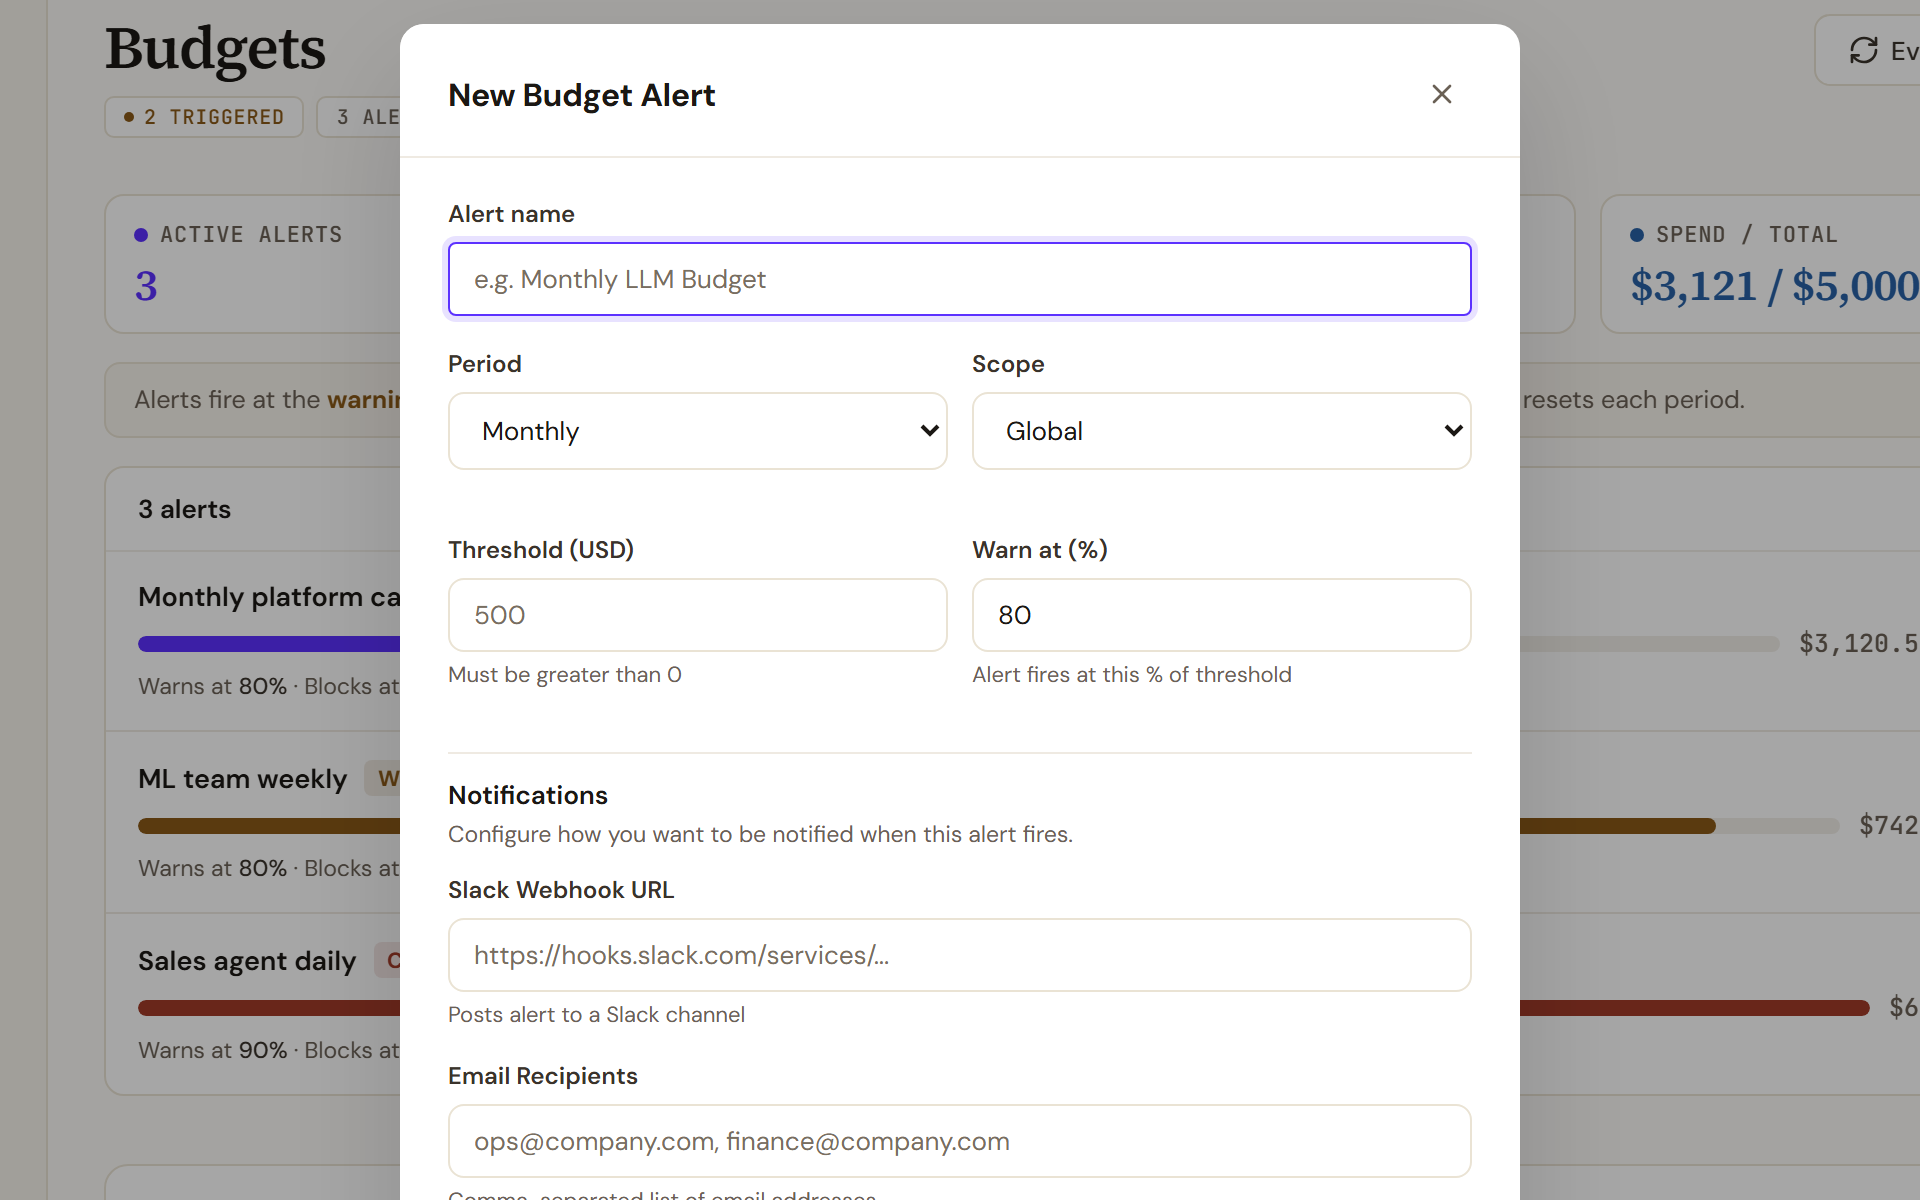
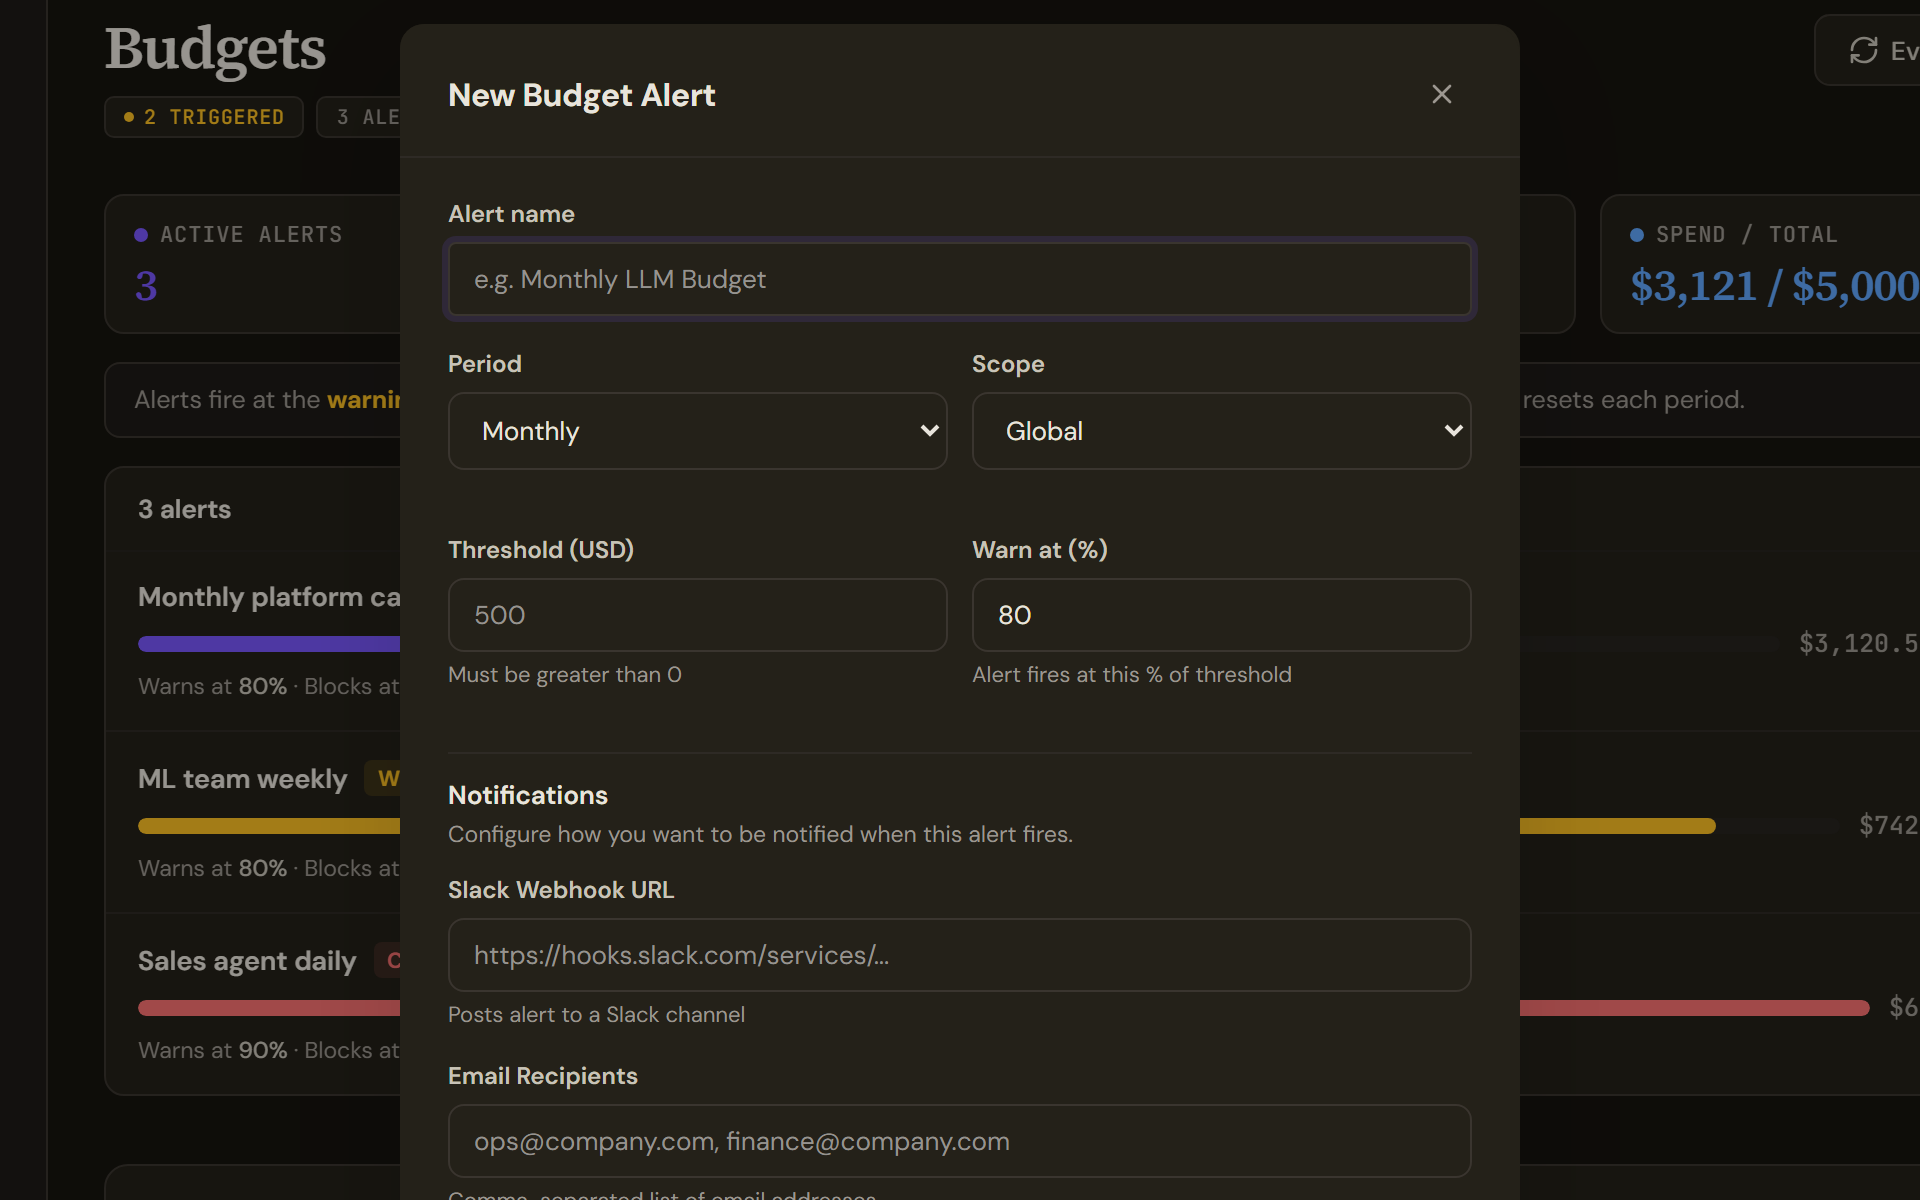
New Alert opens New Budget Alert. Choose a period and a scope, set the threshold and the warning percentage, then add the channels to notify when the alert fires. - Read the list
Each alert shows spend against its threshold, Warns at, and either Blocks at or why it does not block. Evaluate Now checks every alert against current spend; Delete alert (the bin) removes one without touching spend already made.
Whether an alert also stops calls is read from the gateway, not set on the alert, and the strip above the list states it: enforcement is active (calls are blocked at the percentages shown), advisory (Does not block (advisory)), degraded, or unknown (Blocking state unknown). When spend cannot be read, the page says Spend tracking degraded and shows a dash with the note Current spend could not be read from the enforcing gateway. This is not $0 - the amount is unknown. The Fine-tune spend ceiling card is a separate control for fine-tuning jobs.
Govern tool use
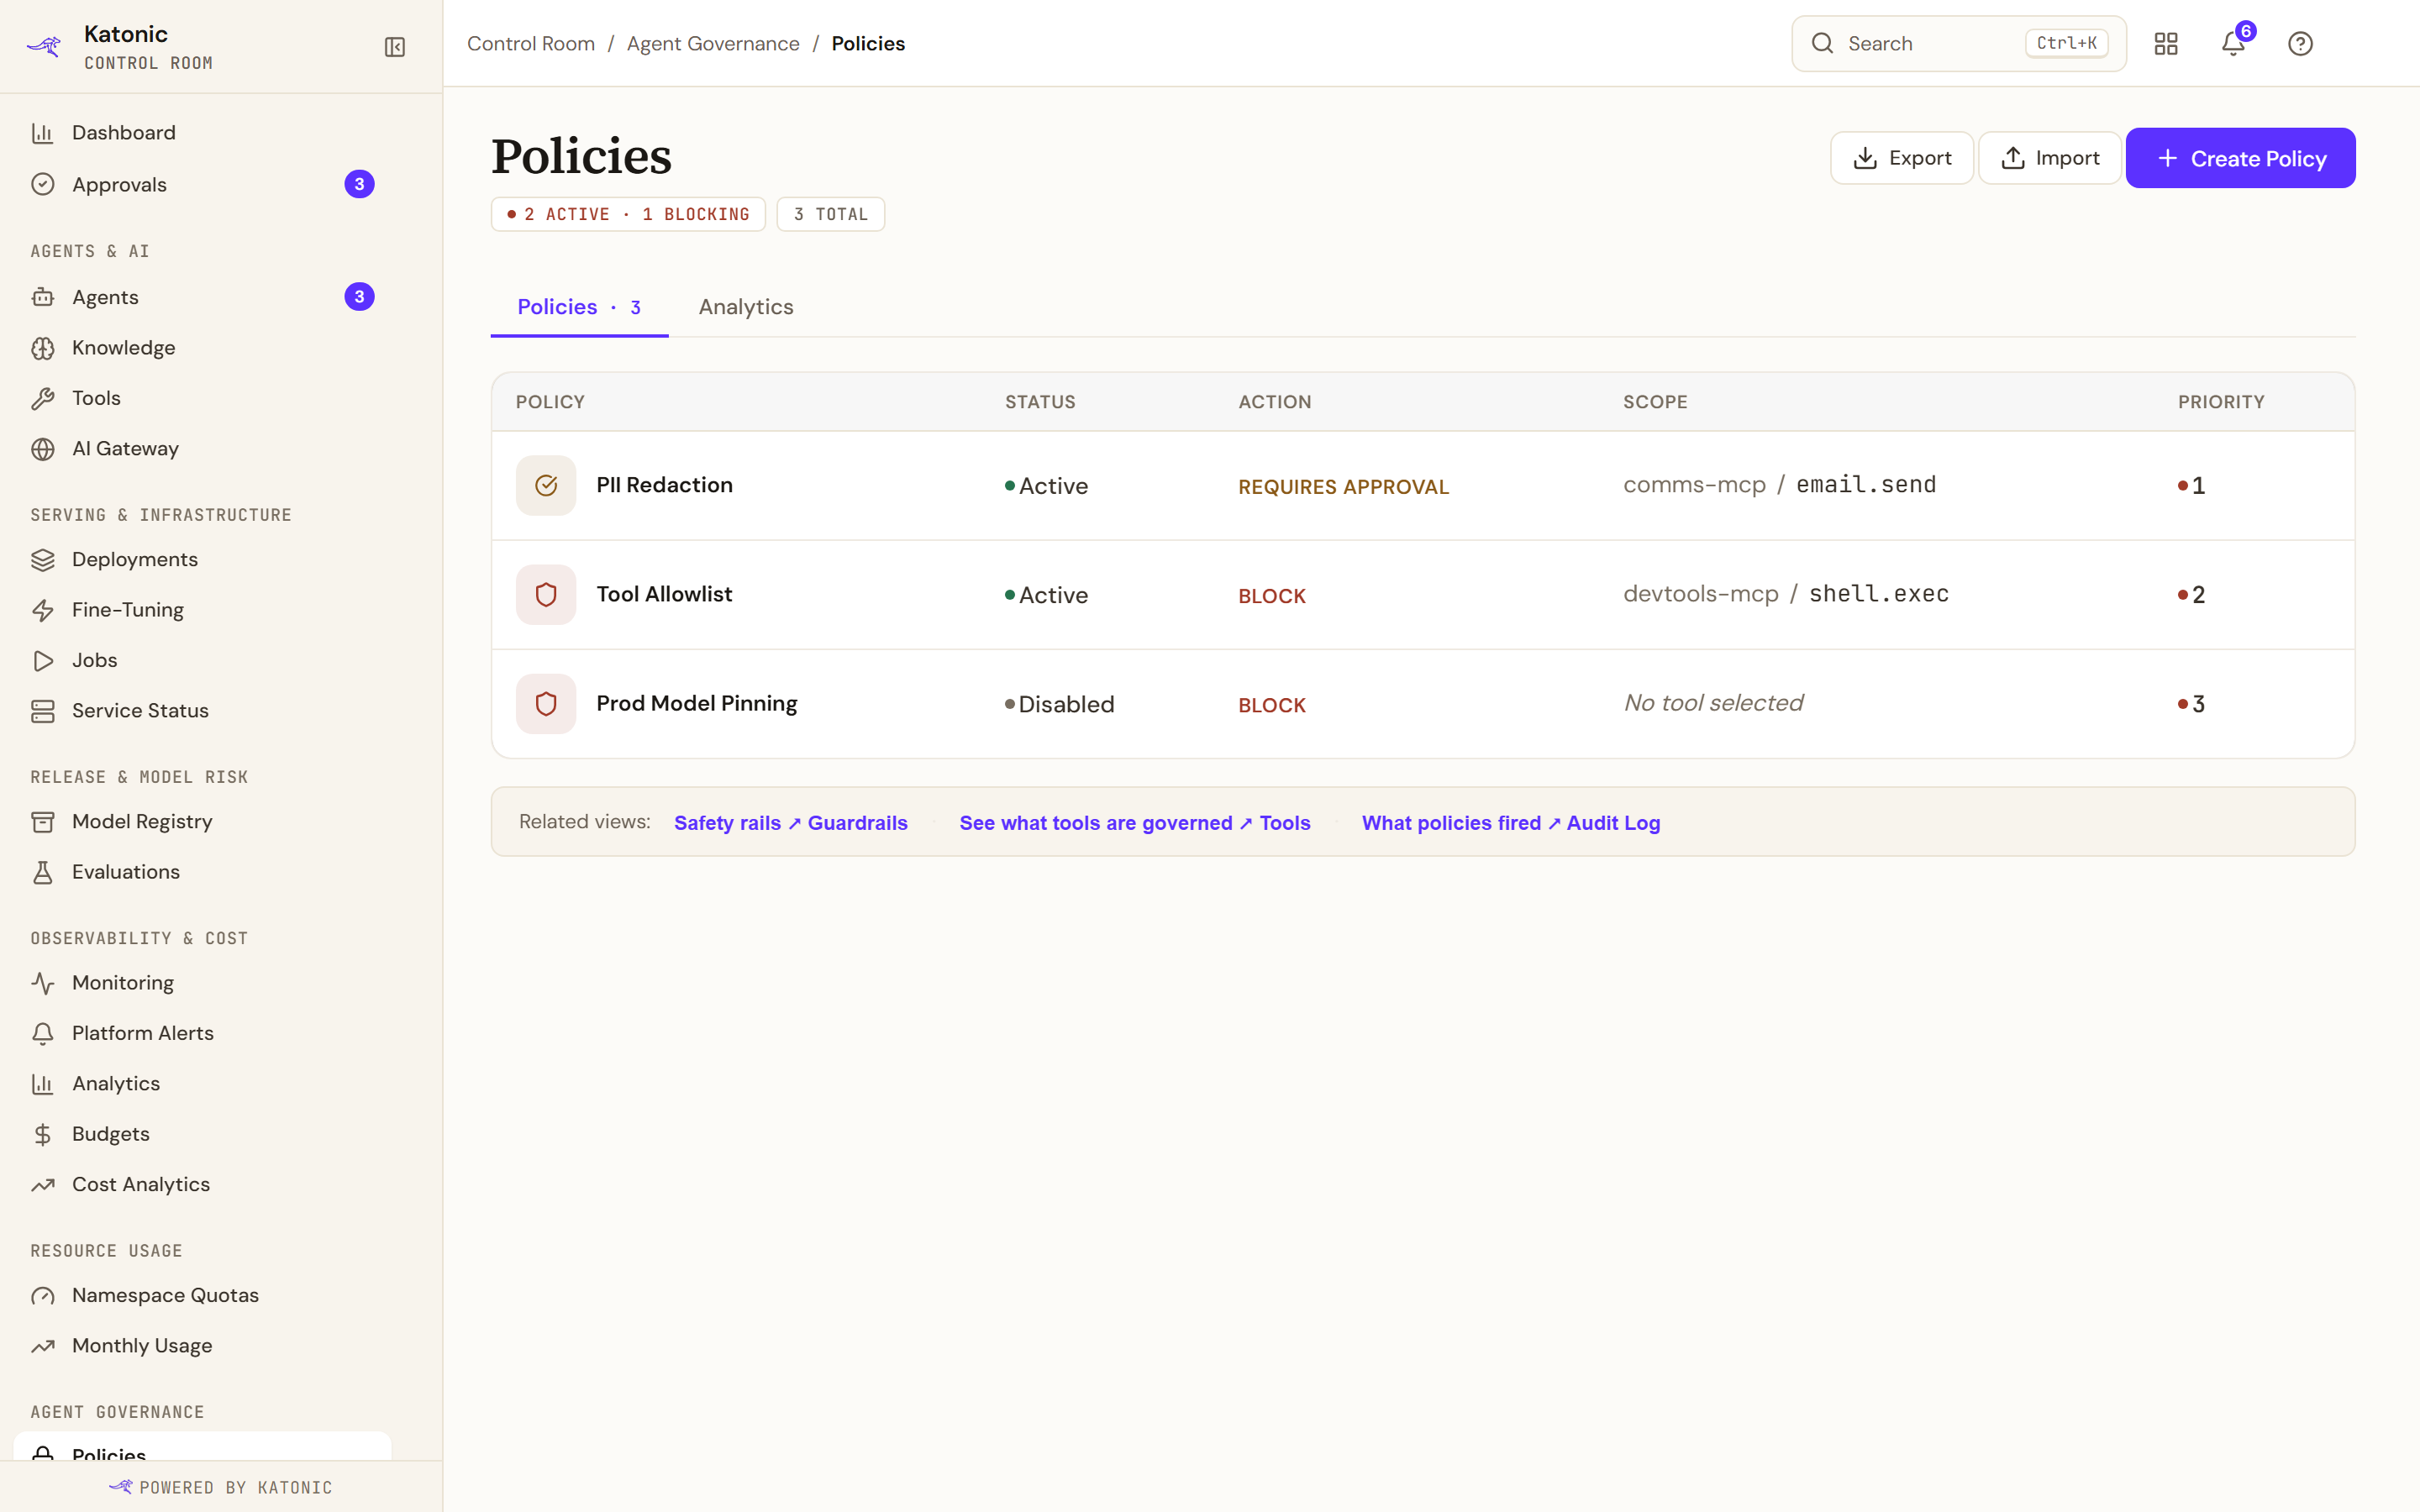
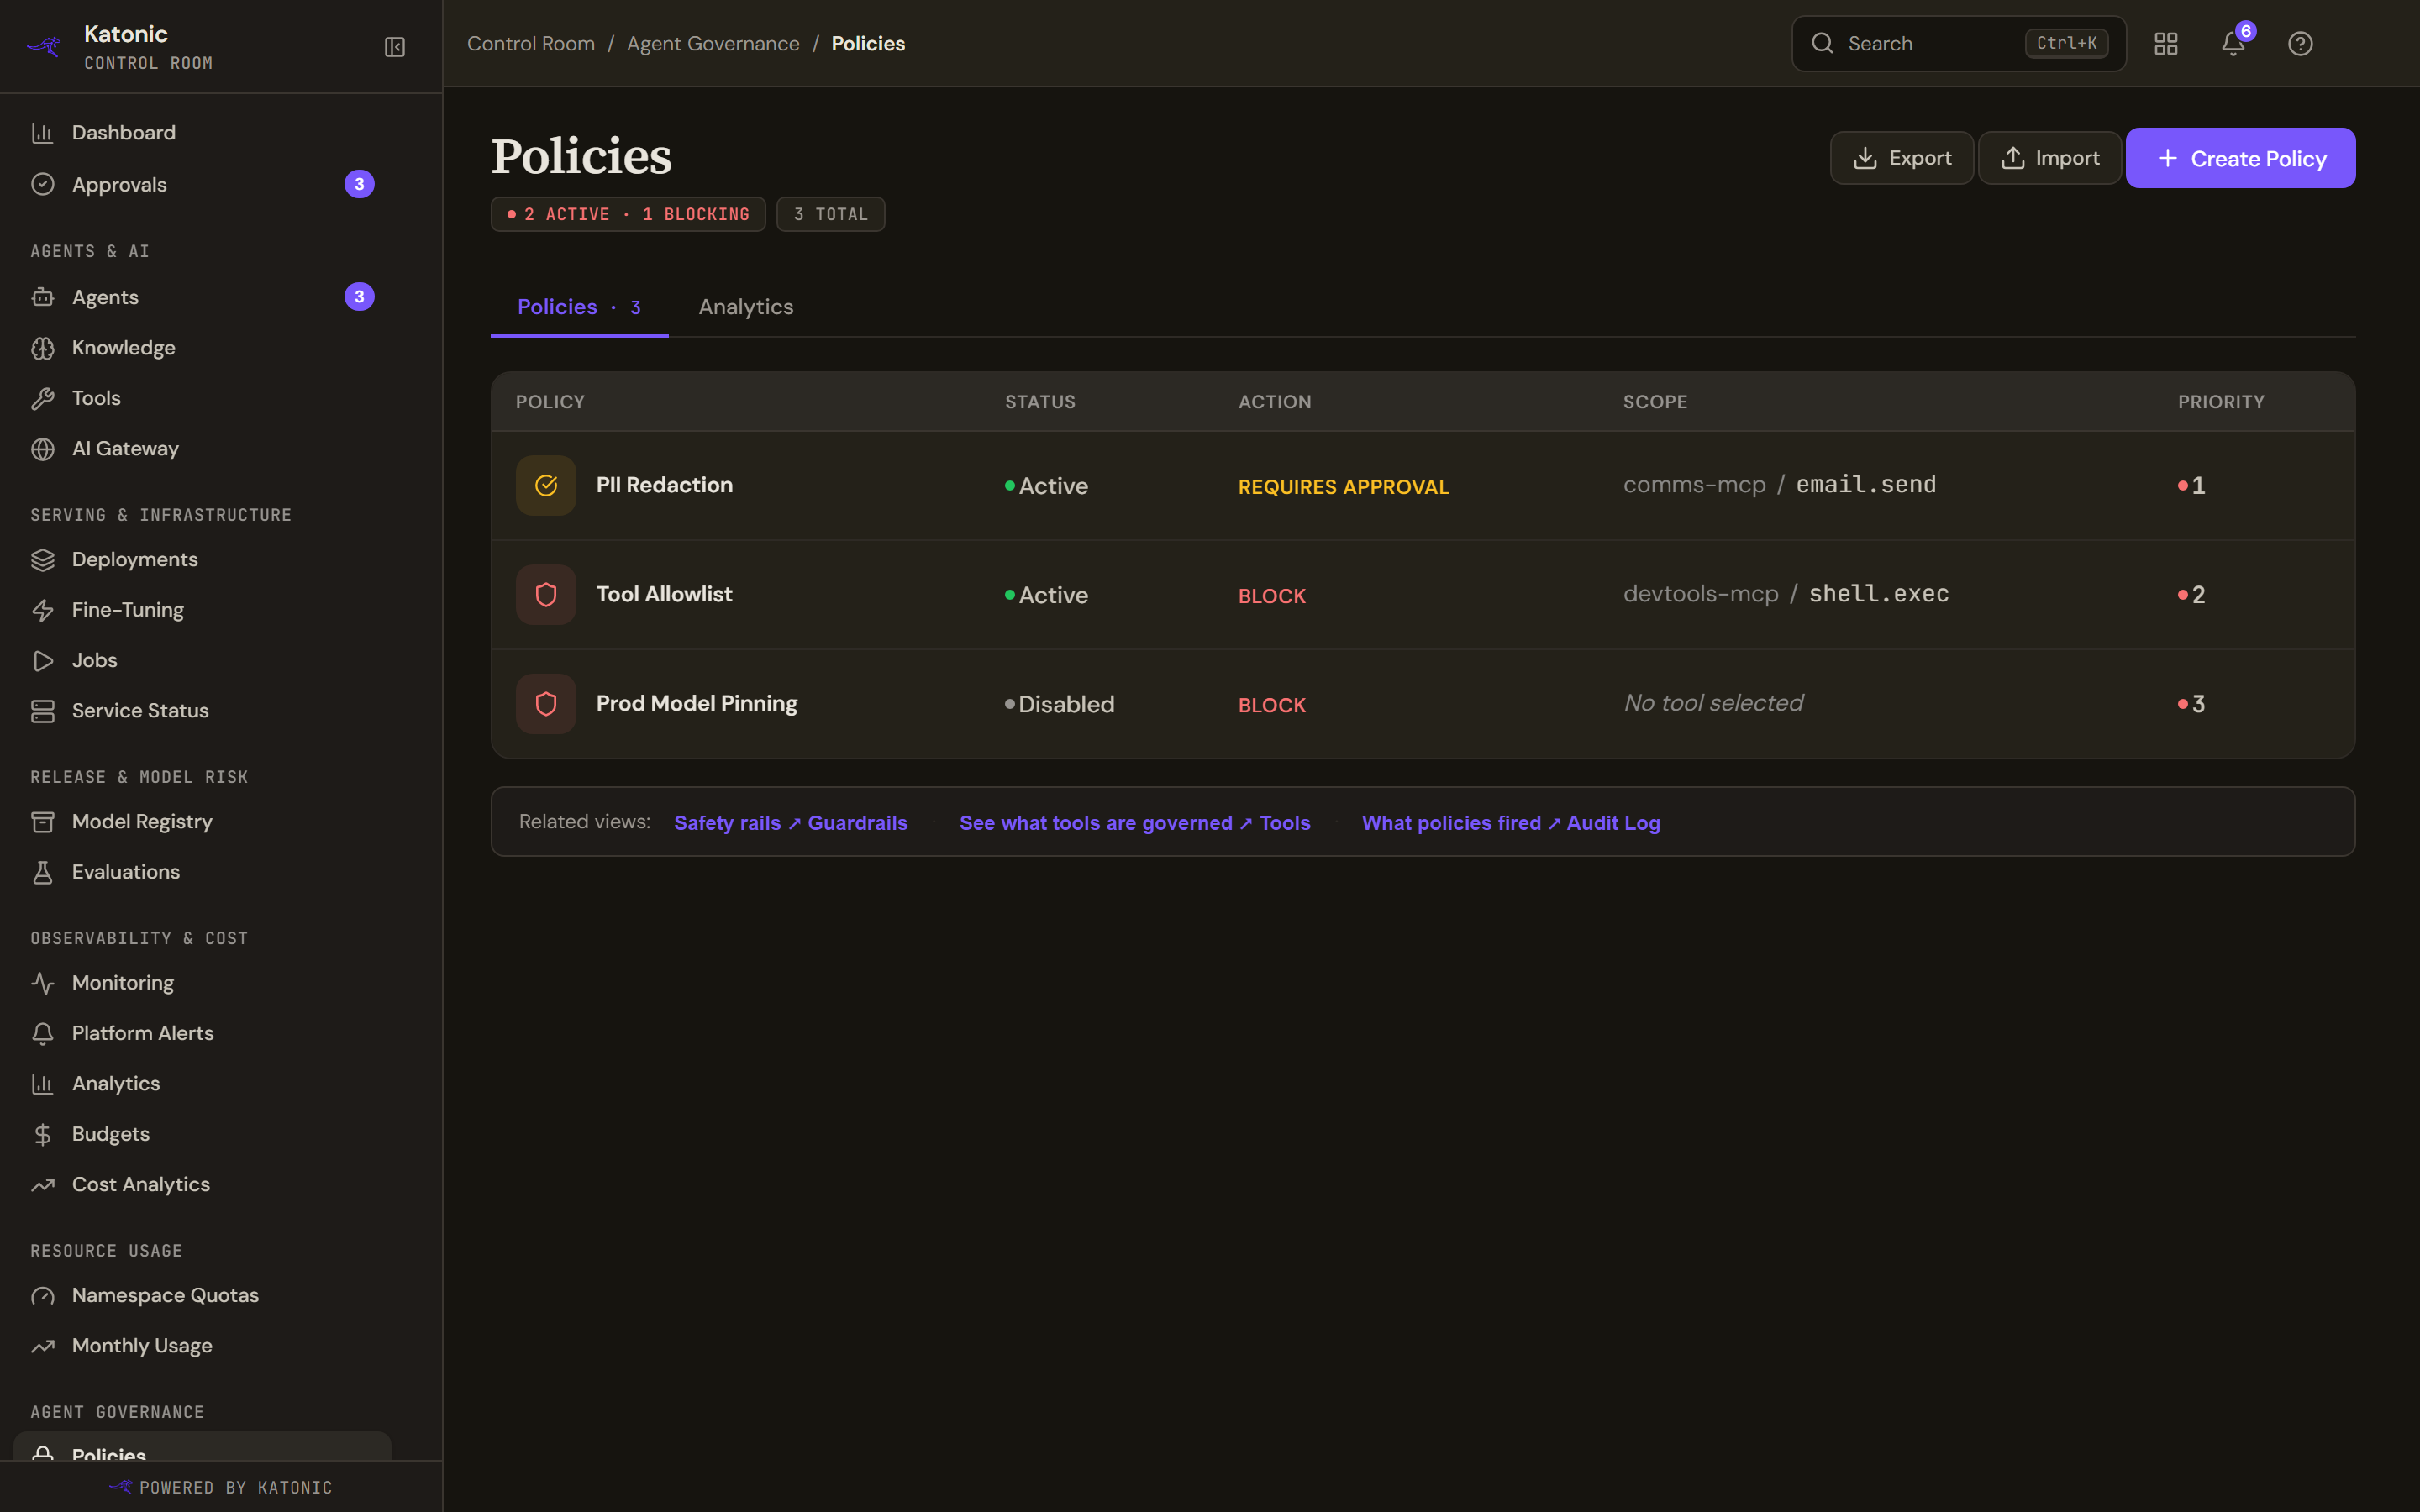
Policies decides what happens when an agent calls a tool. A new policy offers two actions: Requires Approval parks the call until a person approves it in Approvals, and Block refuses every call to the tool.
- Create a policy
Select Create Policy, or, while the list is empty, start from a Quick Start Templates card. Fill Policy Name and Description, choose the Action and, for Requires Approval, optionally list Approvers (empty notifies all admins). Under Scope, Server and Tool are both required and Team defaults to All teams. Under Settings, set the Priority (lower is higher) and keep the toggle on Active. Select Create Policy.
- Read the list
The columns are Policy, Status, Action, Scope and Priority. A row can read Active and still say Saved but not enforced: the policy is stored but the tool gateway is not applying it. Select a row to Edit, Disable or Enable, Delete, or Show History and Rollback to an earlier version.
- Check what fired
The Analytics tab shows Total Calls, Blocked, Allowed, PII Events and Block Rate for 24h, 7 days or 30 days, with Top Blocked Tools and Top Policies by Hits. Export downloads your policies as JSON; Import merges a file back in.
Apply guardrails
Guardrails holds profiles of safety rules applied to agent inputs and outputs: Input rails run before the prompt reaches the LLM, Output rails on the response before it leaves the system, and Tool rails on MCP tool-call arguments. Create Profile asks for a Profile Name, a Description and a Base Template: Minimal - injection detection only, Moderate - core rails enabled (recommended) or Strict - all rails enabled, high sensitivity. The list shows Profile, Status, Active Rails and Default; open a profile to Edit its rails, run a Test, read its Activity or Set as Default. A profile takes effect on an agent that names it (set in Studio), on the chat rooms when the Workspace Policy selects it as the Guardrail Profile, and otherwise as the default. A rail set to Warn only logs; the content still reaches the user.
Read the audit log
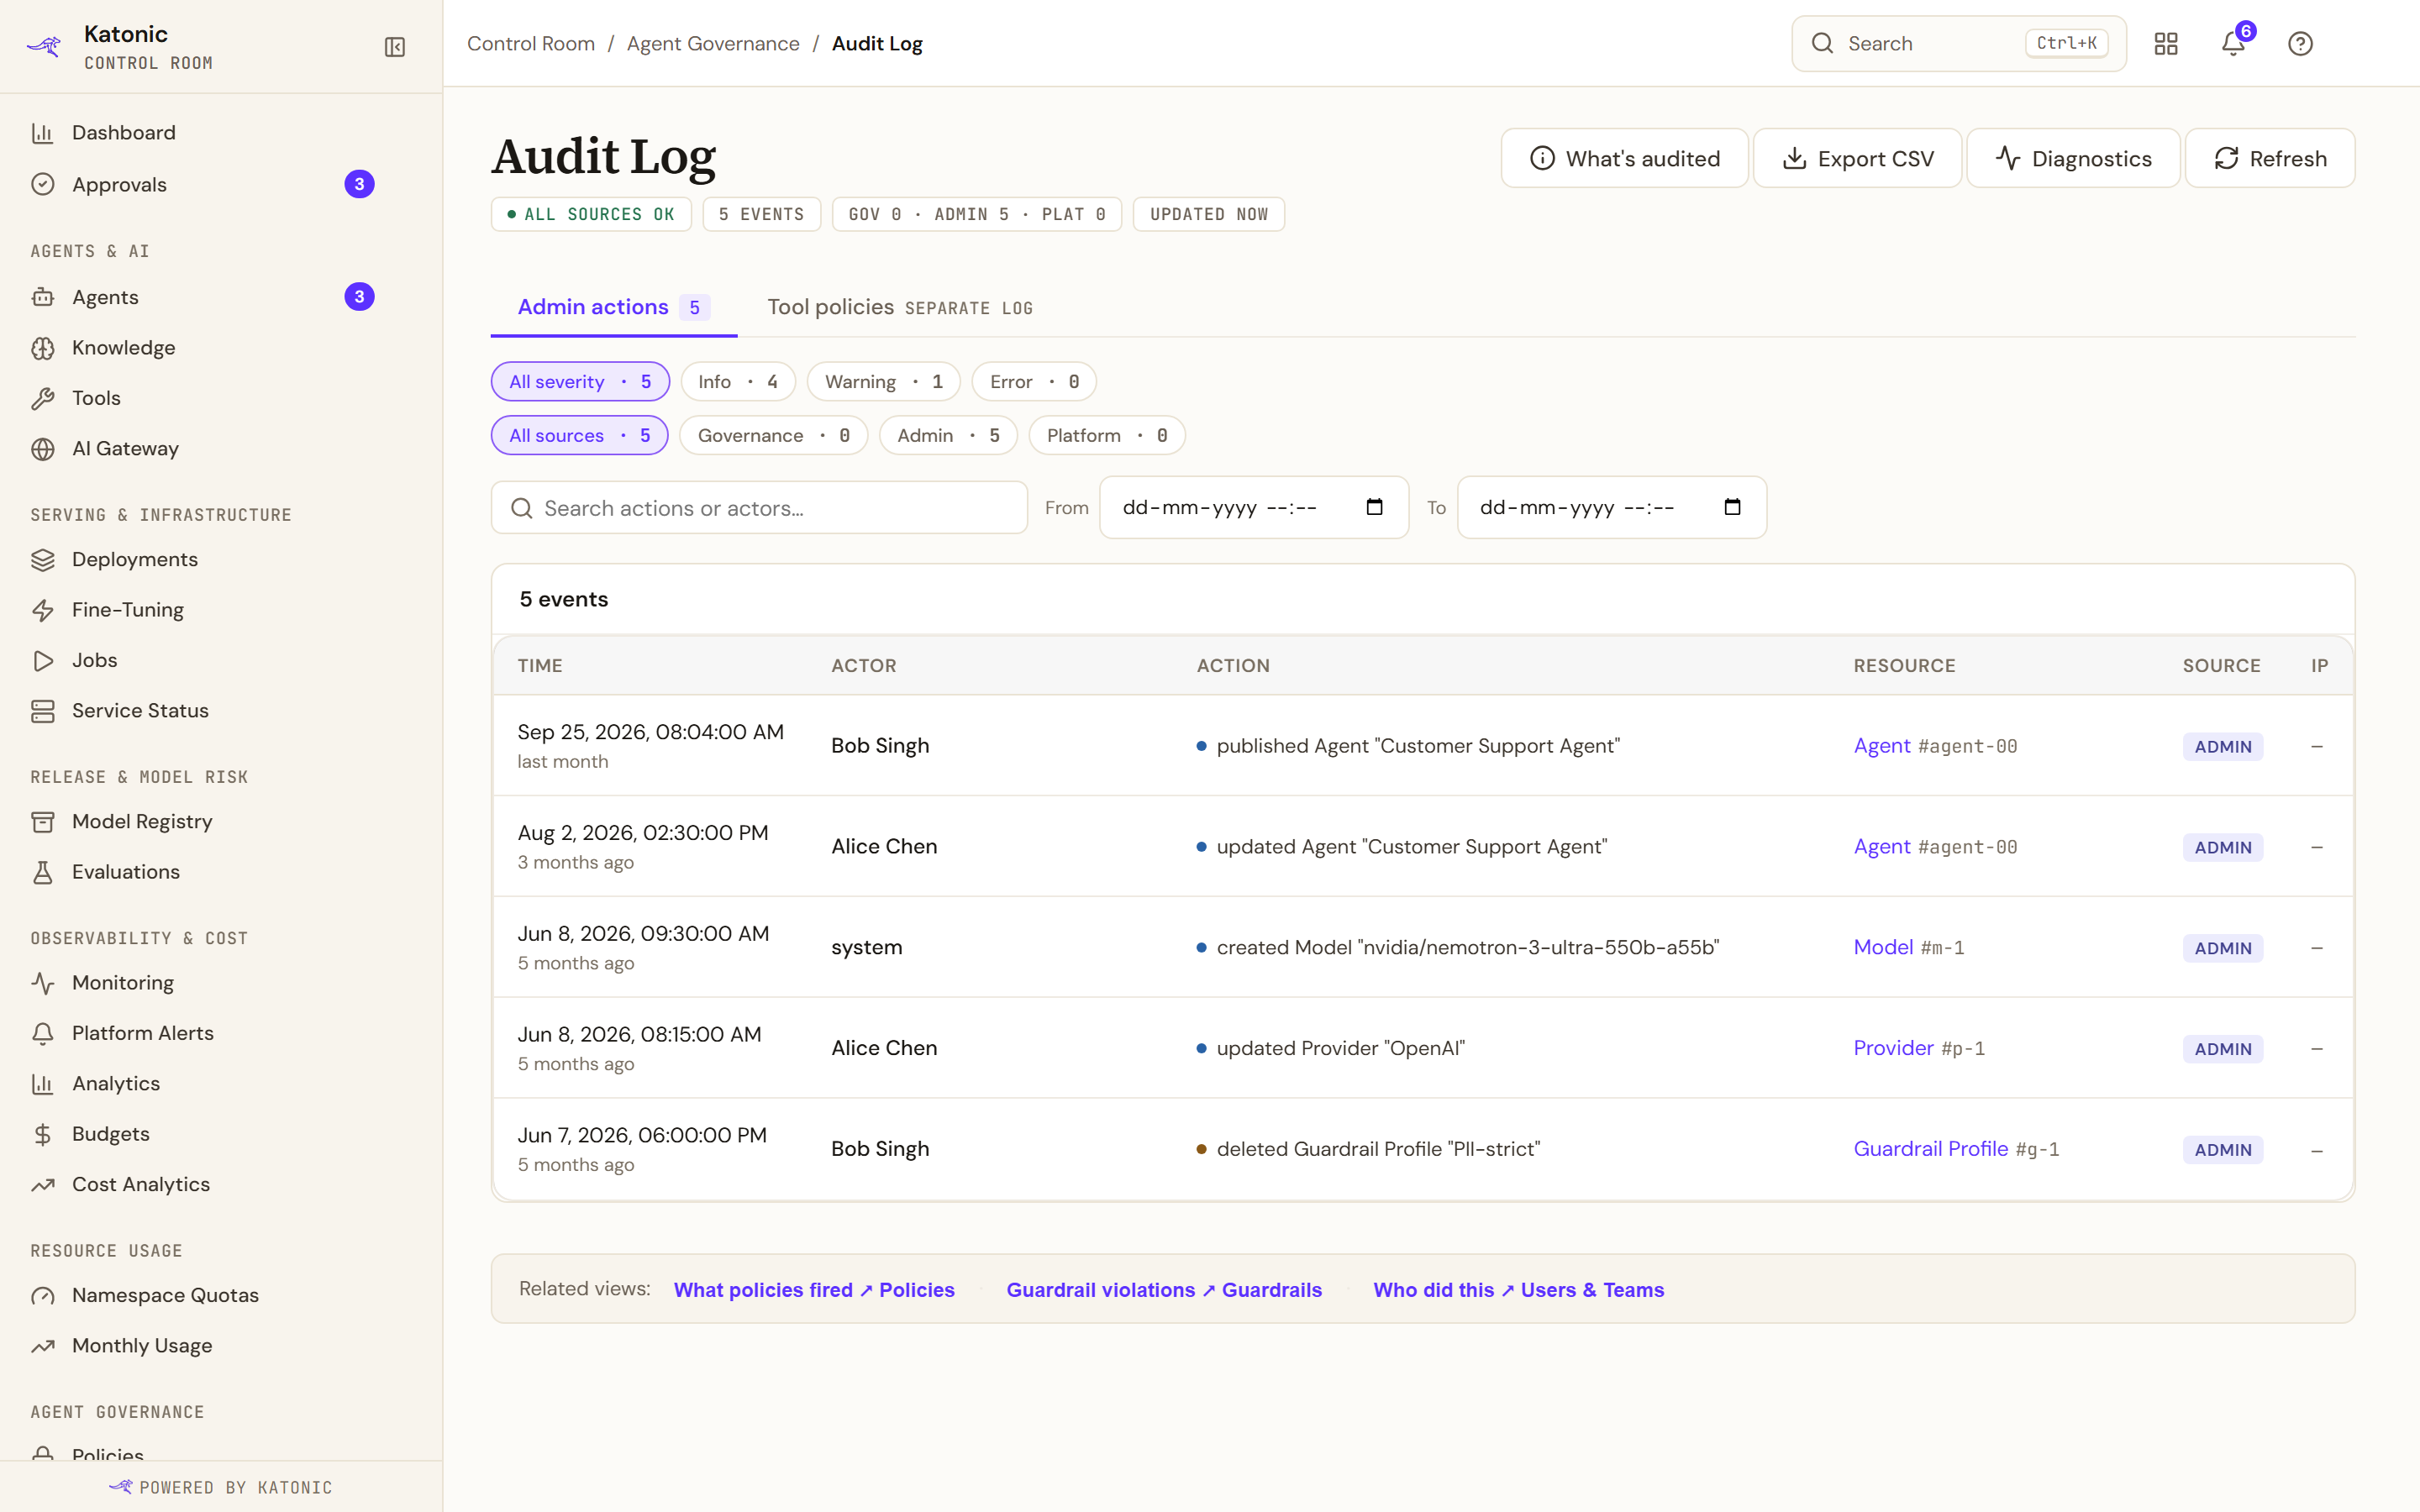
Audit Log has two tabs: Admin actions and Tool policies, a separate log of tool approval policy changes. Filter by severity (Info, Warning, Error) and source (Governance, Admin, Platform), use Search actions or actors… and the From and To fields, then read Time, Actor, Action, Resource, Source and IP; a row opens to Event info and Raw event data. What's audited lists what is covered today and what is not, Export CSV downloads the events shown, and Diagnostics reports the state of the two audit sources.
Watch health
Monitoring tracks requests, P95 Latency, Error Rate and Cache Hit Rate over a period, with an Event Log. Platform Alerts lists firing alerts and SLO coverage, saying unmeasured rather than all clear when it cannot read them. Analytics breaks usage down by Cost, LLM Usage, Agents, Tools, Guardrails and Agent Steps.
Verify
Budgets lists your alert with its threshold and warning level, a new policy reads Active without Saved but not enforced, one guardrail profile is marked Default, and Audit Log shows your own changes under Admin actions.
Troubleshooting
- Audit log unavailable: no audit source could be read; check the source errors above the table and open Diagnostics. You don't have access to the audit log means you need the Auditor grant or an admin role.
- Analytics unavailable on the Policies Analytics tab: the governance analytics source did not answer, so nothing there is measured.
- Spend tracking degraded: the enforcing gateway is unreachable or has no counter for a budget yet; caps may or may not be holding.
- Failed to load policies: select Retry; if it persists, ask your platform operator to check the governance service.
Go deeper
The Control Room pages behind this journey, each with every field, state and message: