From Notebook to Kubeflow pipeline using Katonic Deployment Panel
1. Get Started
Jupyter Notebook is a very popular tool that data scientists use every day to write their ML code, experiments, and visualize the results. However, when it comes to converting a Notebook to a pipeline, data scientists struggle a lot. It is a very challenging, time-consuming task, and most of the time it needs the cooperation of several different subject-matter experts: Data Scientists, Machine Learning Engineers, and Data Engineers.
This tutorial will guide you through a seamless workflow that enables data scientists to deploy a Jupyter Notebook as a Kubeflow pipeline with the click of a button without having to write a single line of code.
2. What you’ll learn
In this tutorial, you will build a complex, multi-step ML pipeline with Kubeflow Pipelines, without using any CLI commands or SDKs. You also won’t need to write any code for Pipeline components and Pipelines DSL, or build any Docker images. You don’t need to have any Kubernetes or Docker knowledge to complete this tutorial.
3. Platform Walkthrough
3.1 Sign In
Once the admin creates your ID in the respective cluster, you will get your username and temporary password over e-mail.
Open the login page,set your permanent password and login to try the Katonic platform.

Enter Email and Password and click on the “Sign In” button to sign in to the Katonic platform.
3.2 Orient yourself to the Katonic platform
When you first log in, you will find yourself in the Dashboard section of Katonic. You can use the left sidebar to navigate to other sections of Katonic Platform.
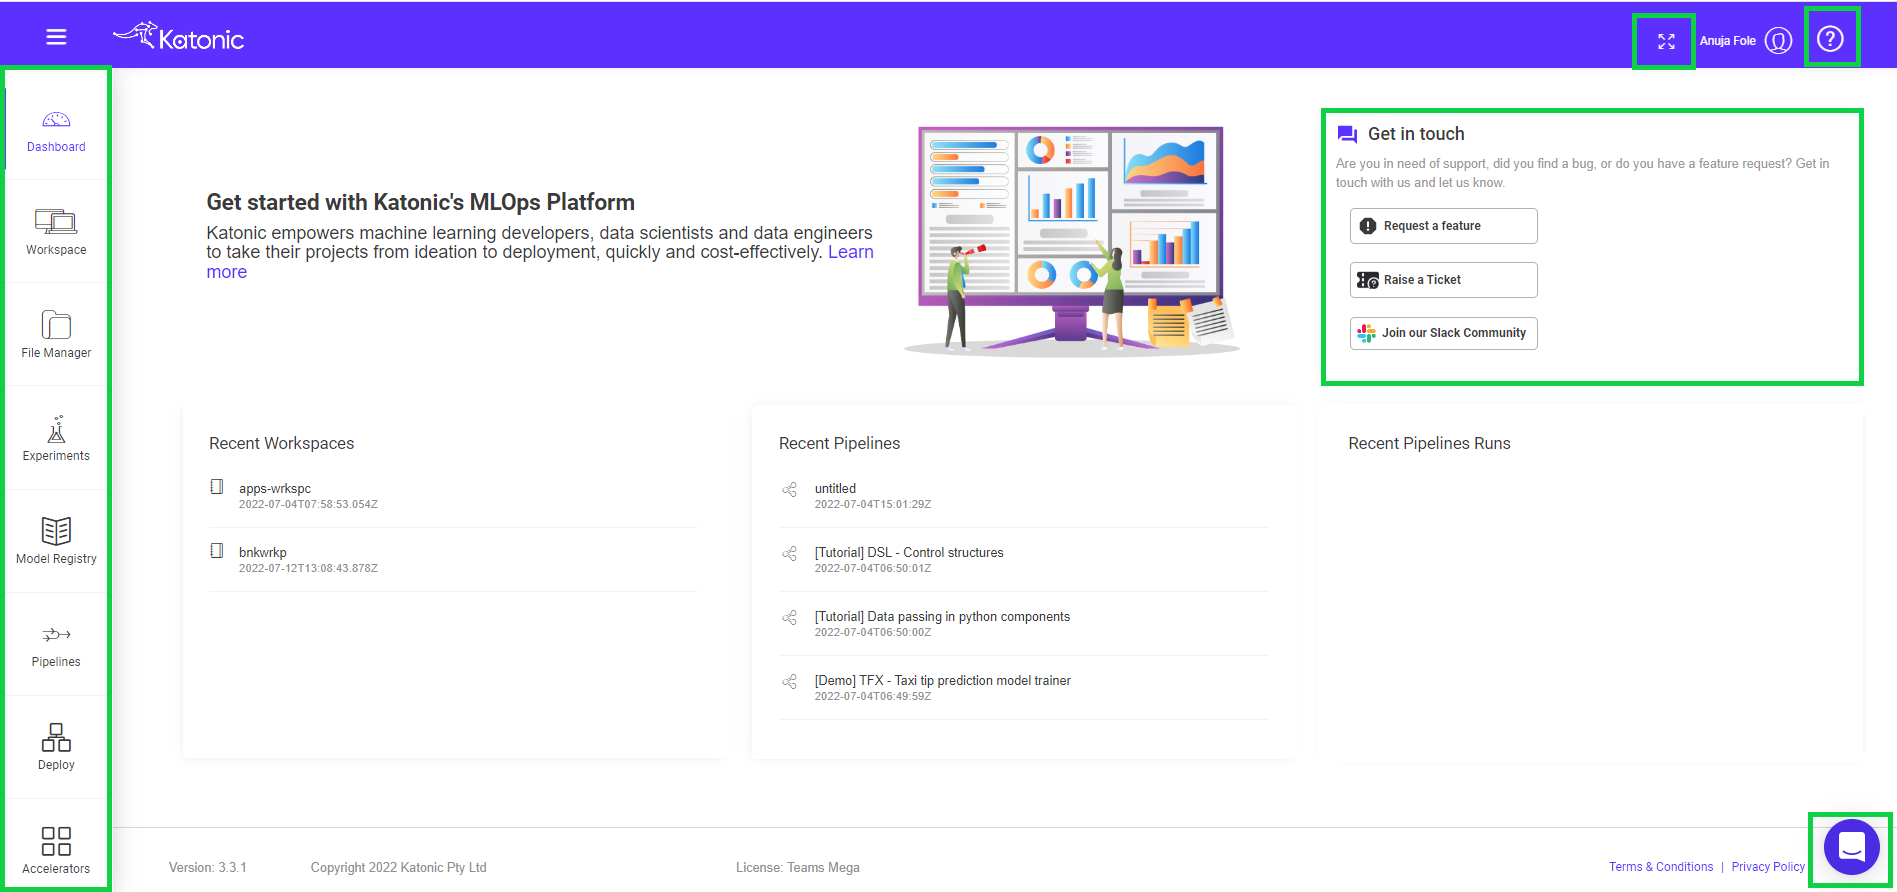
To view the platform in full screen click on the “full-screen mode“ on the top right of the page.
If you would like to search the Katonic documentation for help, click on the “?” icon on the top right of the page.
To send a question to a member of the Katonic support staff, use the Support button on the bottom right of the page.
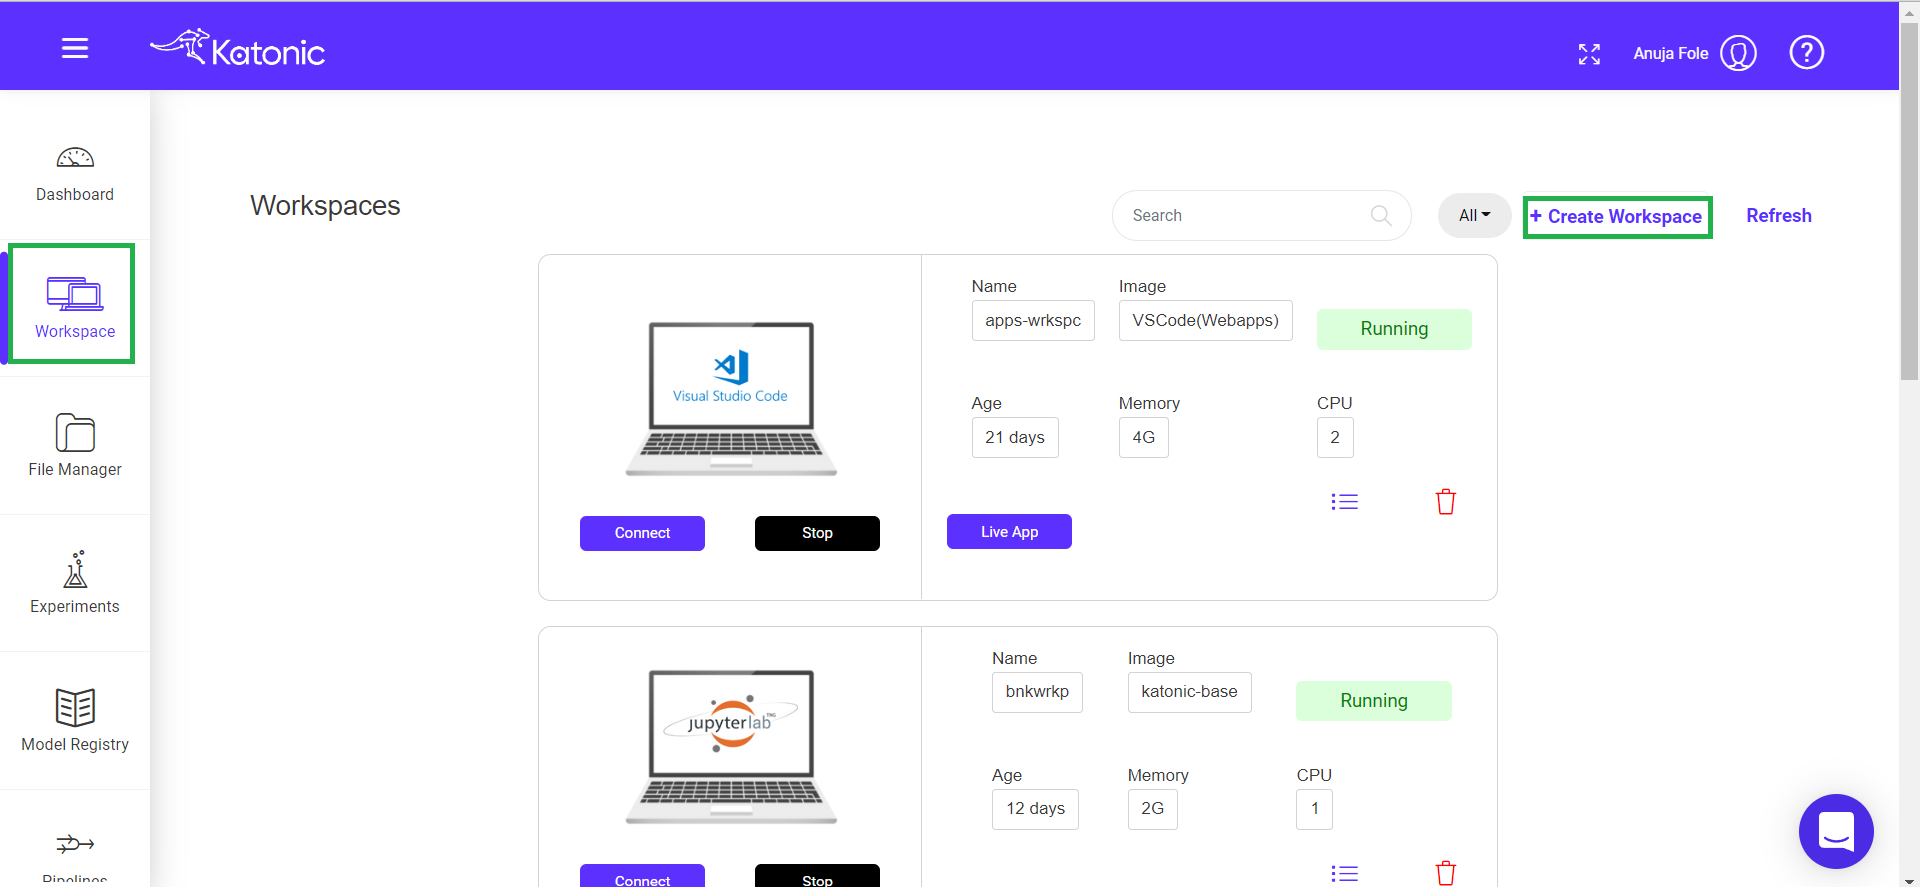
3.3 Create a Workspace
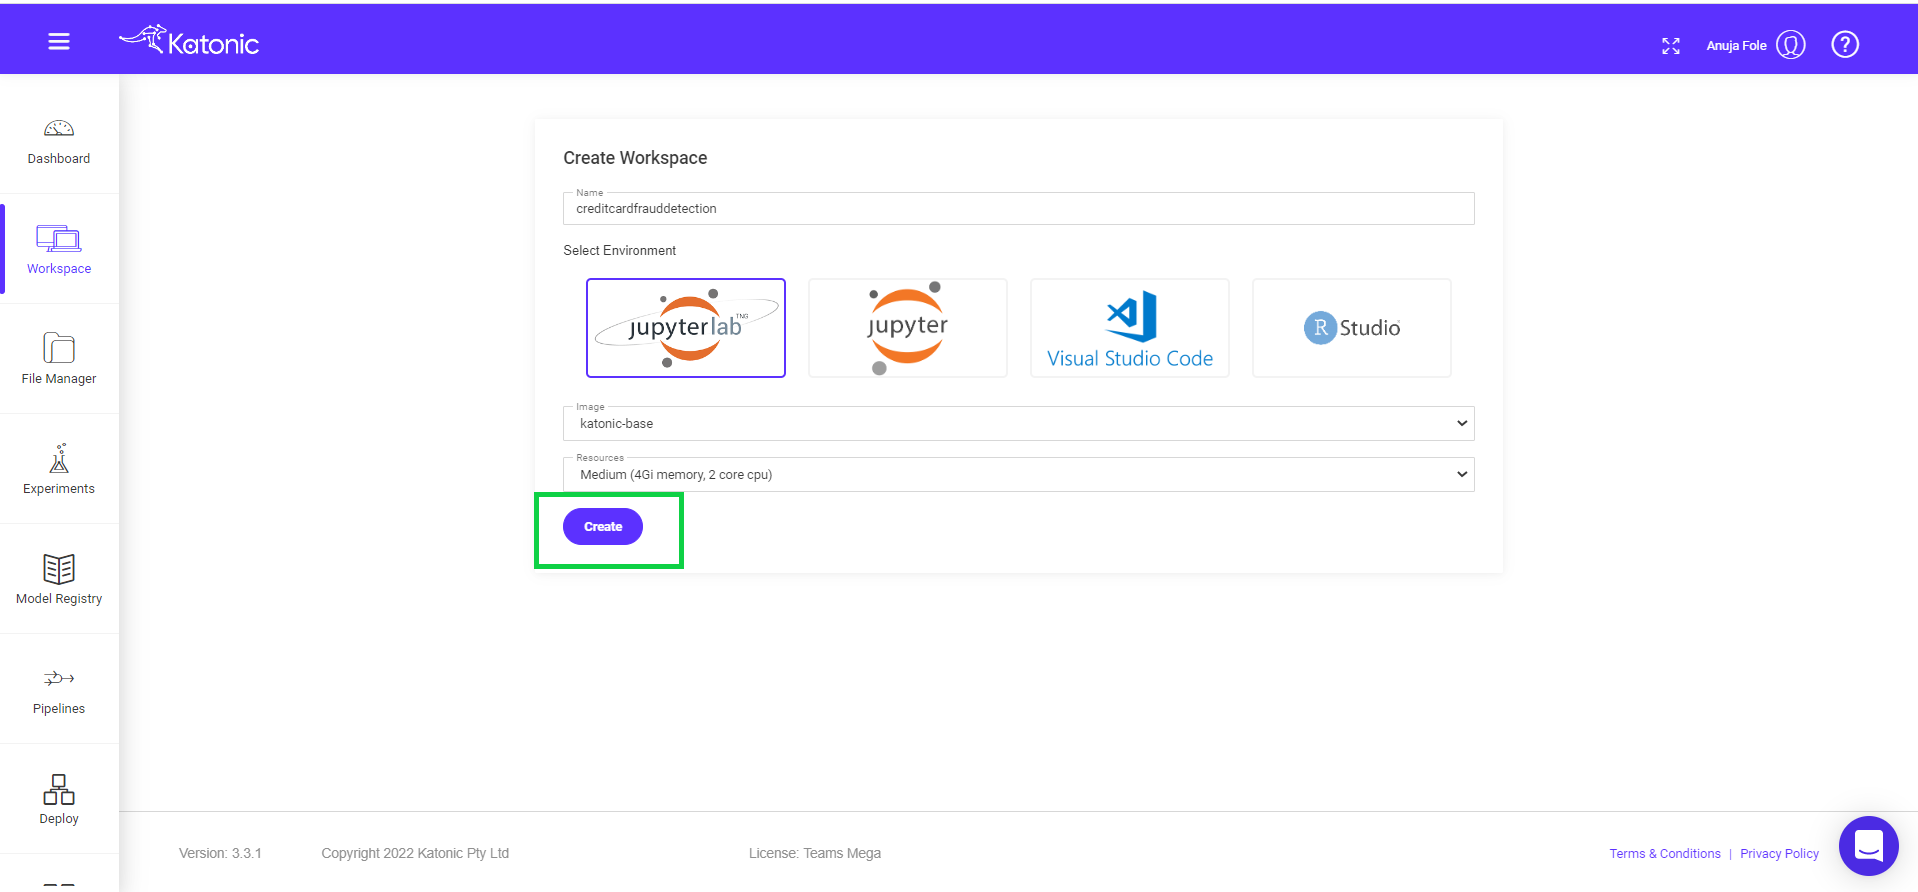
Click on Workspace from the left sidebar and create your workspace by clicking on ‘Create Workspace’ in the top right side of the page.
Fill in the following information
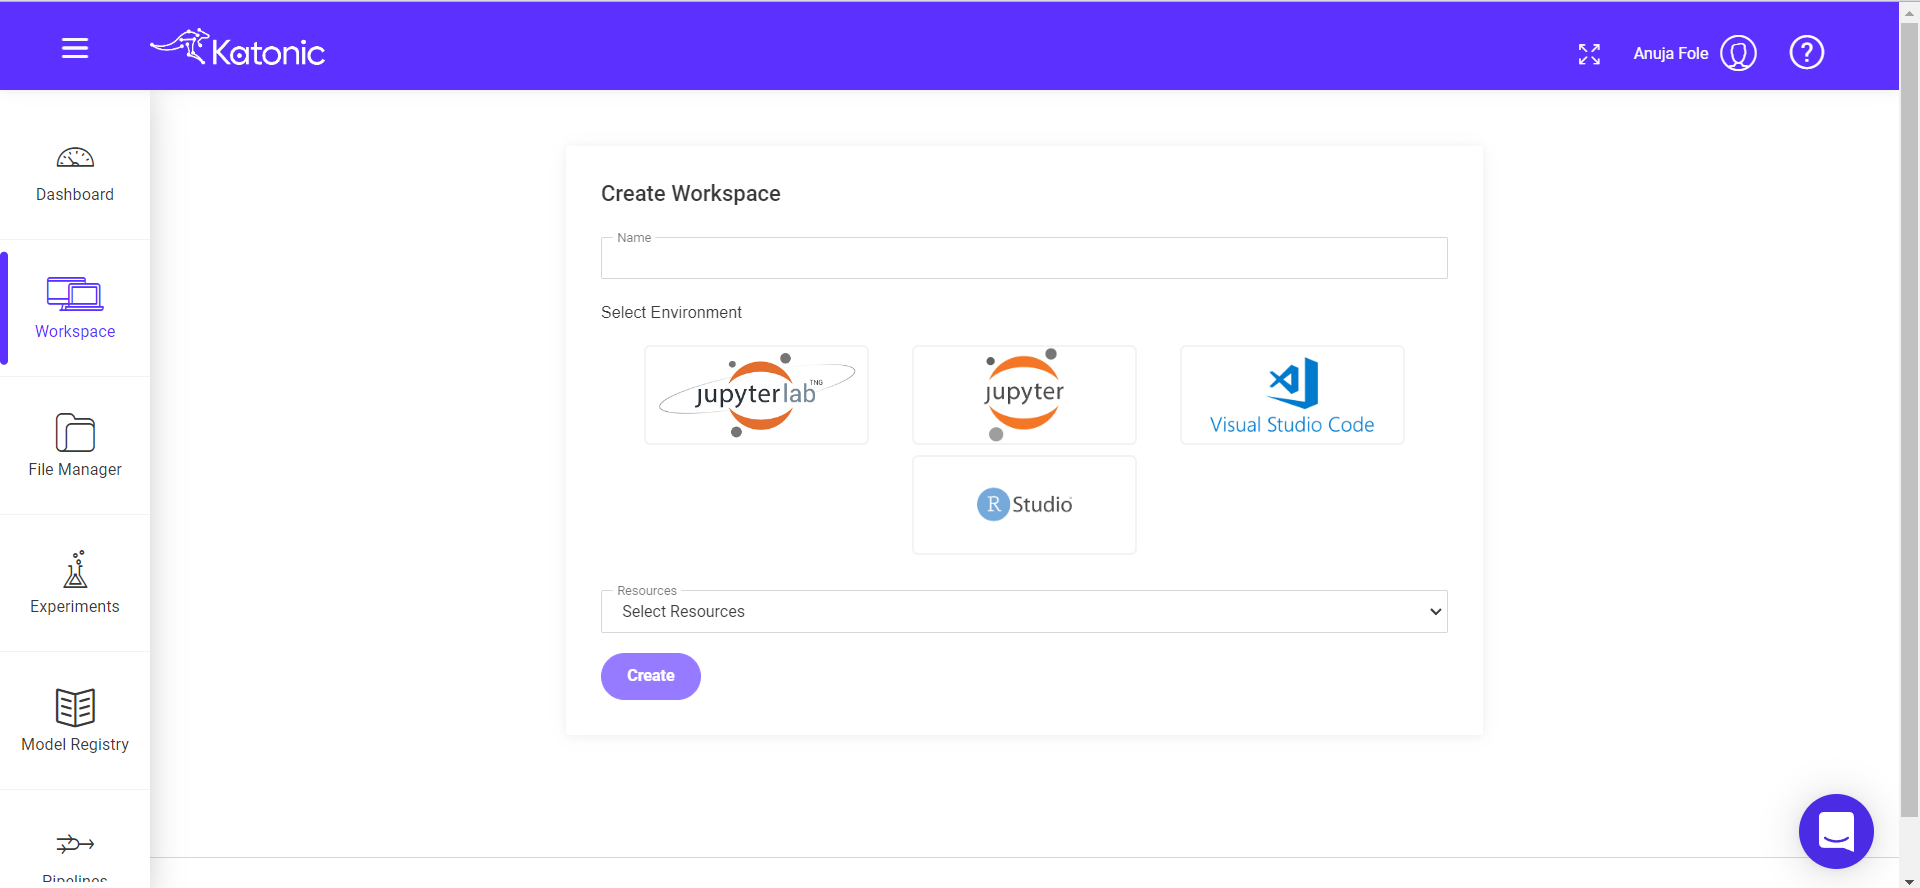
Give your Workspace an informative name (like credit-card-fraud_detection)
Note : Notebook name should contain only lowercase(a-z), numbers(0-9) and hyphen(-).
Select Environment as JupyterLab.
Select Image as katonic-base.
Select the Number of CPUs and the memory you want to allocate to Notebook.
Click on create button.
3.4 Start Workspace
Once you create a workspace you could see it will be in the processing stage.
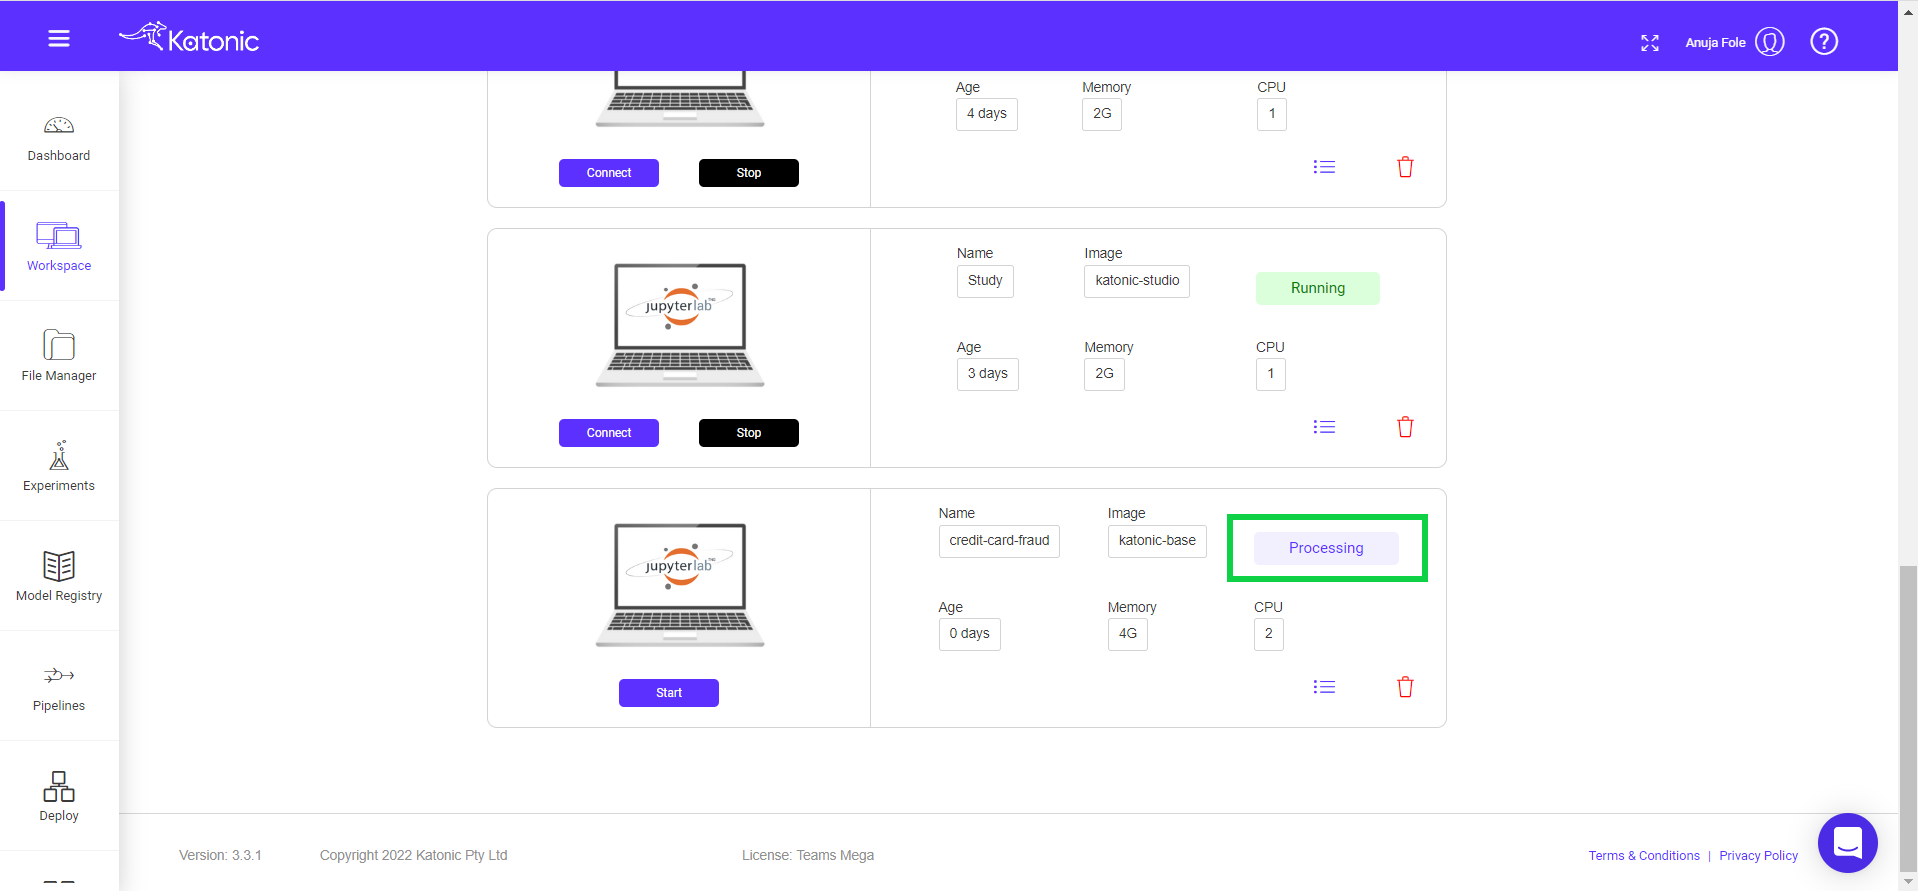
Once the workspace has started it will show the connect button with which you can connect to the notebook server. To stop or delete the workspace you can use the stop and delete buttons.
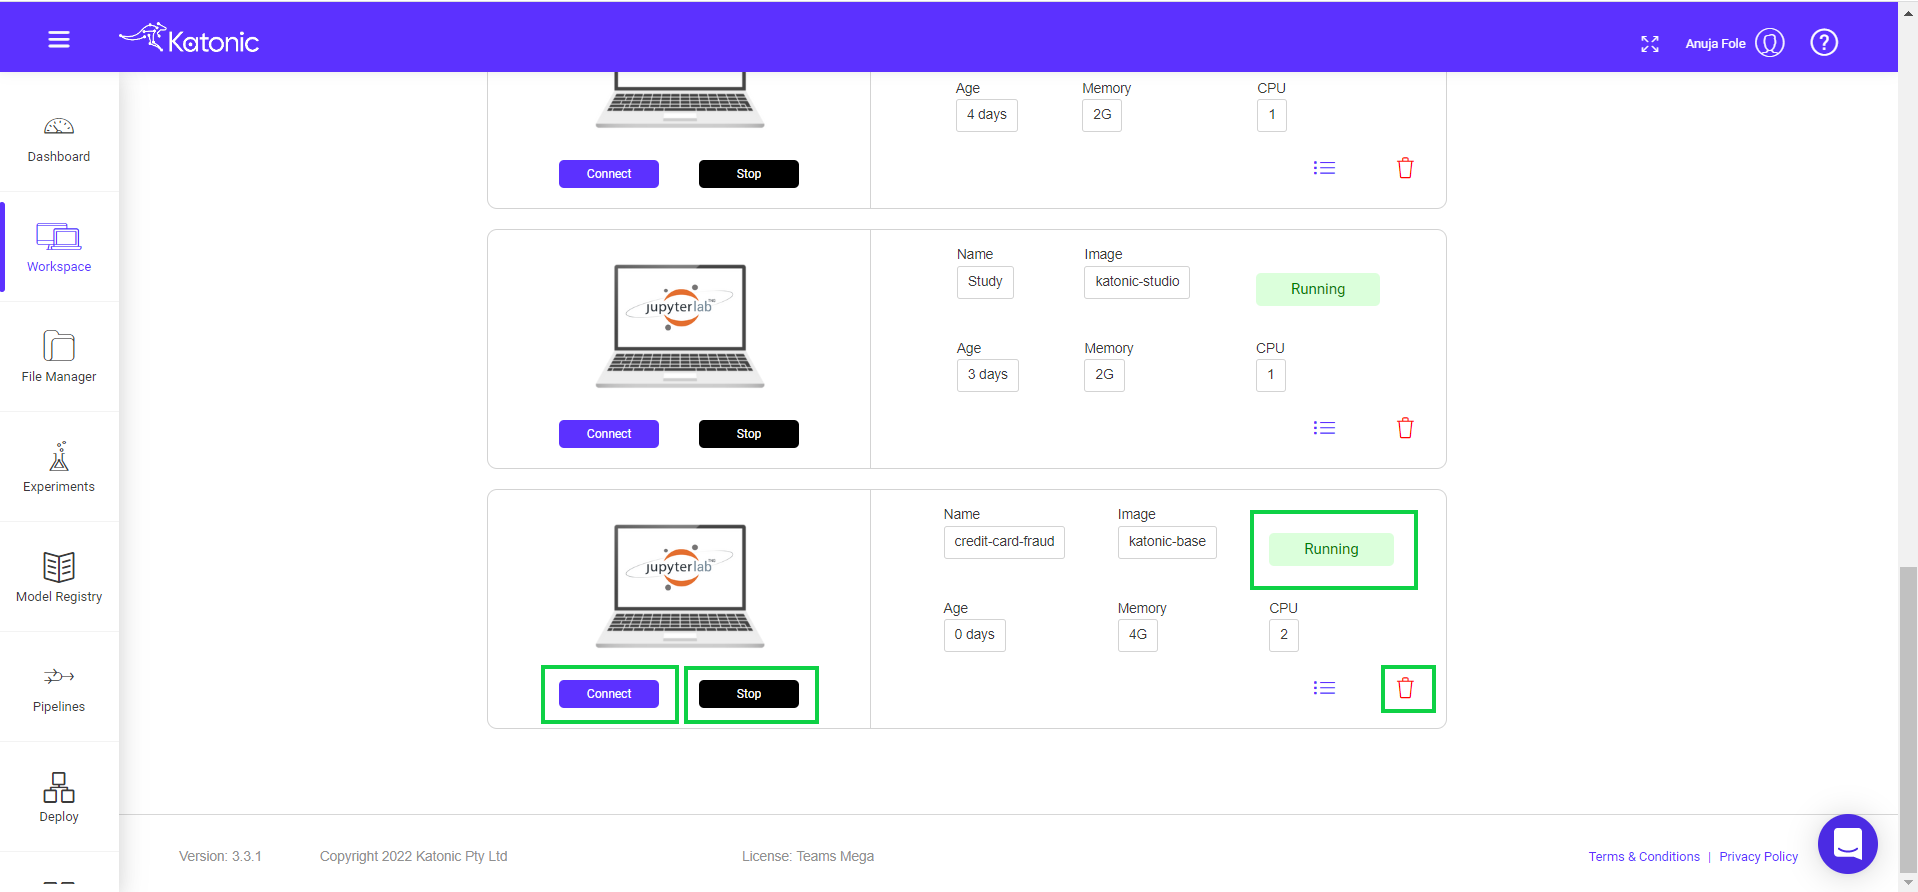
When you connect a workspace, a new session is created on a machine and your browser is automatically redirected to the notebook UI.
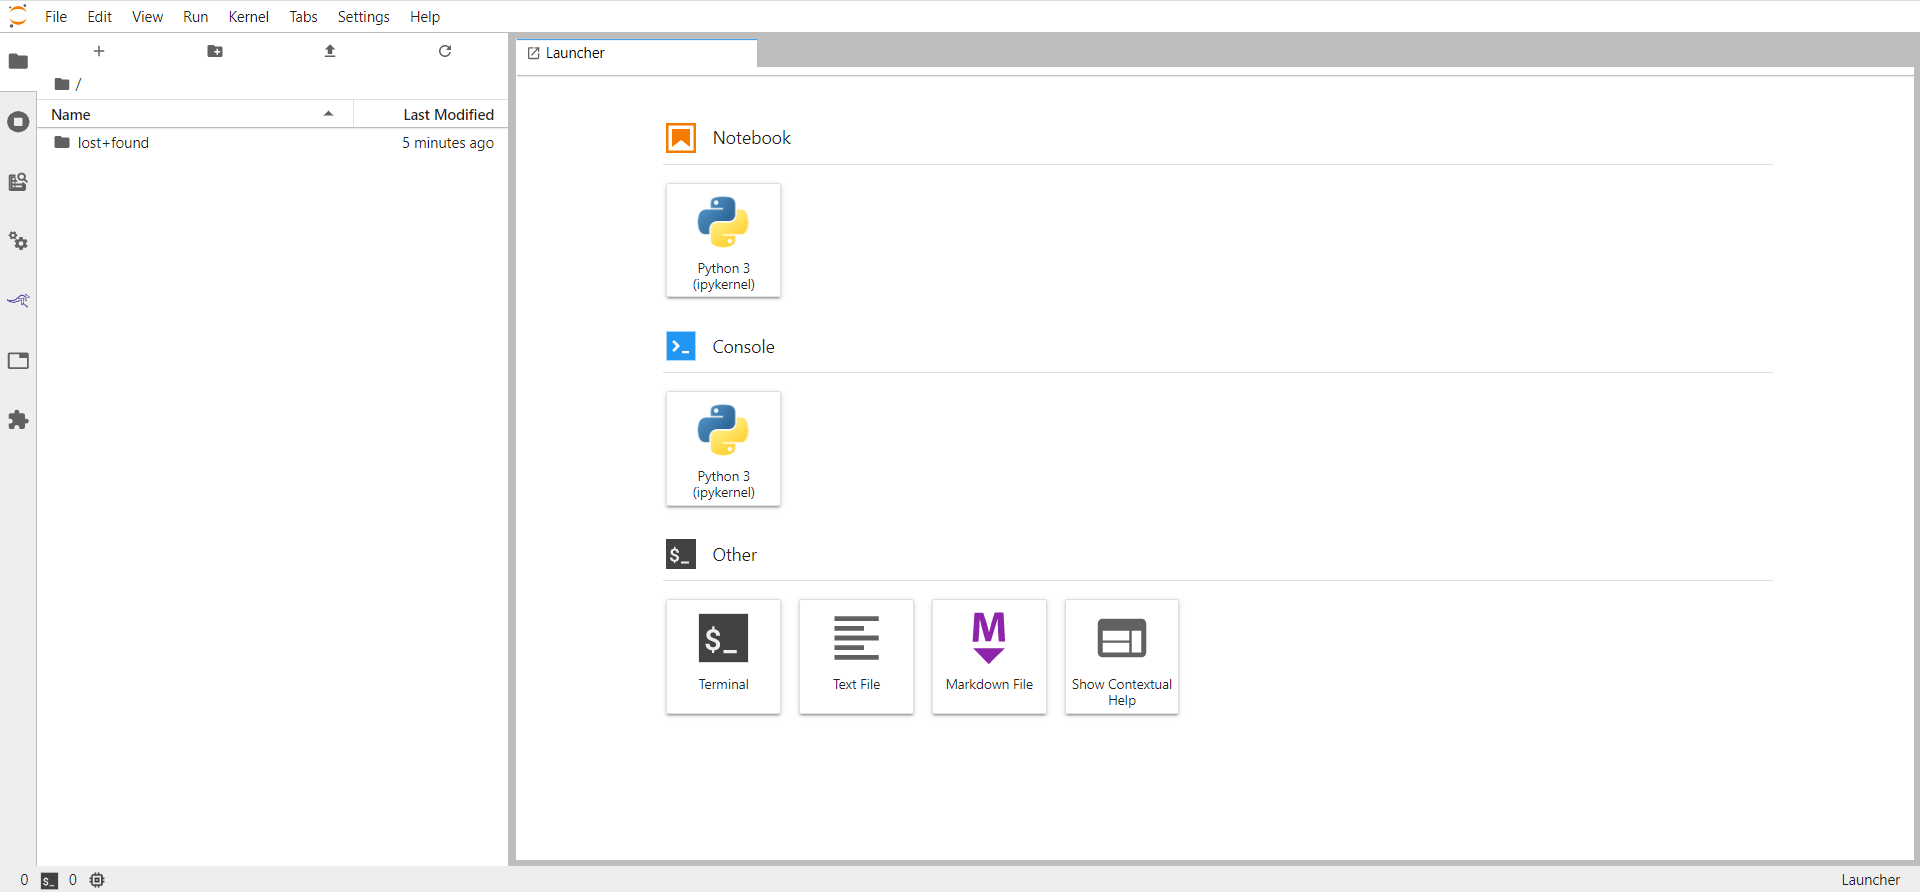
Once your notebook is up and running, you will see a fresh Jupyter interface.
Note: Once the workspace is launched you will be able to see the Examples folder available which has some pre-built use cases on the Katonic platform.
3.5 Get your Files and Data
Files and Data can be created in the same environment or can be cloned from GitHub. In this section, we will be showing you how can you clone data and files from our open-source examples available on GitHub.
Click here for the Katonic use cases repository
Click on the “Terminal” icon in the Launcher tab.
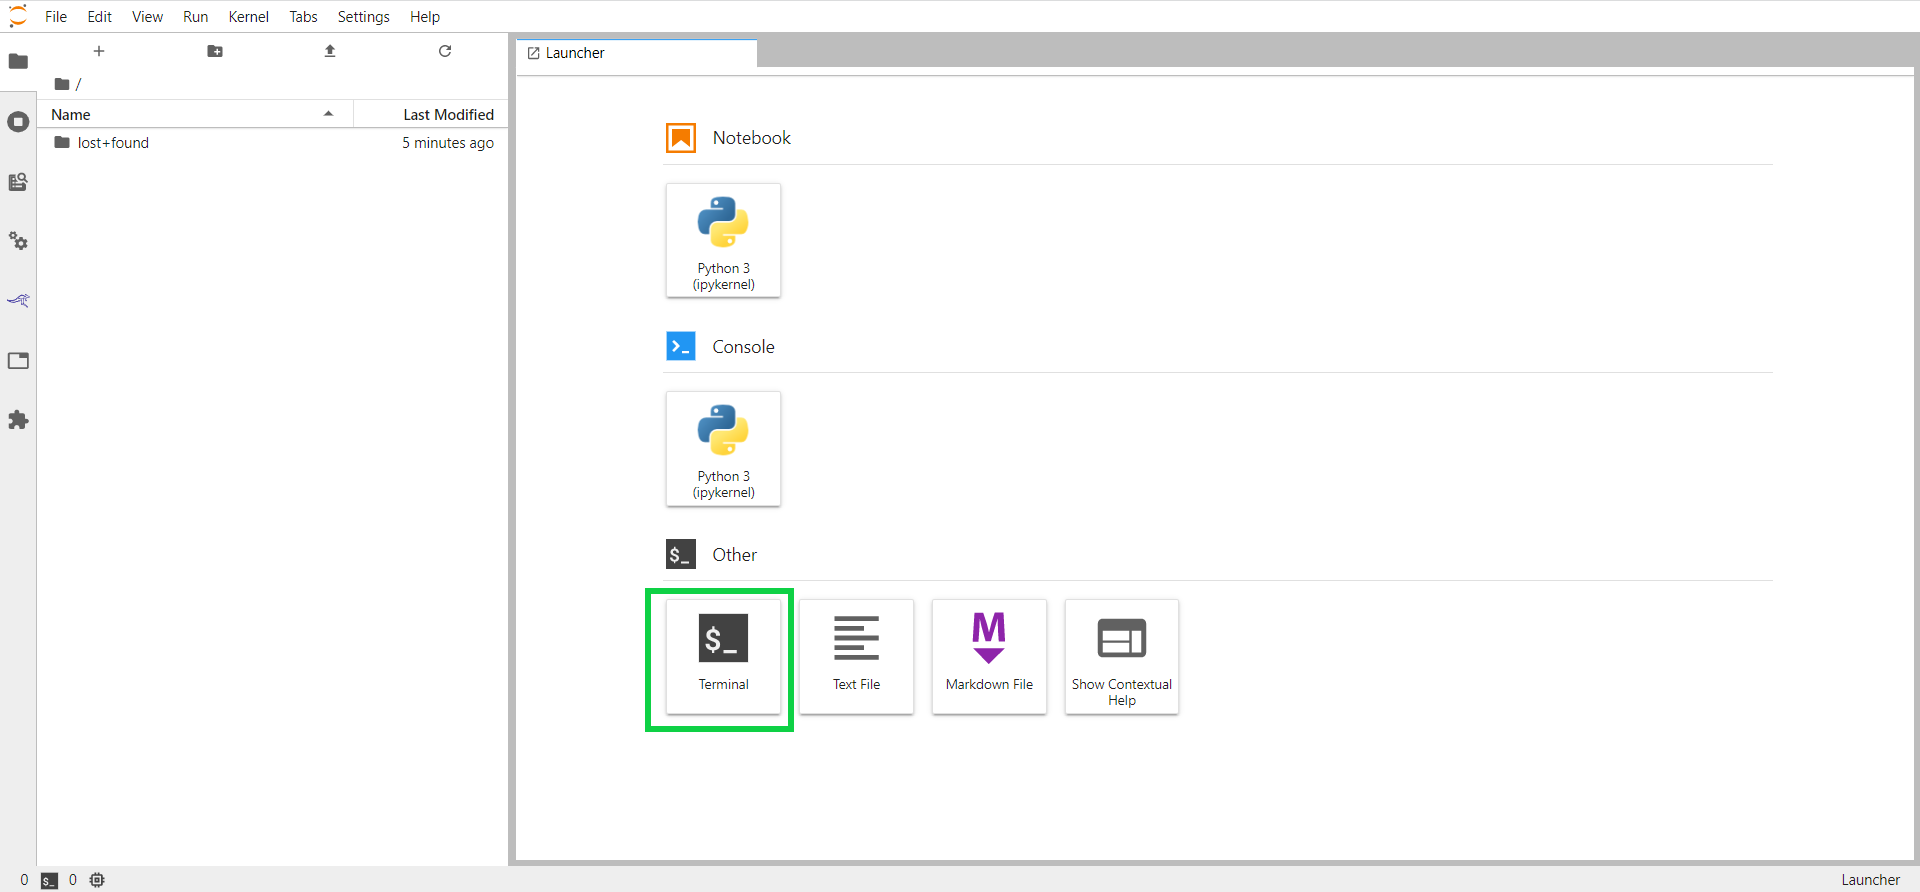
Type “bash” in the prompt. It will start the bash command.
Enter all the below commands one after the other to clone the repository.
apt install git
git clone https://github.com/katonic-dev/Examples.git
cd Examples
git checkoutThis process will clone the whole repo into the workspace.
Now you will be able to see the Examples folder in the File Browser.
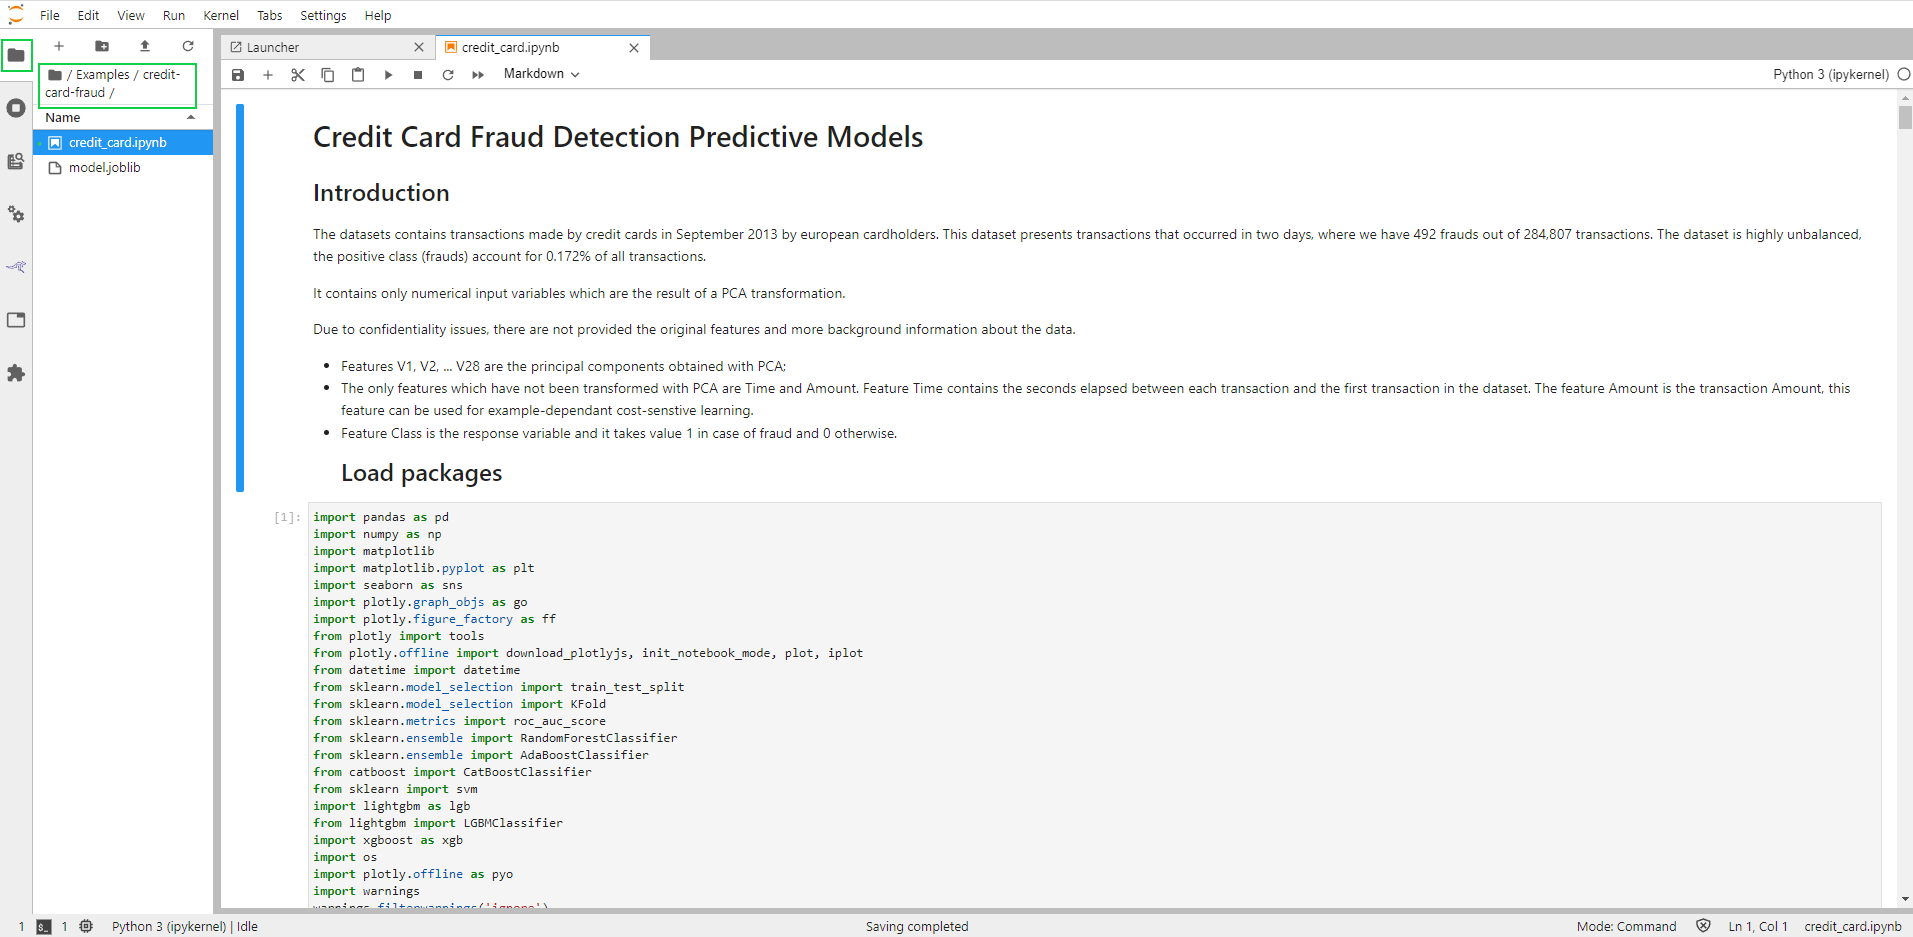
Click on “File Browser” in the left bar.
Open file “/Examples/credit-card-fraud/credit_card.ipynb”.
3.6 Store and Retrieve data using filemanager
You can use Runtime panel to connect to any of the buckets available in Katonic File Manager to store, access and update your data within the file manager while your pipeline is running. Once your pipeline has run successfully, you would be able to see all the logs for every components within the respective folder of the recent run.
3.7 Creating pipeline
A pipeline comprises one or more nodes that are (in many cases) connected to define execution dependencies. Each node is implemented by a component and typically performs only a single task, such as loading data, processing data, training a model, predicting, or sending an alert.
When you open “/Examples/credit-card-fraud/credit_card.ipynb” file will show you the pre-build notebook as below.
3.7.1 Create pipeline steps
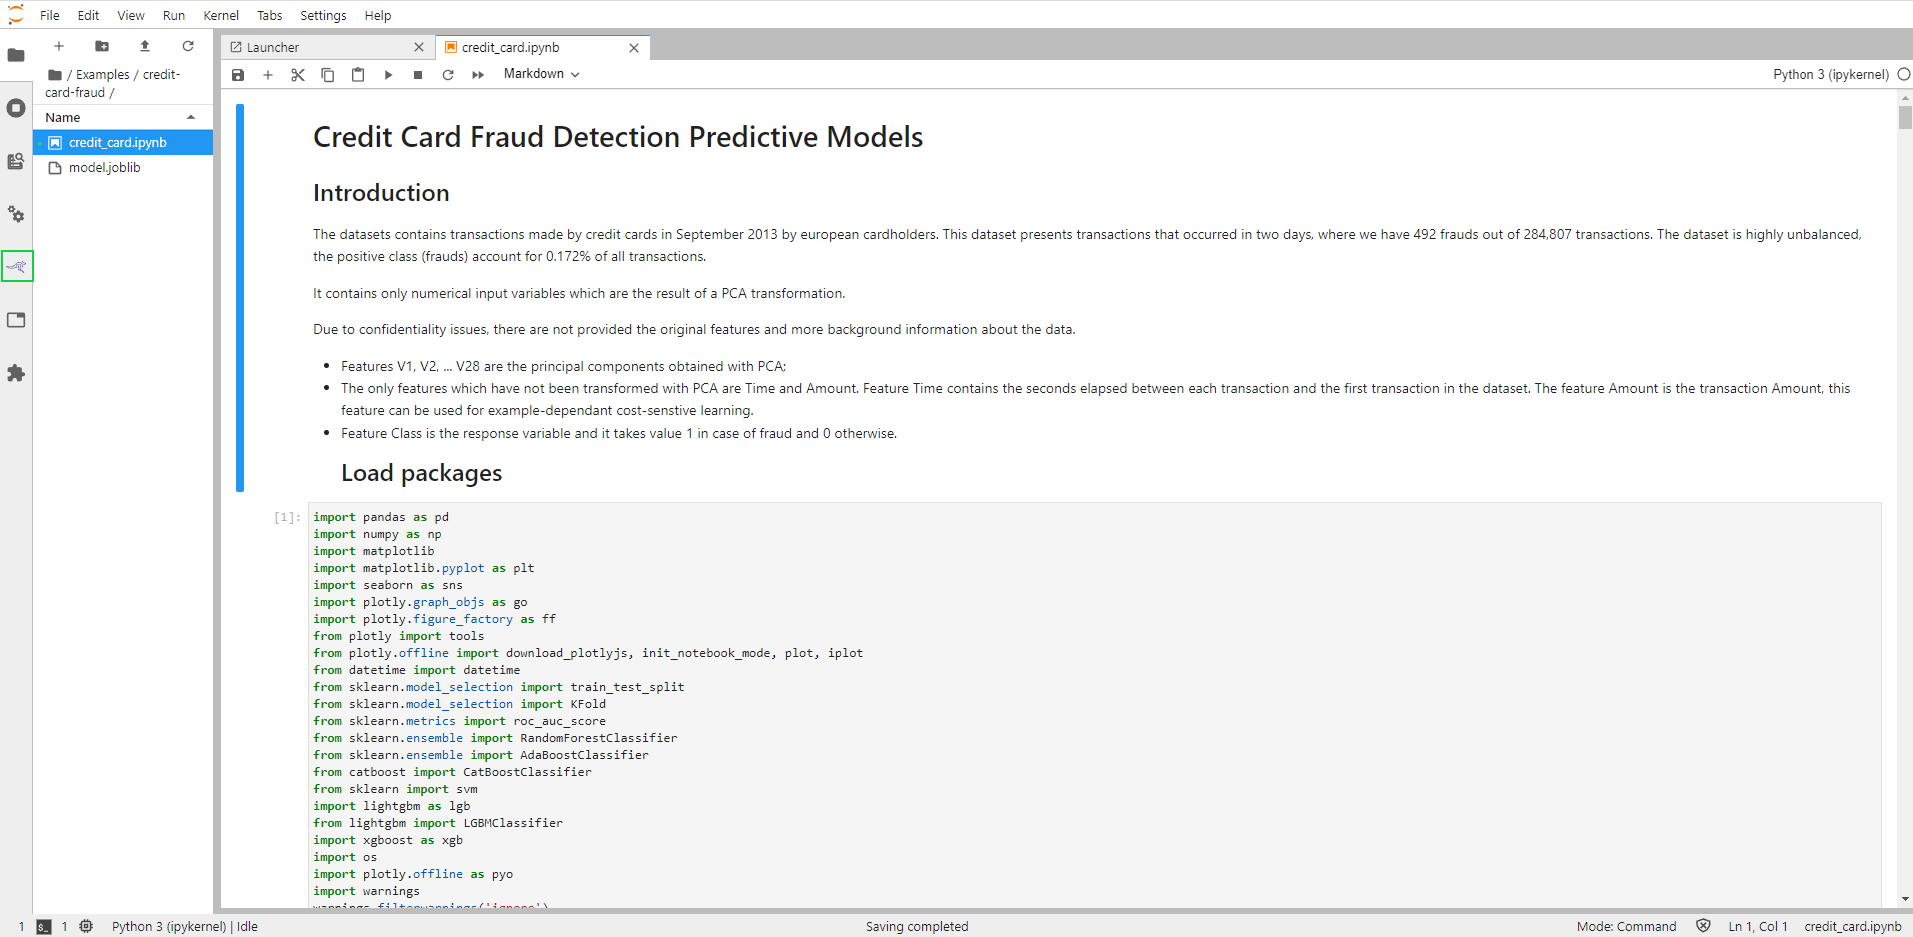
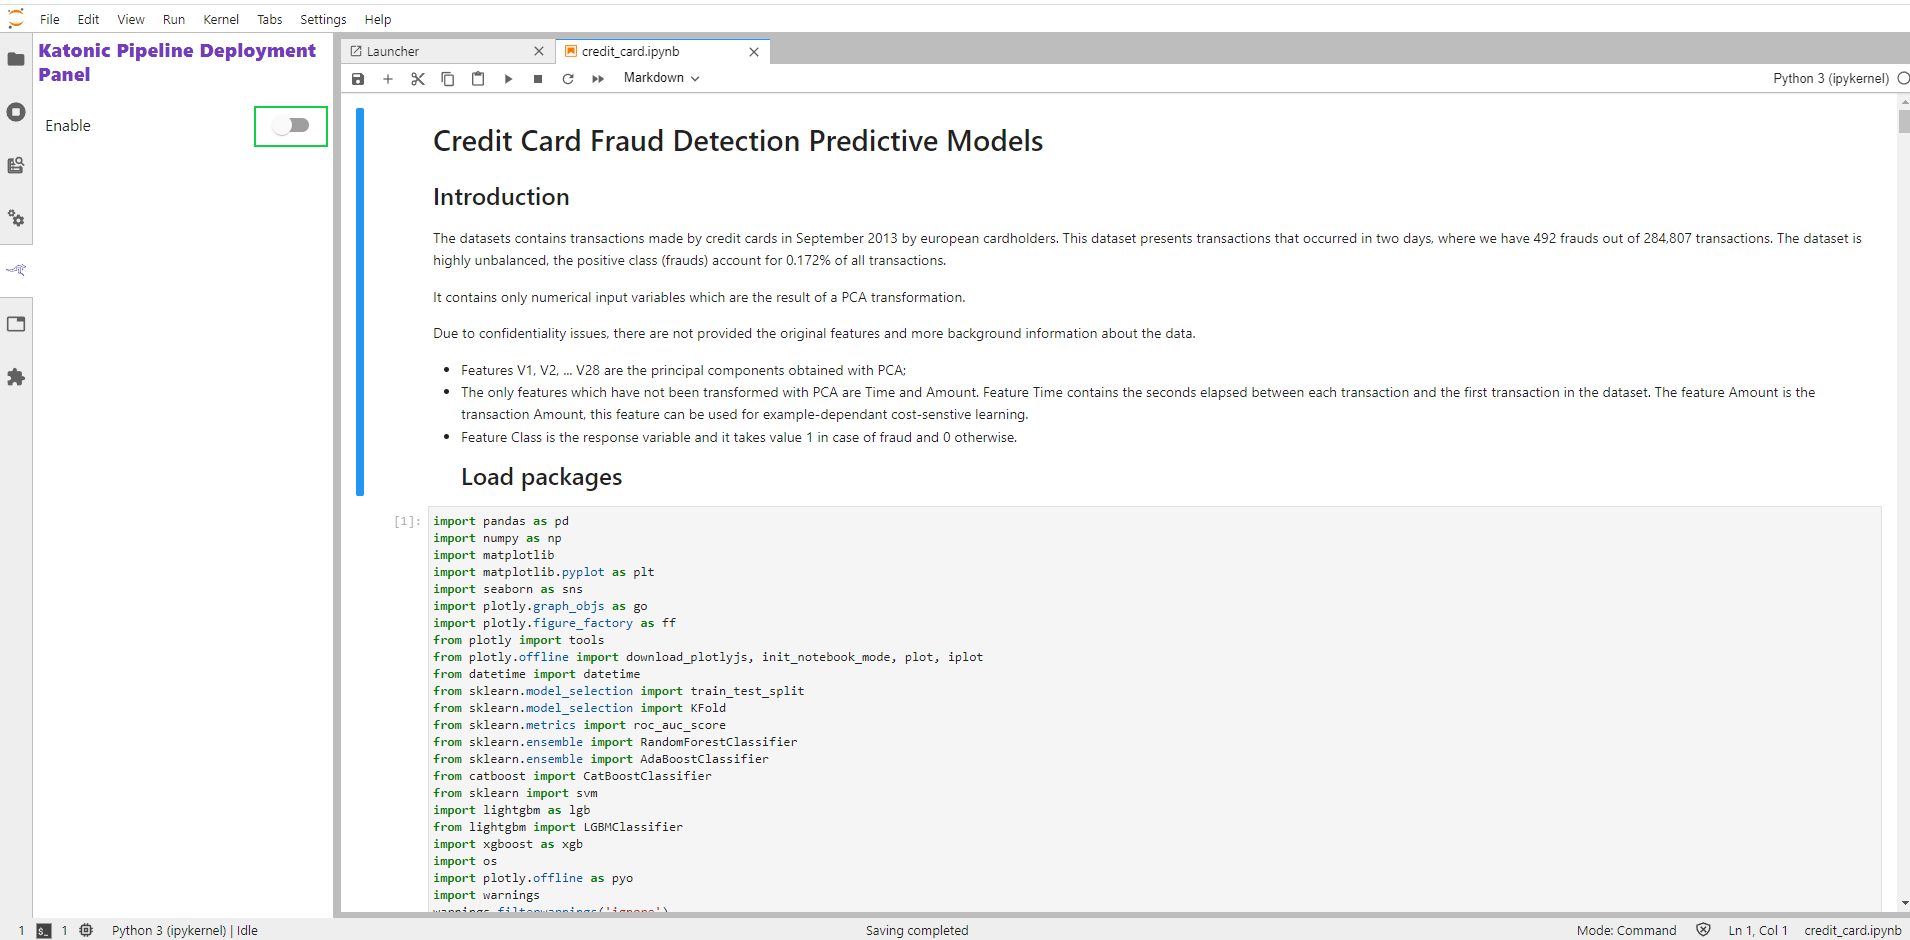
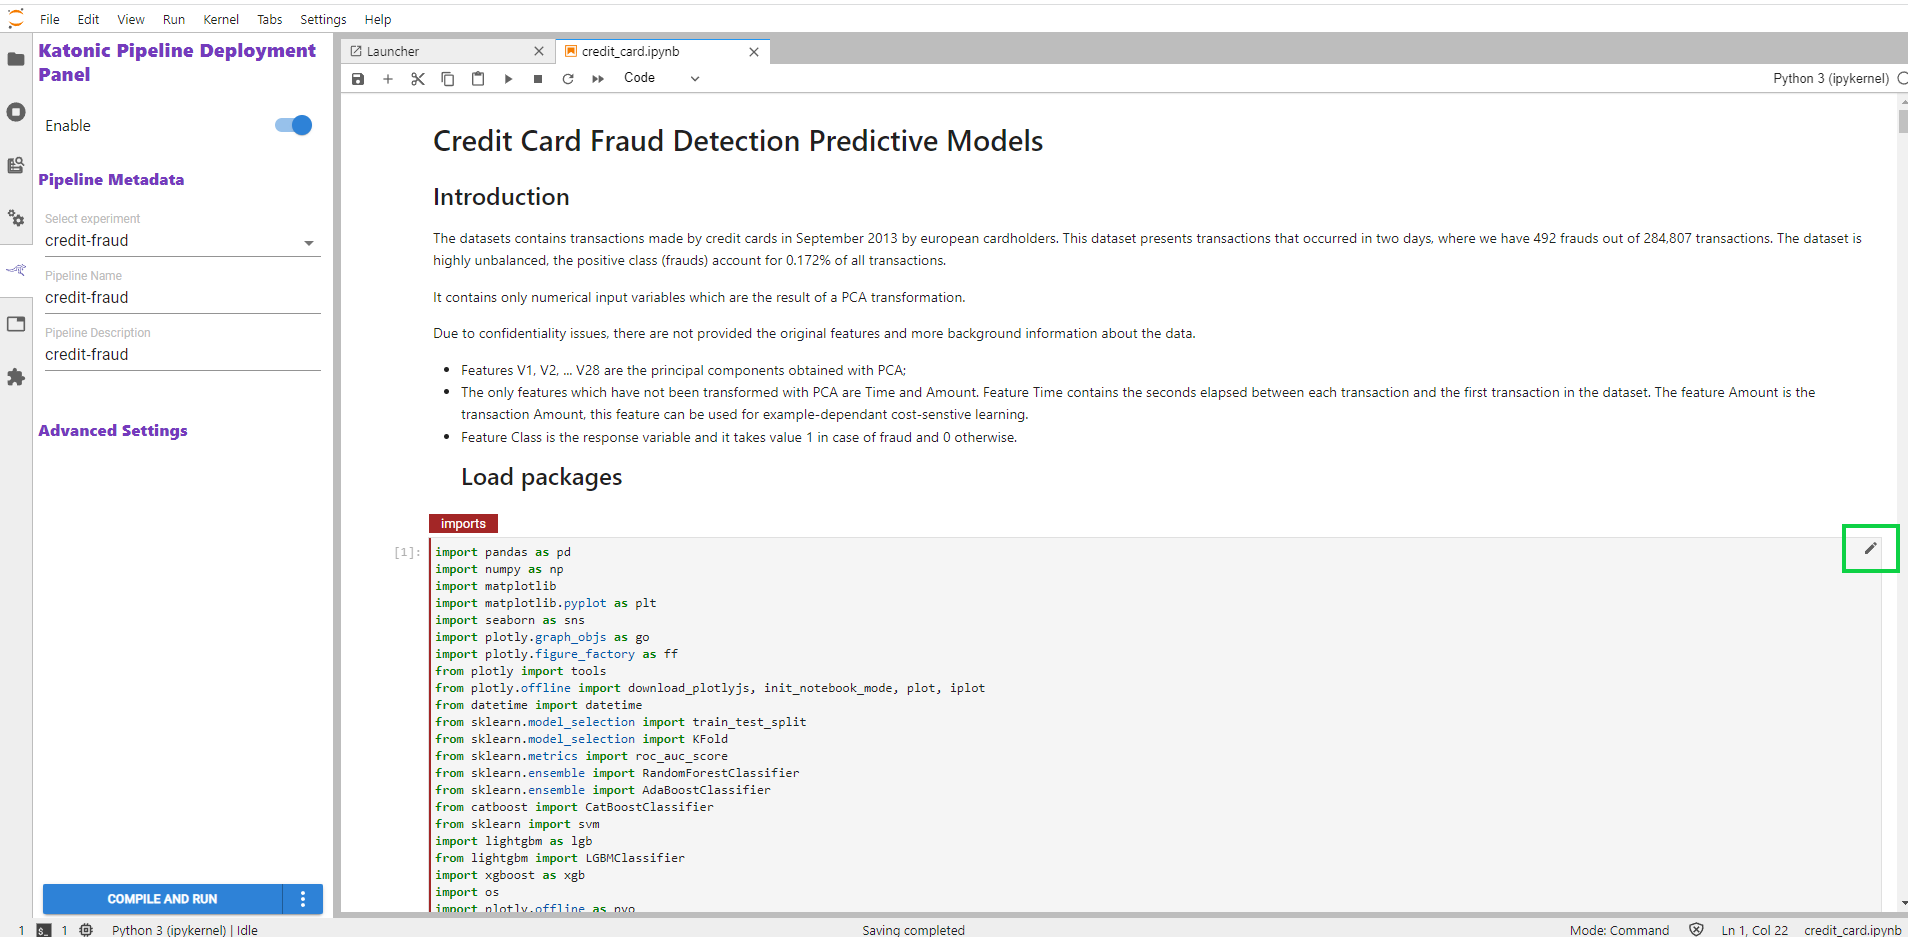
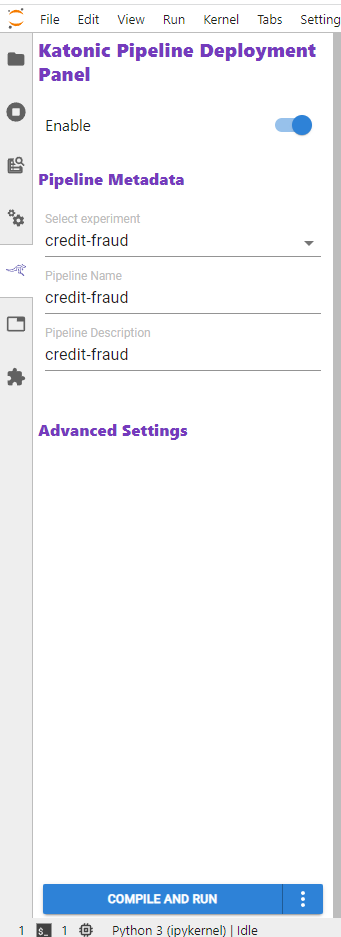
Enable Katonic Deployment Pipeline Deployment by clicking on the Katonic Pipeline Deployment Panel icon in the left pane of the notebook:
Enable Katonic Pipeline Deployment by clicking on the slider in the Katonic Pipeline Deployment Panel:
Click on the edit button in a cell available on the right side of the cell.
Now you will be able to see multiple options to create a step.
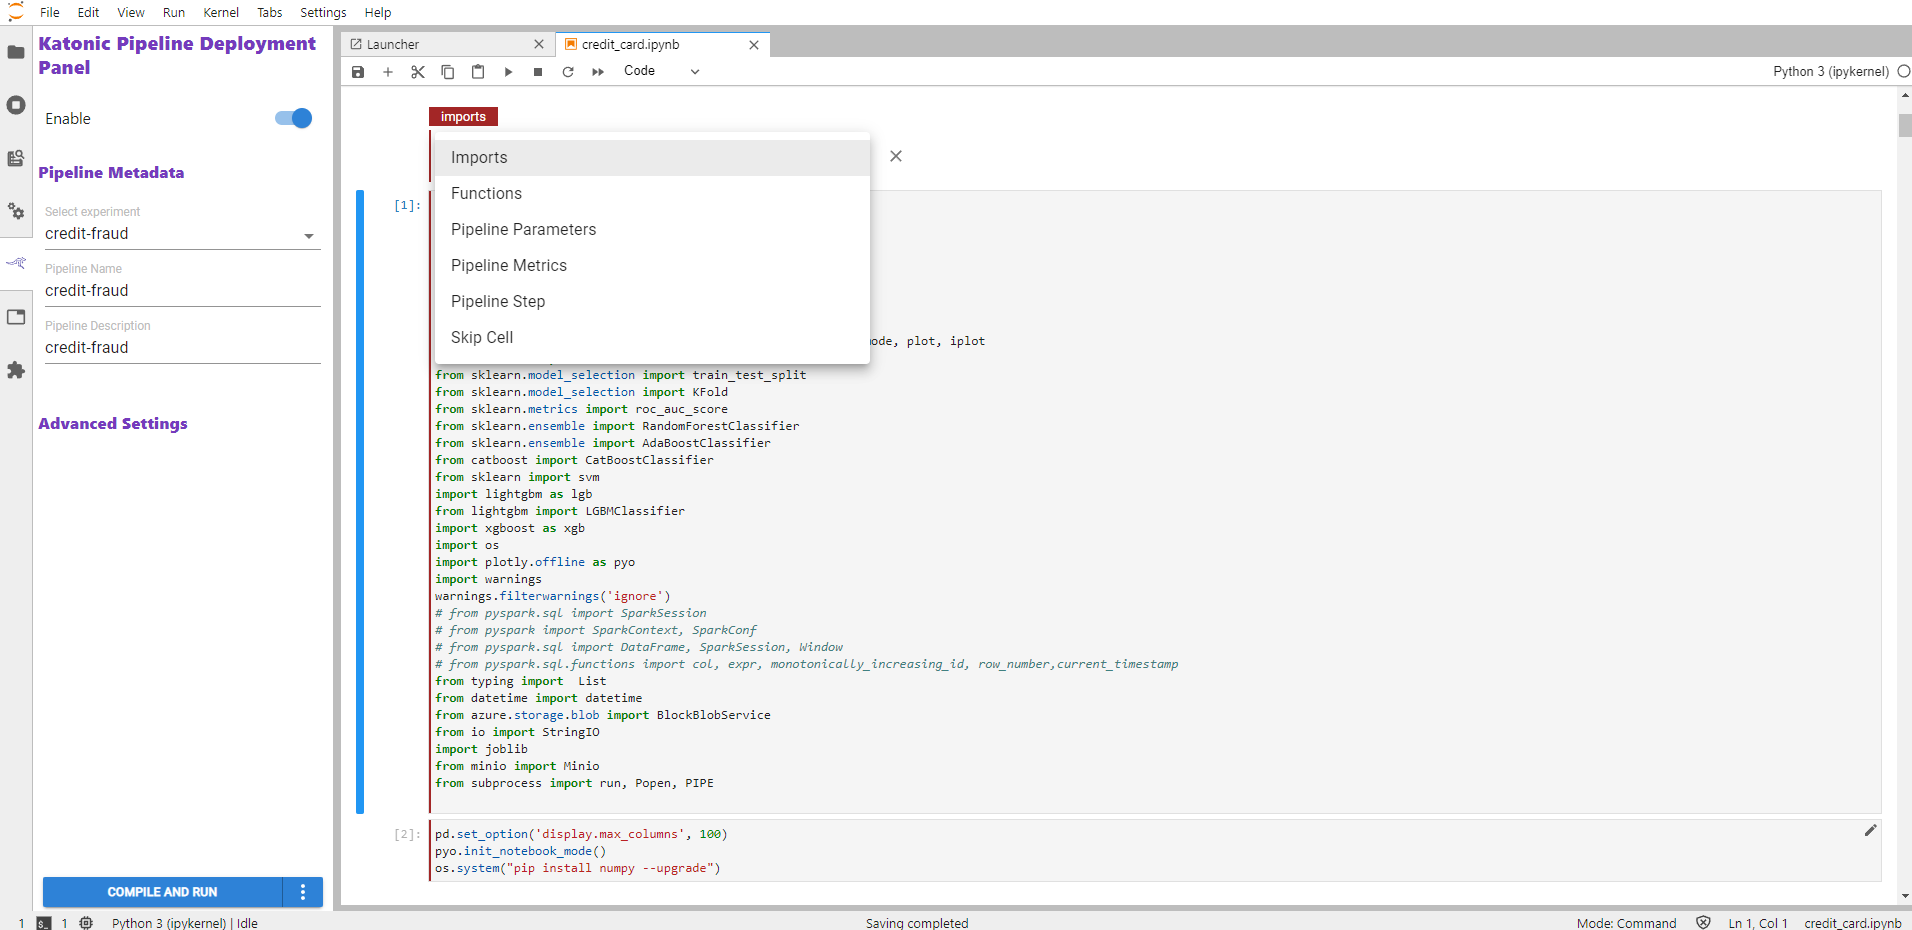
Import: Used to make a step for import statements. Functions: Used to tag all functions into one step. Pipeline Parameters: When you want to pass any parameter at run time can use this step. Pipeline Step: Used to create pipeline steps. Skip Cells: Used when you want to skip any cell from running.
Pipeline Step name must consist of lower case alphanumeric characters or '_', and cannot start with a digit.
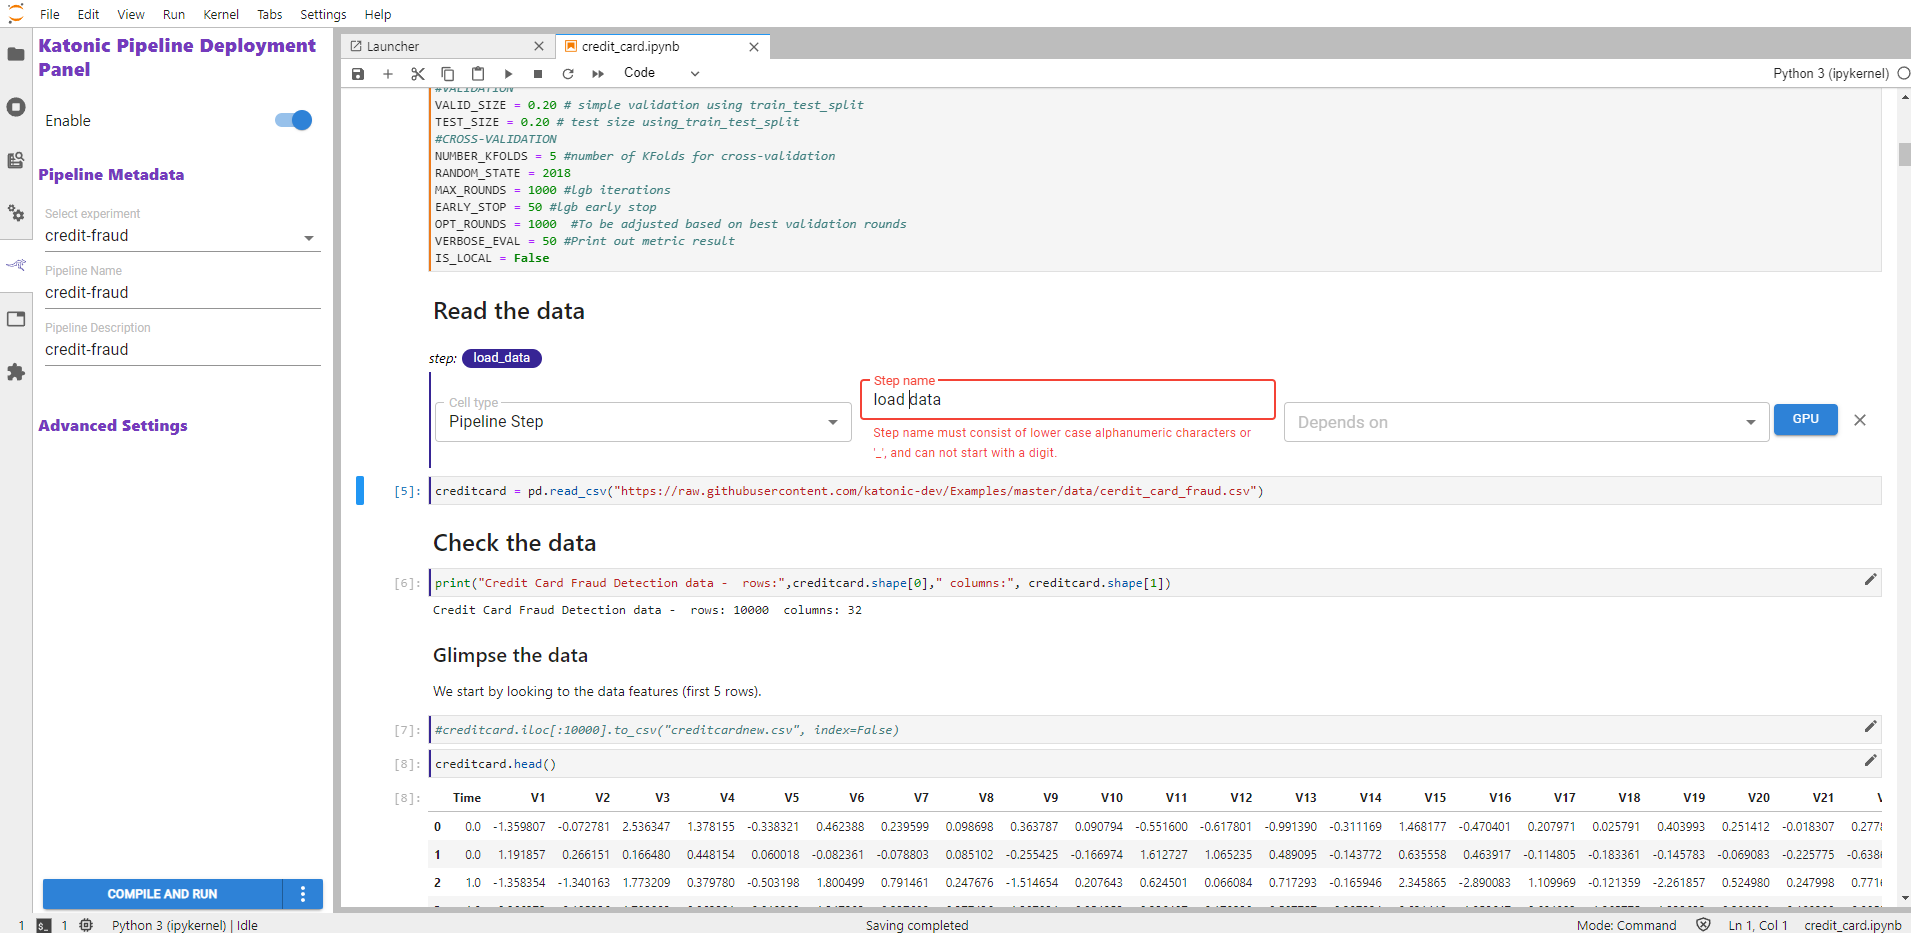
Add dependency of the previous step in the present step to maintain the order of execution and hierarchy.
Note: Single-step can contain multiple dependencies.
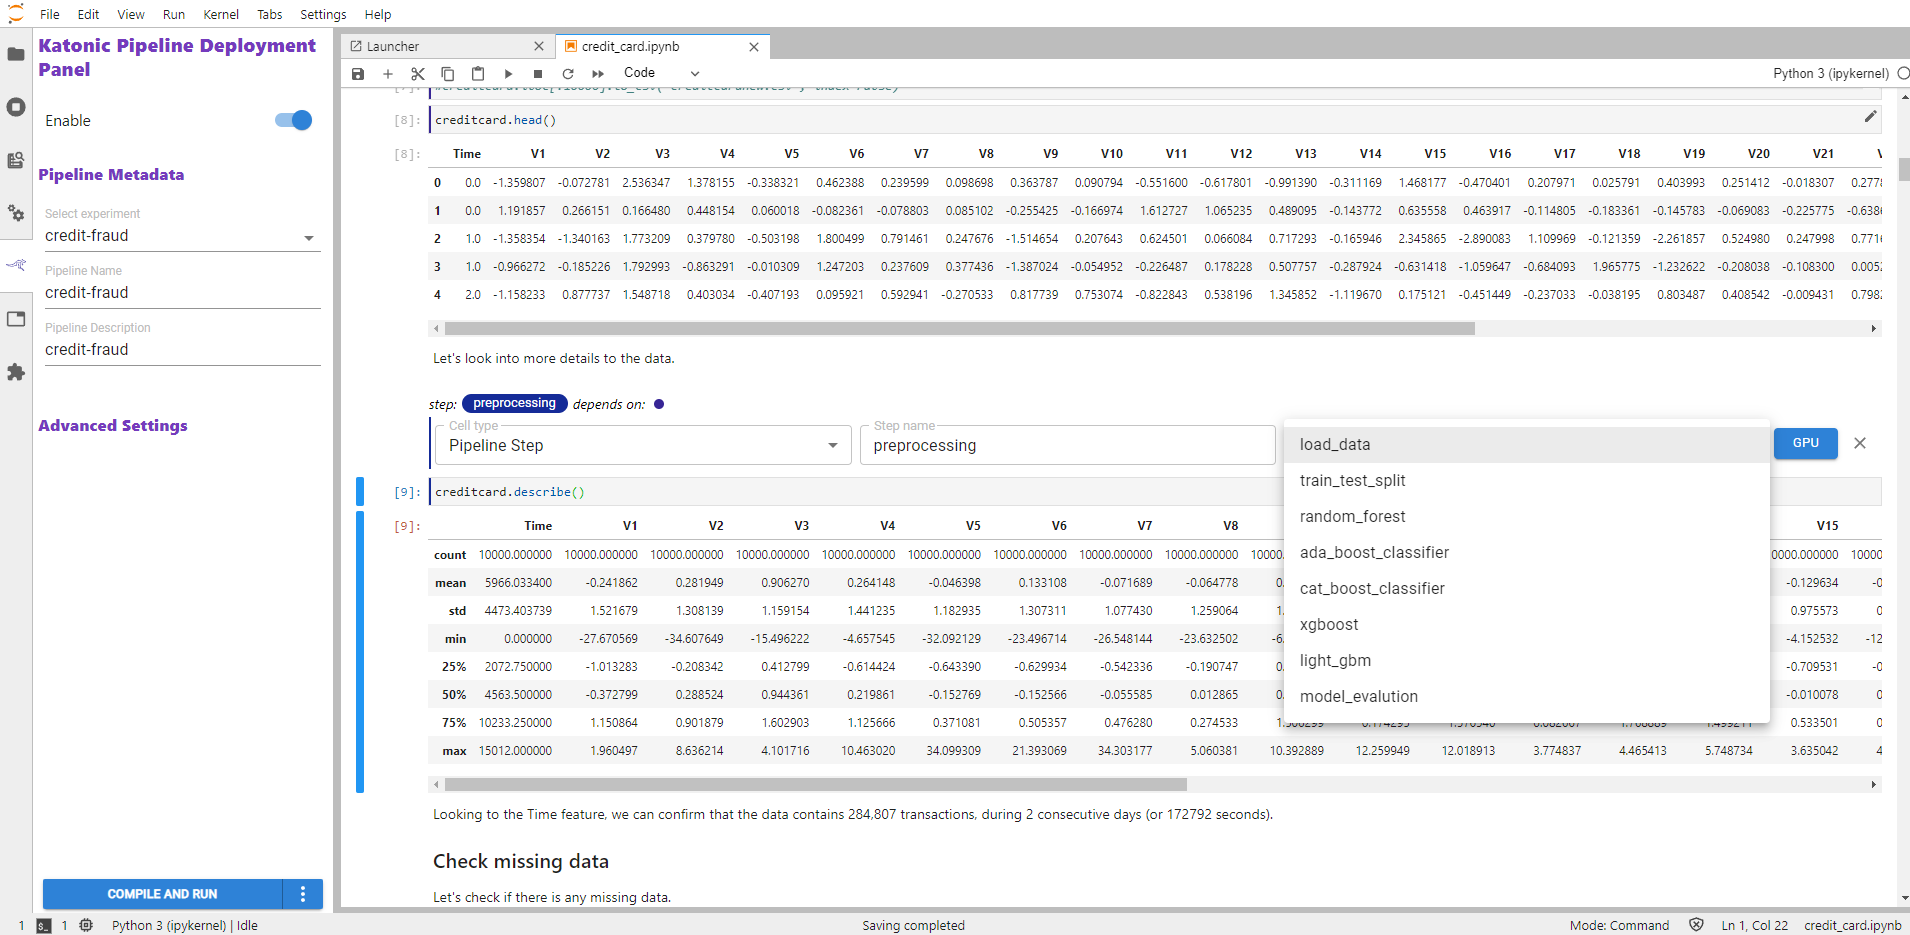
Explore the per-cell dependencies within the notebook. See how multiple notebook cells can be part of a single pipeline step, as indicated by color bars on the left of the cells, and how a pipeline step may depend on previous ones, as indicated by depends on labels above the cells. For example, the image below shows multiple cells that are part of the same pipeline step. They have the same magenta color and they depend on a previous pipeline step named "load_data".
3.8 Run Pipeline
In the previous section, we have seen how the steps are created to run the pipeline. In this section, you will learn how to run a pipeline in the Kubeflow environment.
To run the pipeline fill all the parameters on the left sidebar.
Select Experiment: Select the same existing experiment or create a new experiment.
- Experiment Name: To give a new experiment name.
Pipeline Name: Name of the pipeline that you want to run in the experiment.
Pipeline Description: Description of the pipeline.
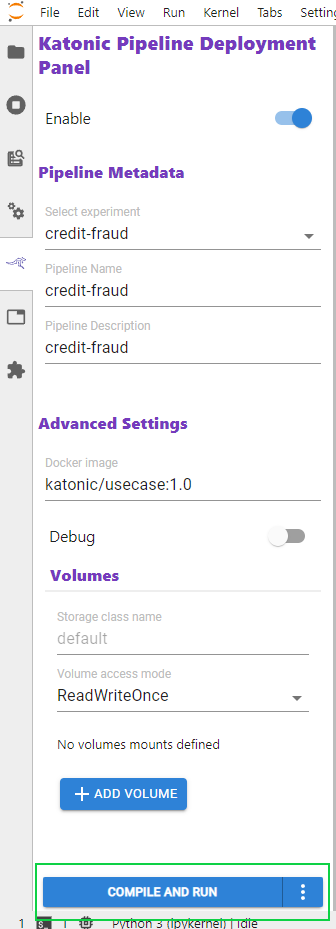
Click on Advance Settings, give Docker image as “katonic/usecase:1.0” and select volume access mode as “ReadWriteOnce”.
Note: If want to access the private or shared buckets of File Manager to store the logs of your pipeline, follow the below steps:
- Click on Add Volume.
- If Private Bucket is used:
- Storage Class Name :
kfs - Volume Access Mode :
ReadWriteOnce - Storage Volume Type :
Use Existing Volume - Mount Point :
/kfs_private - Use Exixting Volumn Name : User Volume Name of private storage, which can be found in File Manager Tab. Eg:
private-storage-XXXX
- Storage Class Name :
- If Shared-storage Bucket is used:
- Storage Class Name :
kfs - Volume Access Mode :
ReadWriteMany - Storage Volume Type :
Use Existing Volume - Mount Point :
\kfs_public - Use Exixting Volumn Name :
shared-storage
- Storage Class Name :
Click on COMPILE AND RUN to run the pipeline.
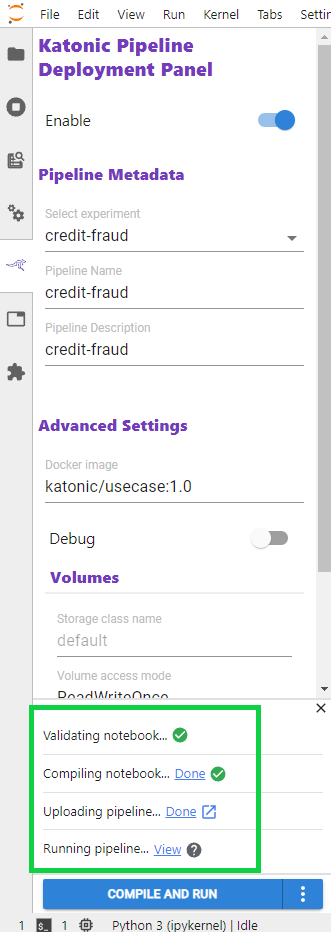
The pipeline will validate combine and run. The status of these steps is as shown below.
The pipeline will run in Katonic environment. You can see the pipeline in Runs tab in the platform.
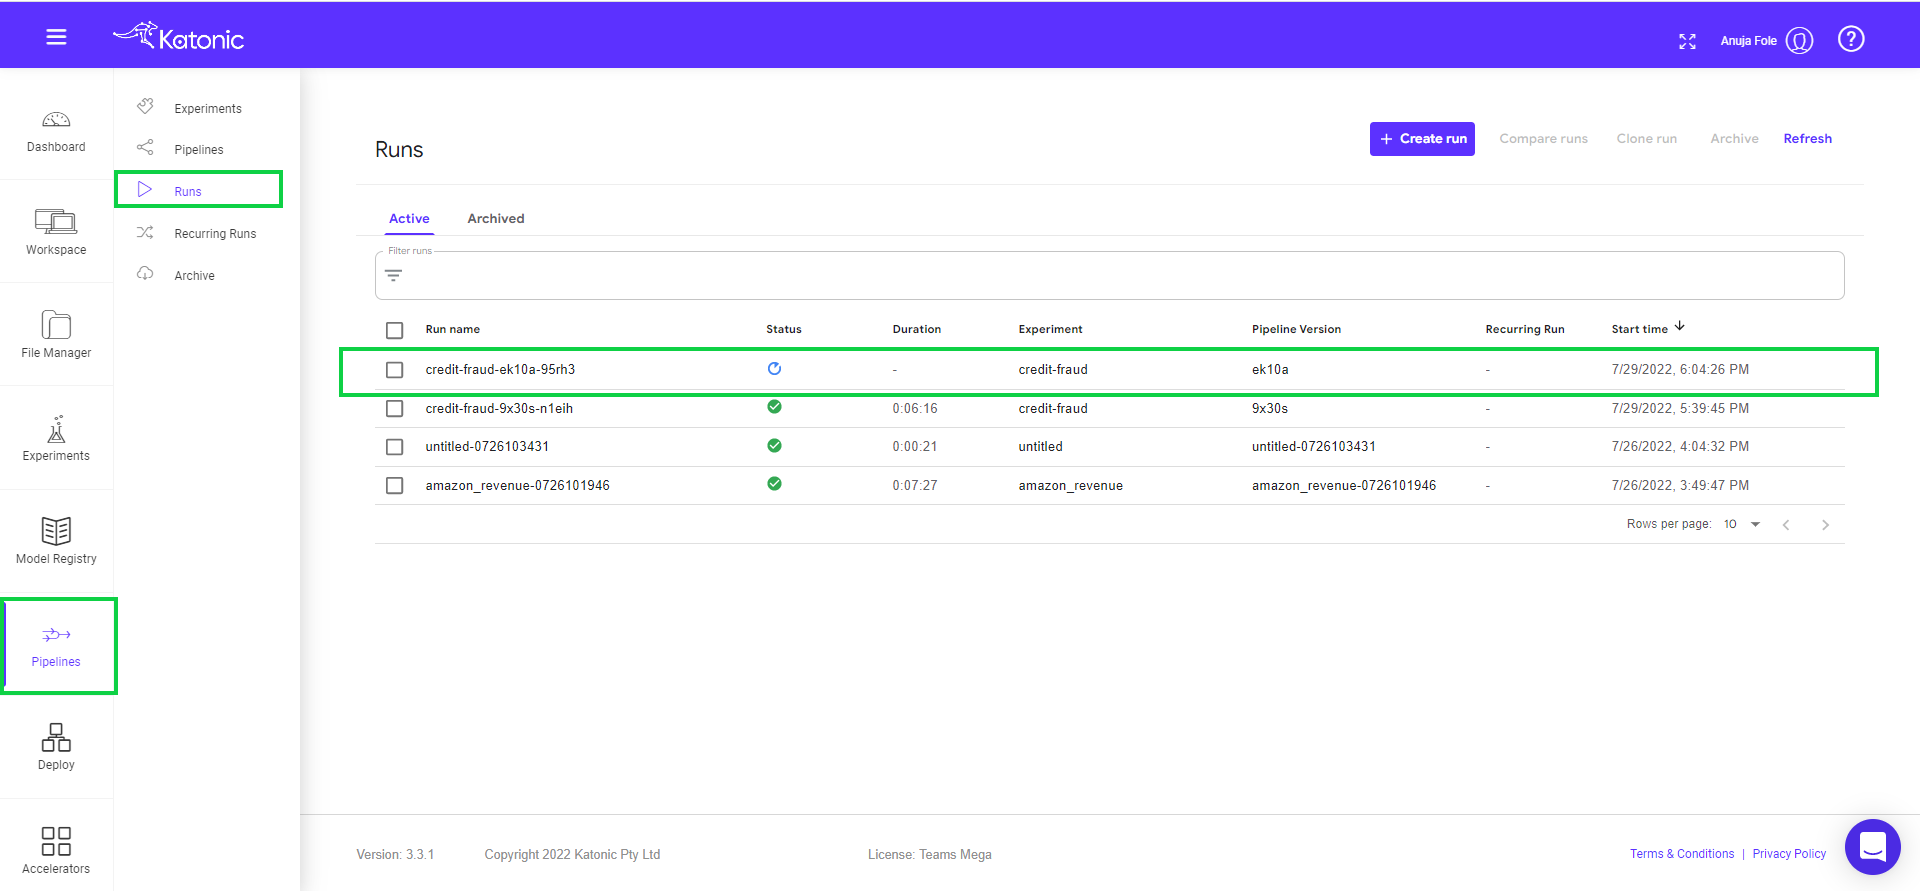
Click on the pipeline to view the complete pipeline. The pipeline status is in Running. Once all the components run it will show the status in green.
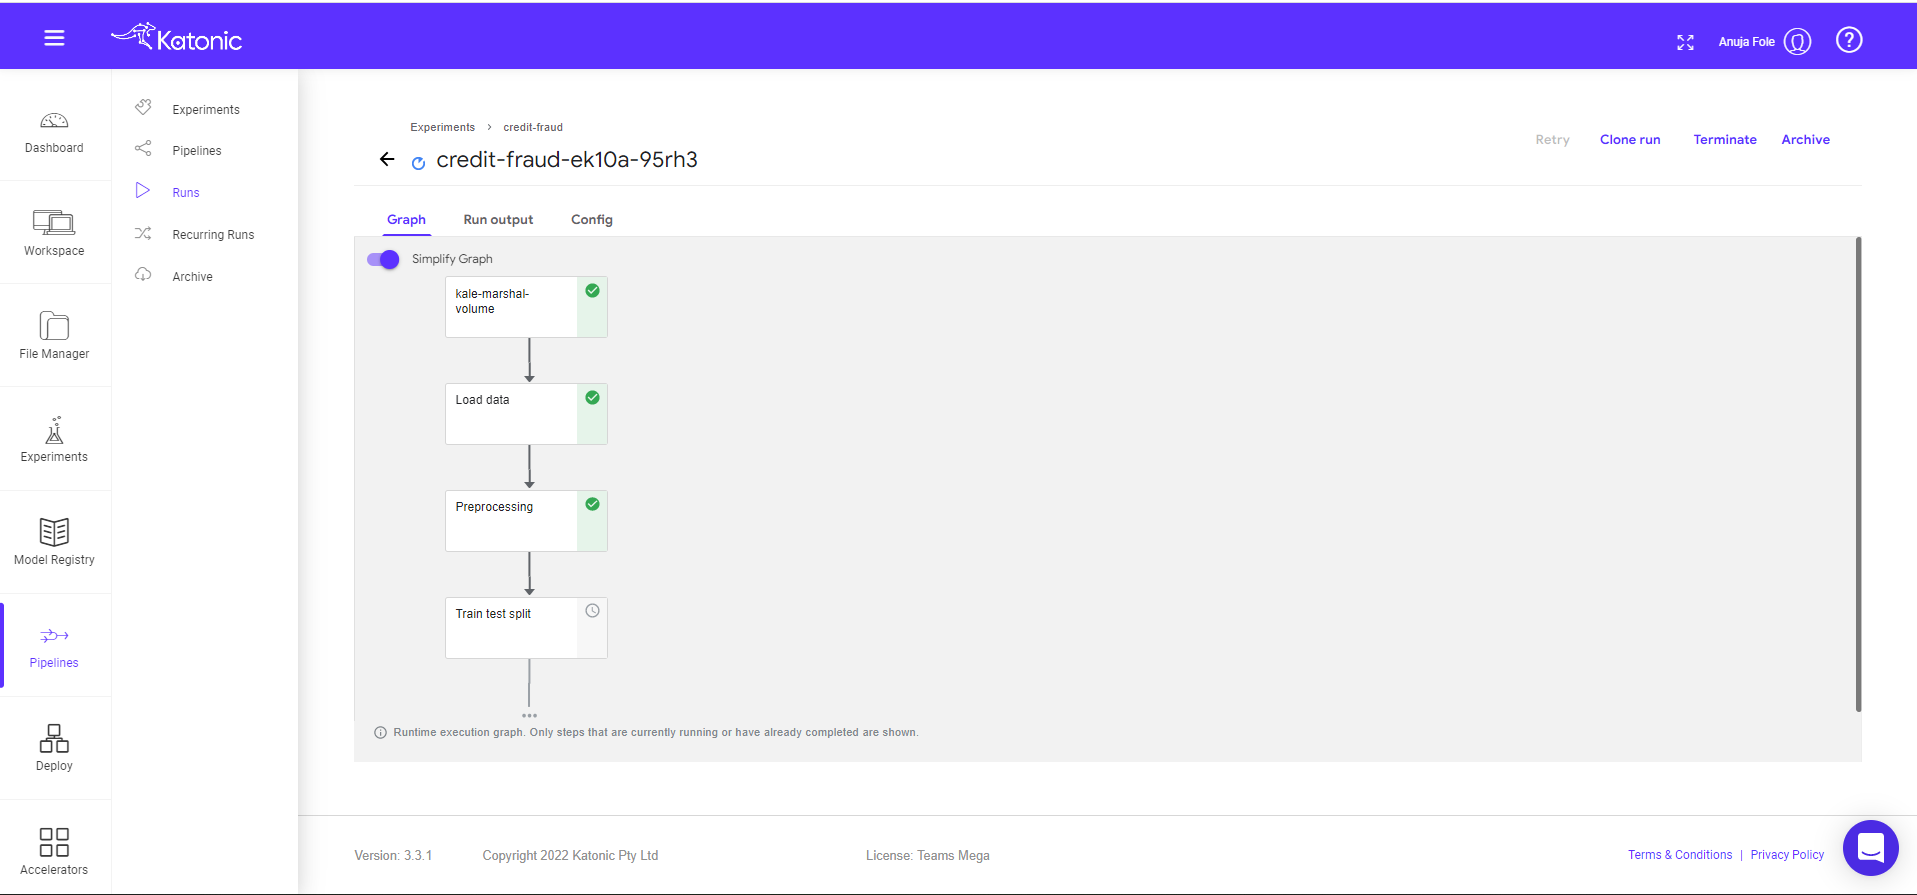
Note: To view the pipeline clearly use “full screen” mode (button available on the top right).
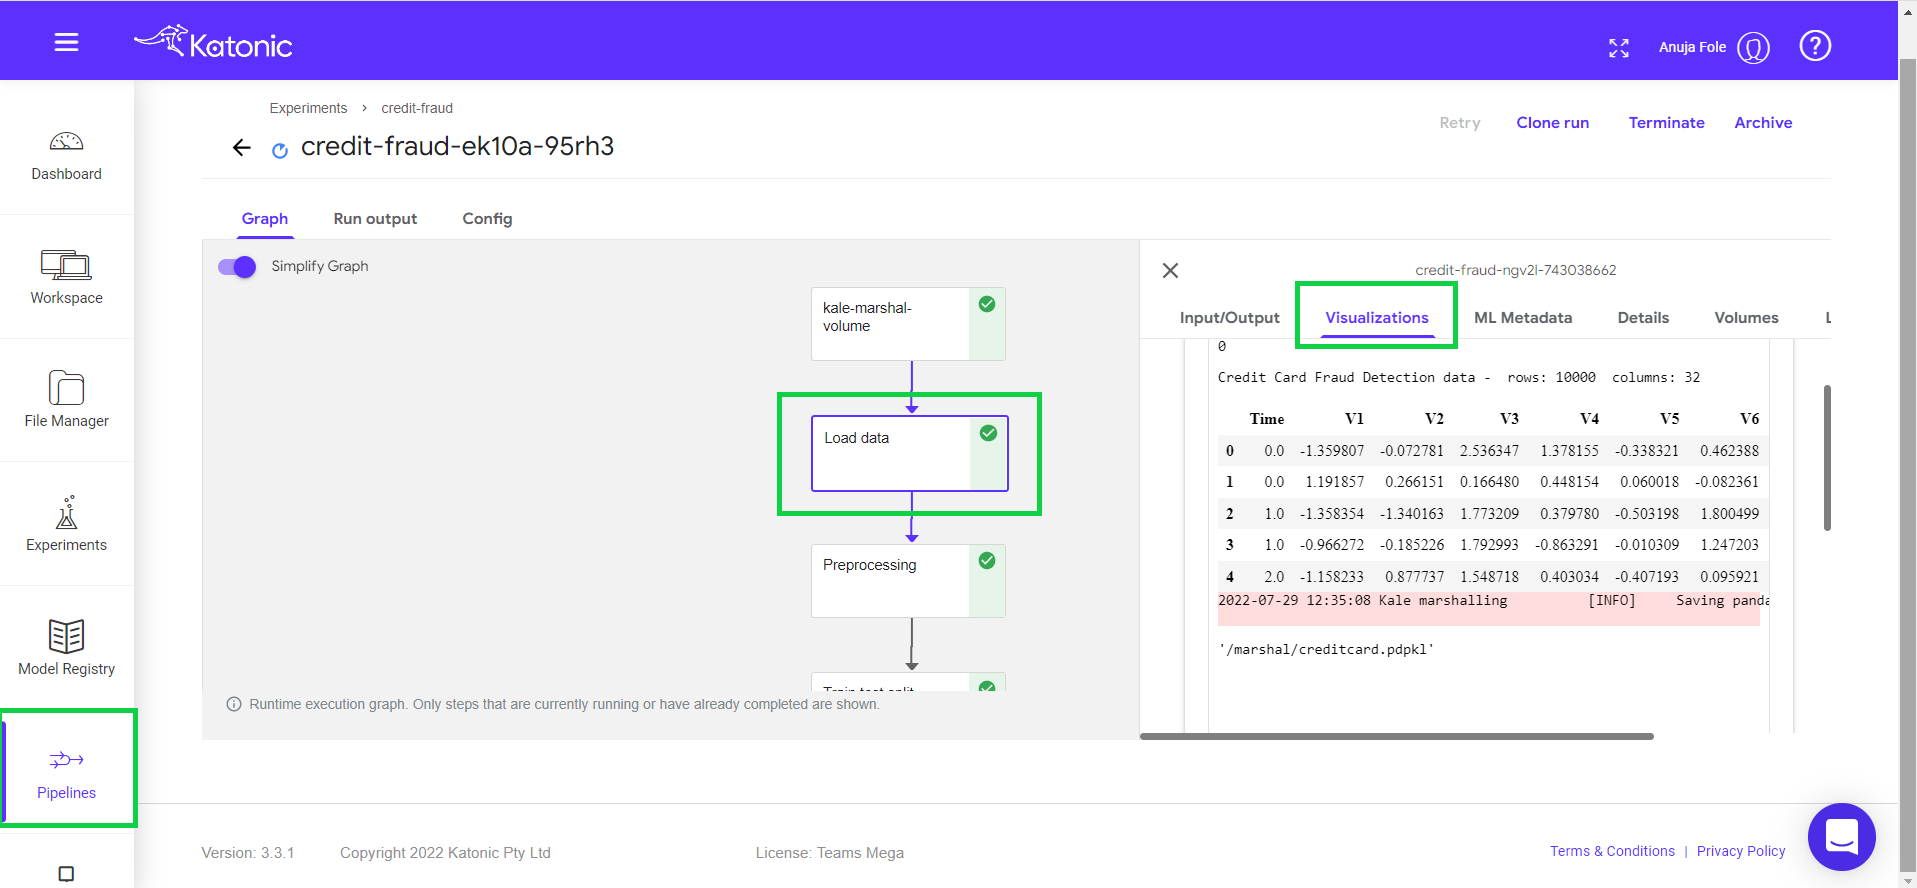
Click on the component to see the logs and visualizations of the current step.
3.9 Schedule Pipeline
In the previous section, we have seen how to run the pipeline. In this section, you will learn how to schedule this pipeline or re-run the same pipeline again.
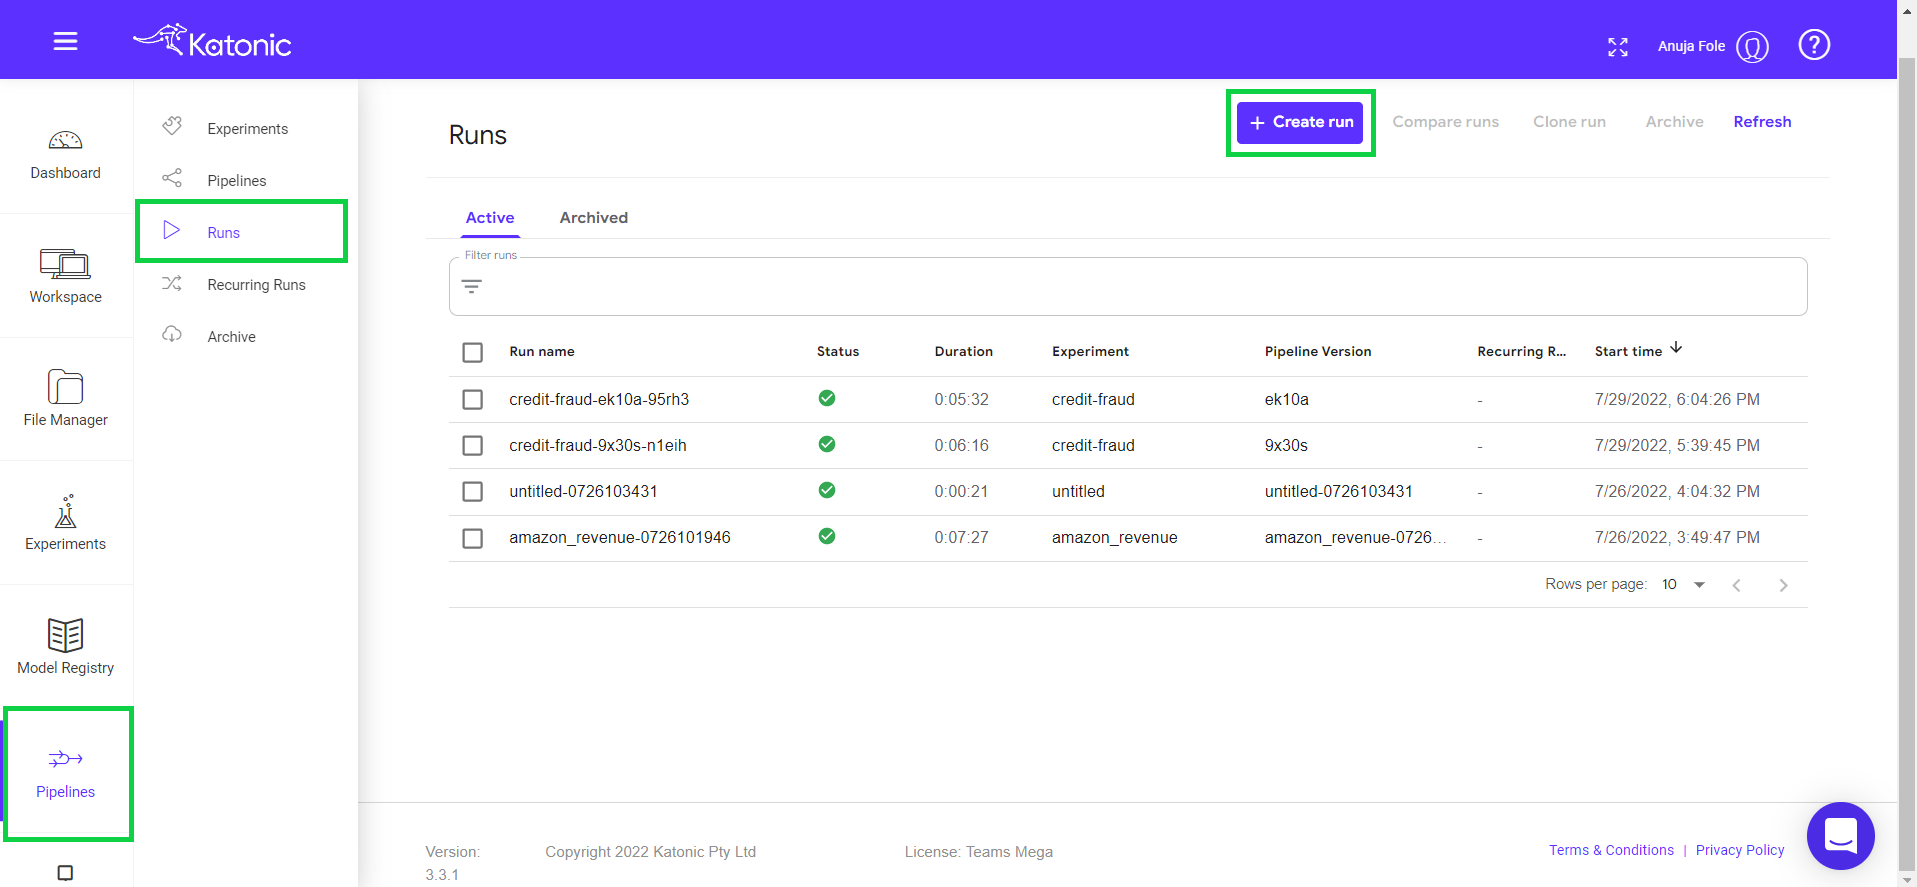
Go to Runs in the left side bar and click on Create Run.
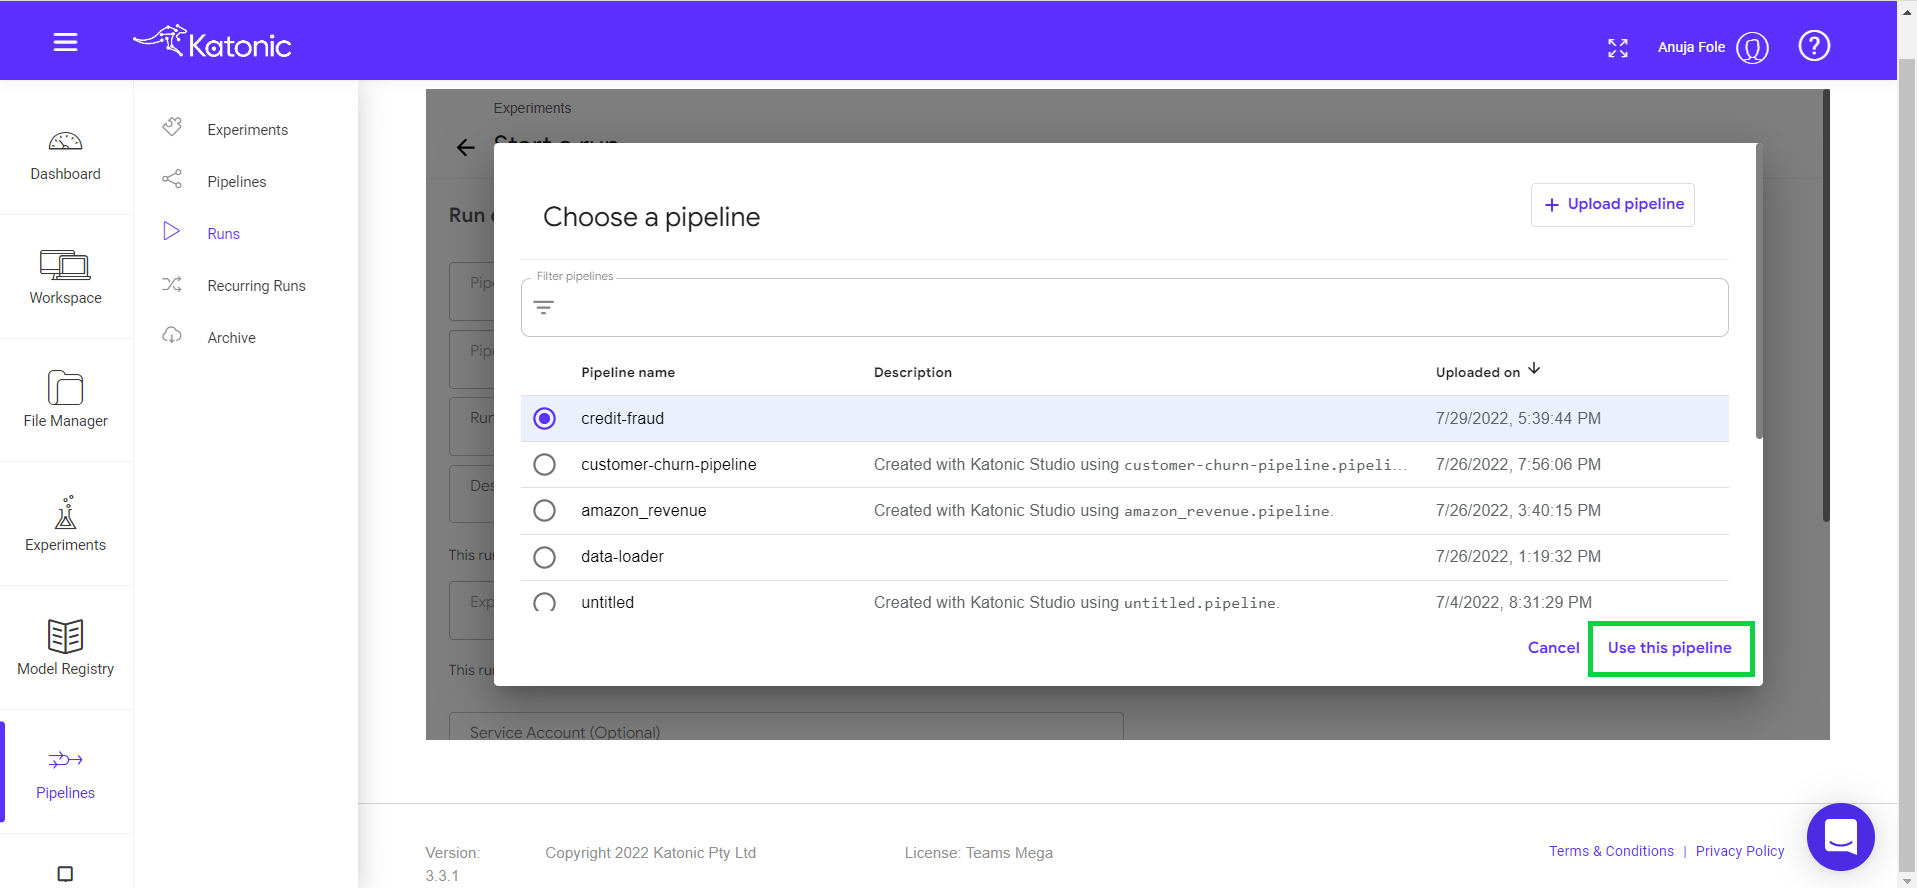
Click on Choose in the pipeline text box.
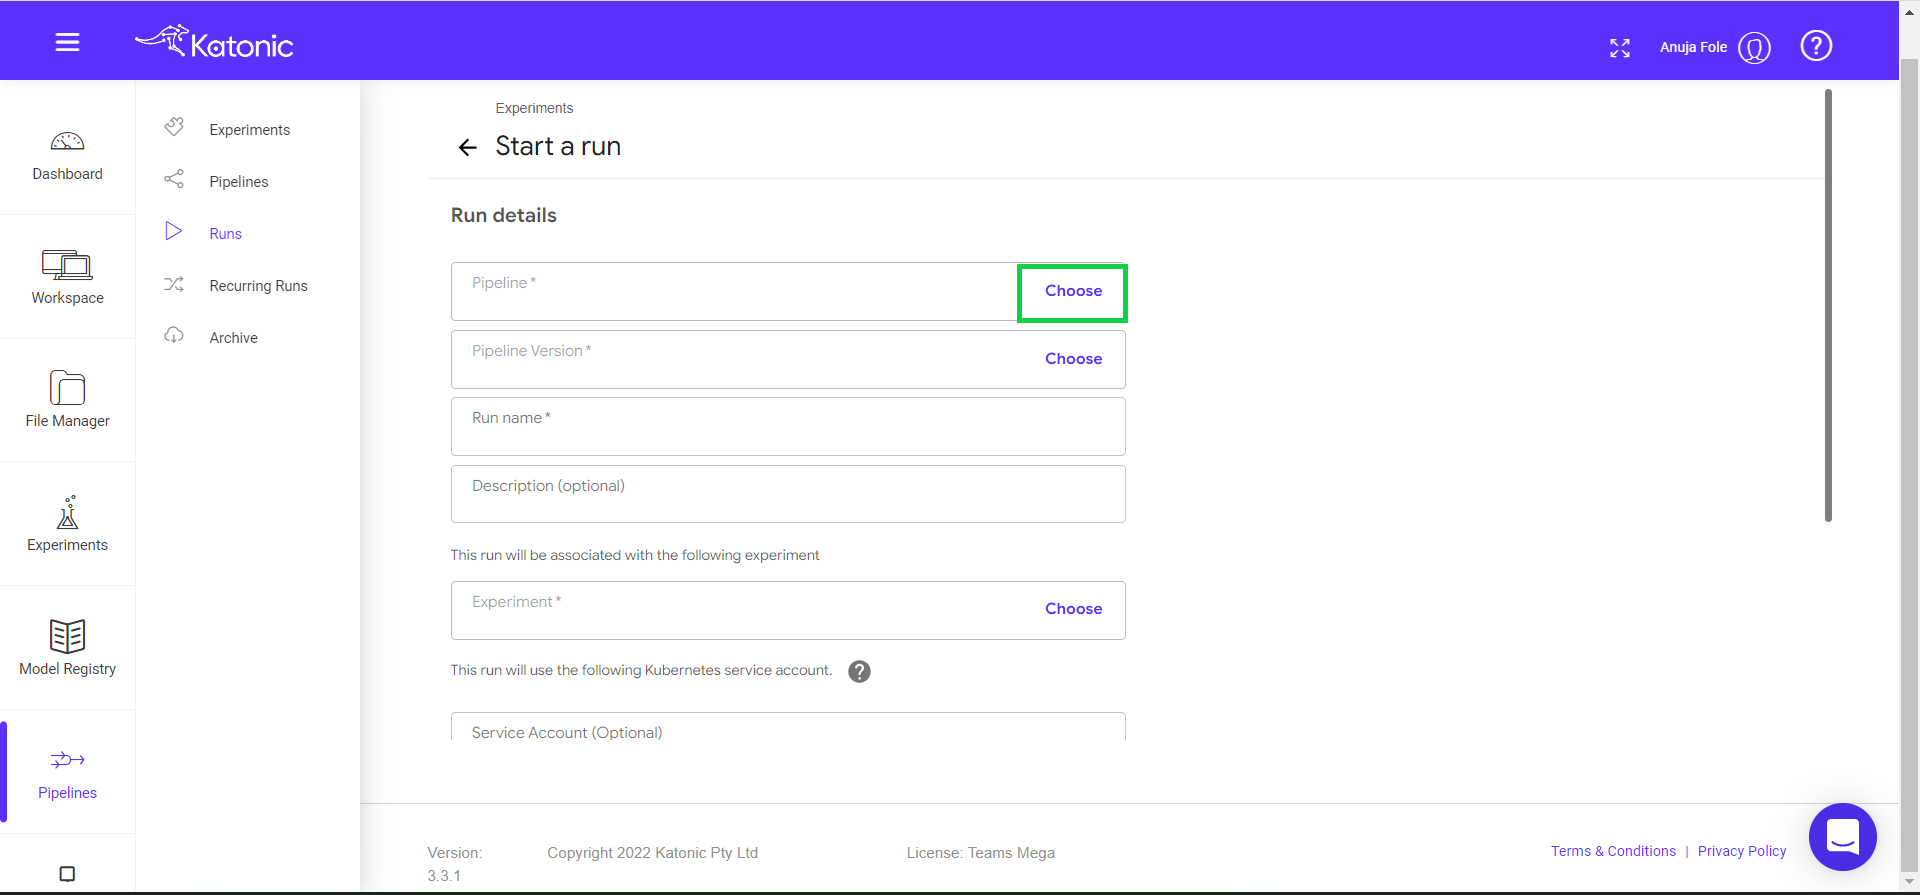
Select a pipeline that you want to run or schedule (Eg : credit-fraud). Click on “Use this pipeline” button.
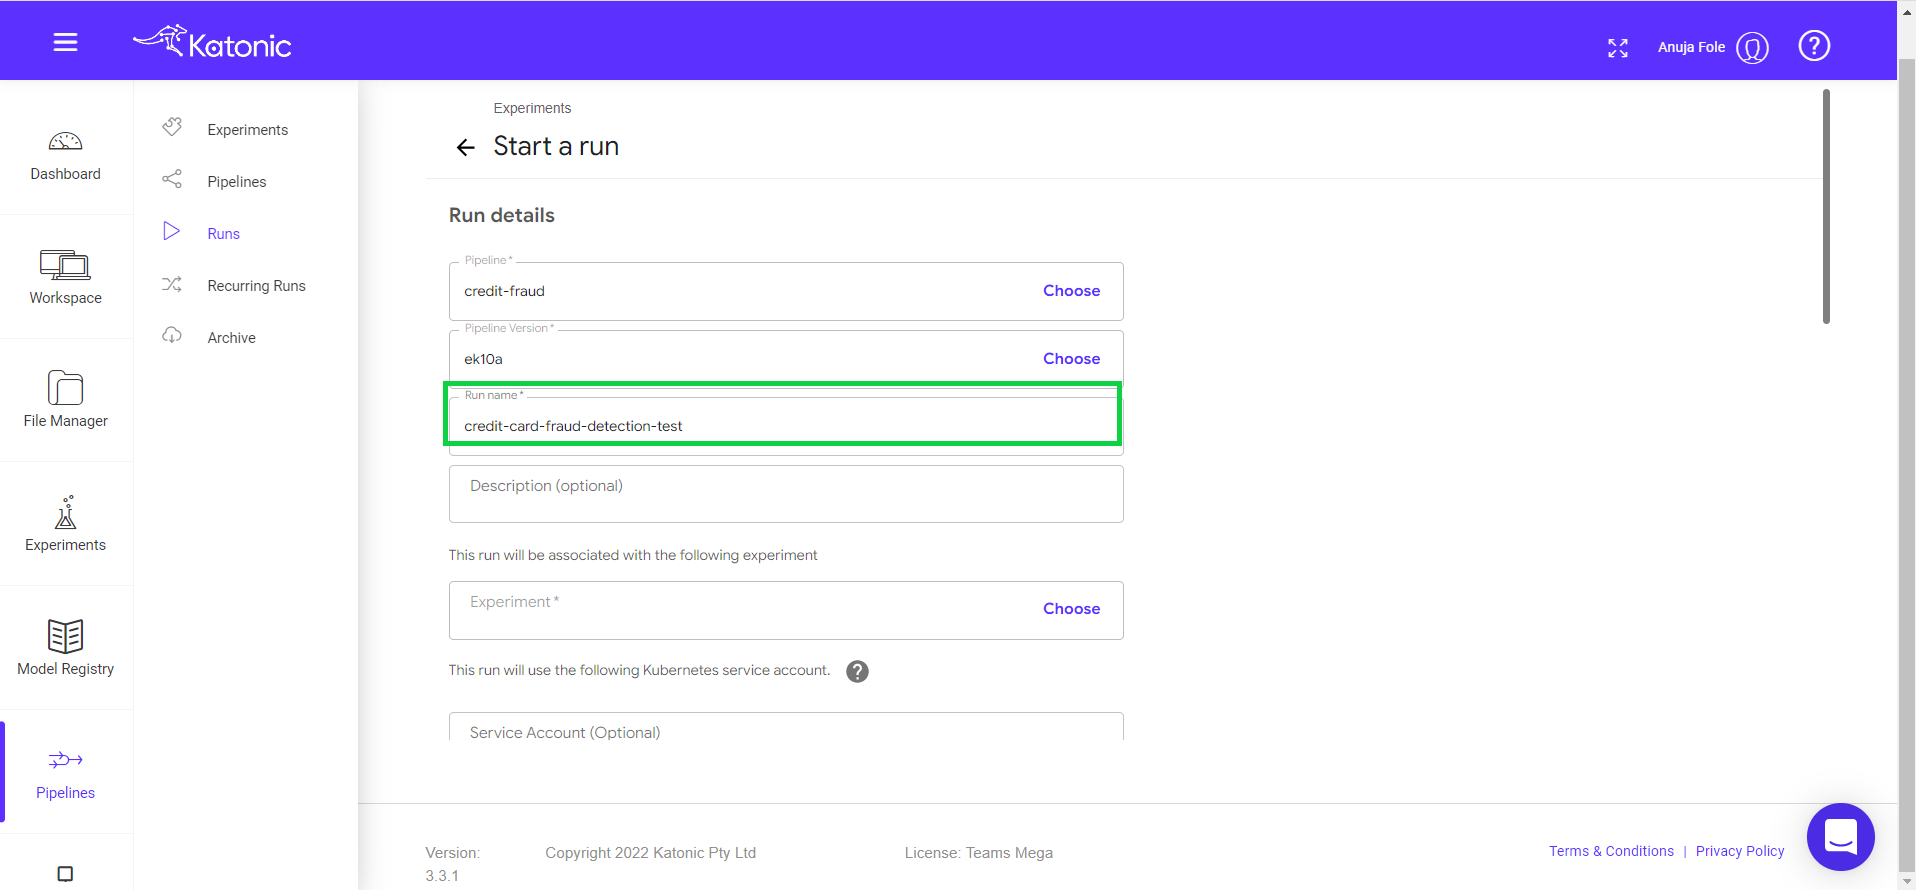
Give a new Run Name (Eg: credit-card-fraud-detection-test).
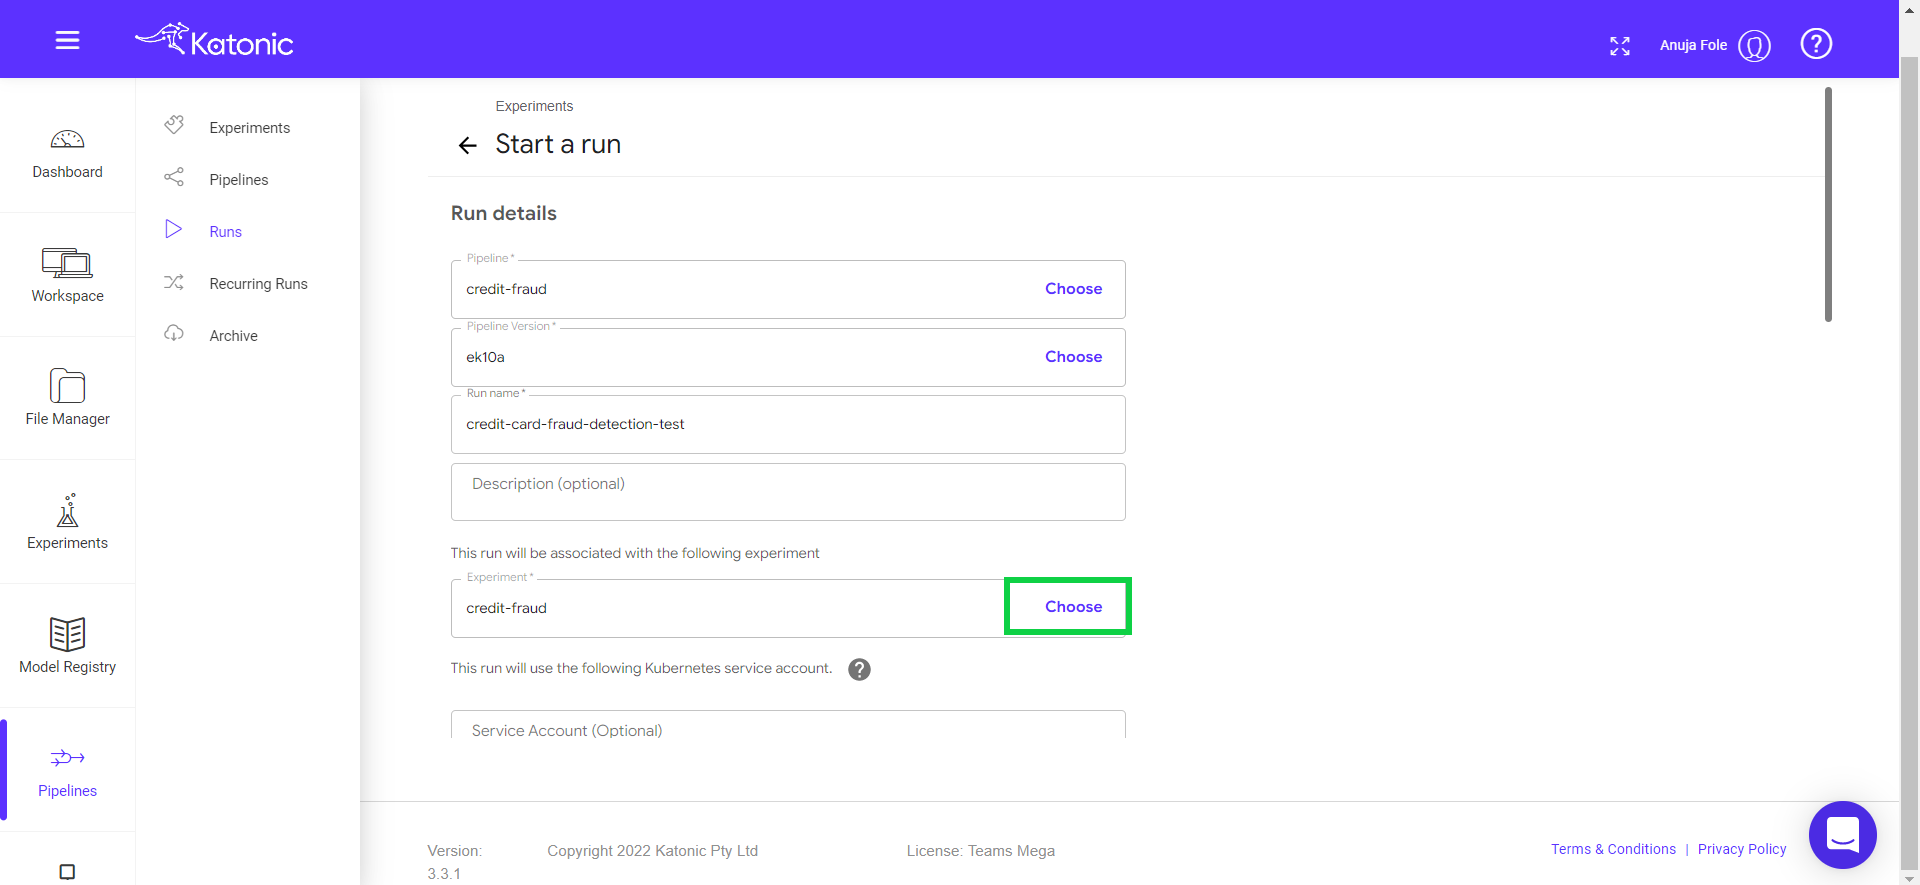
Click on Choose in the experiments text box.
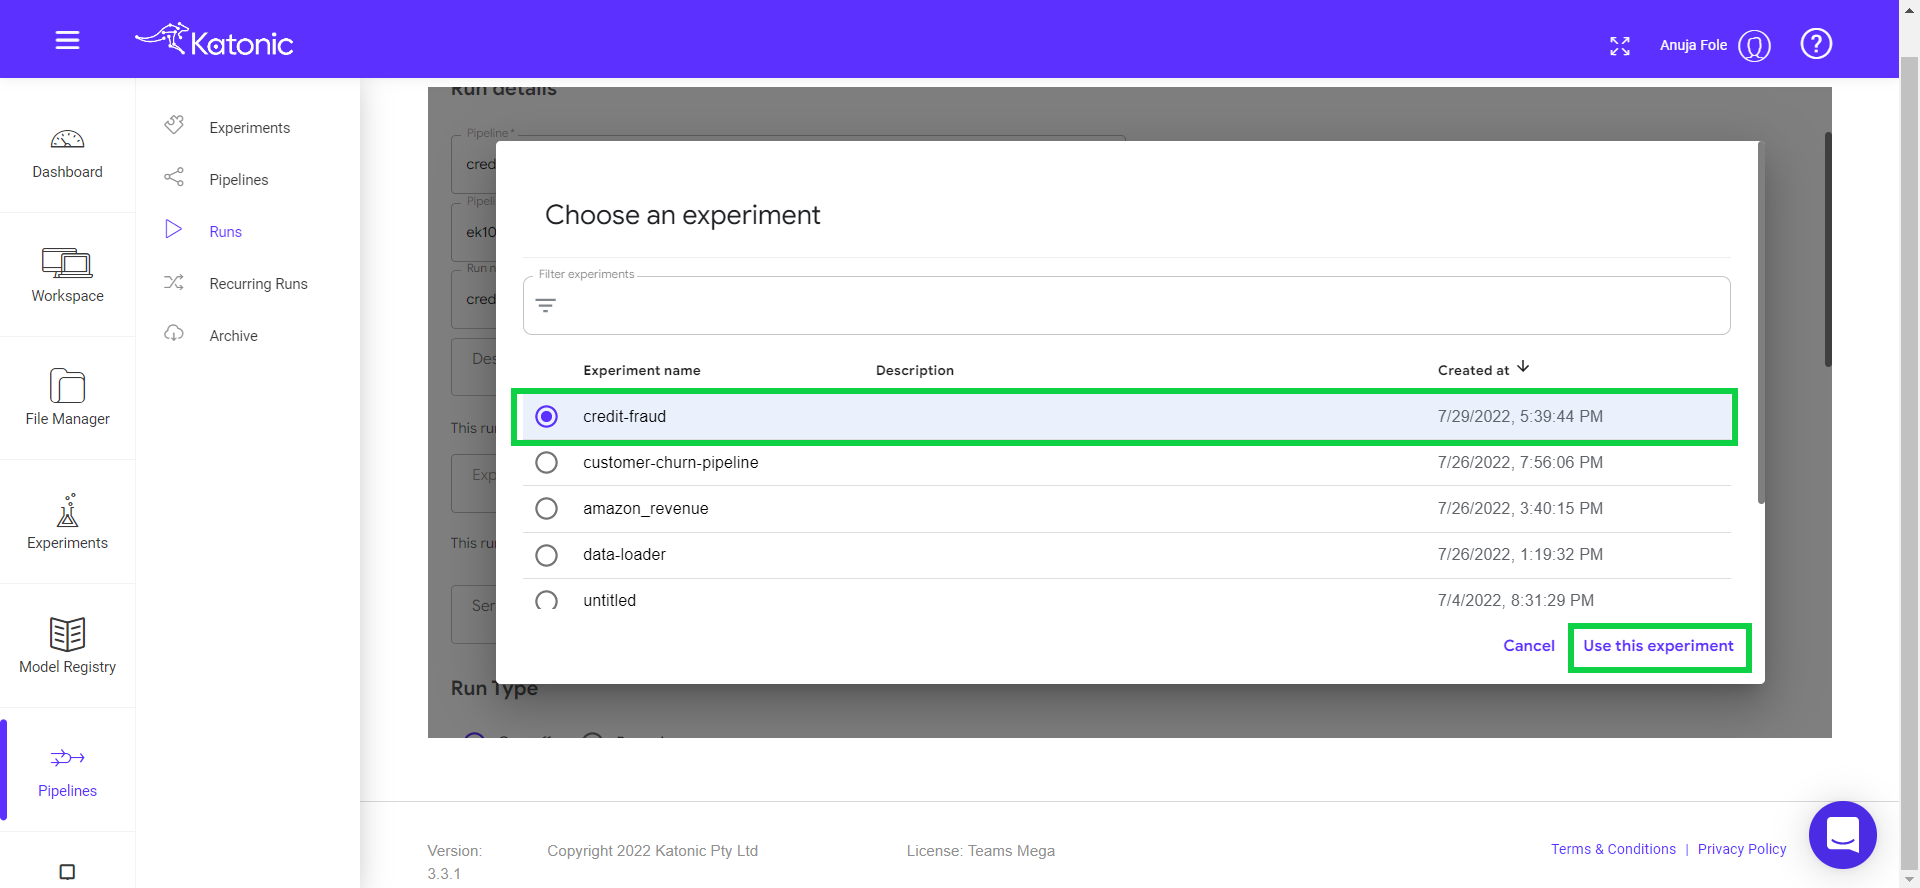
Select a pipeline that you want to run or schedule (Eg: credit-card-fraud-detection). Click on “Use this experiment” button.
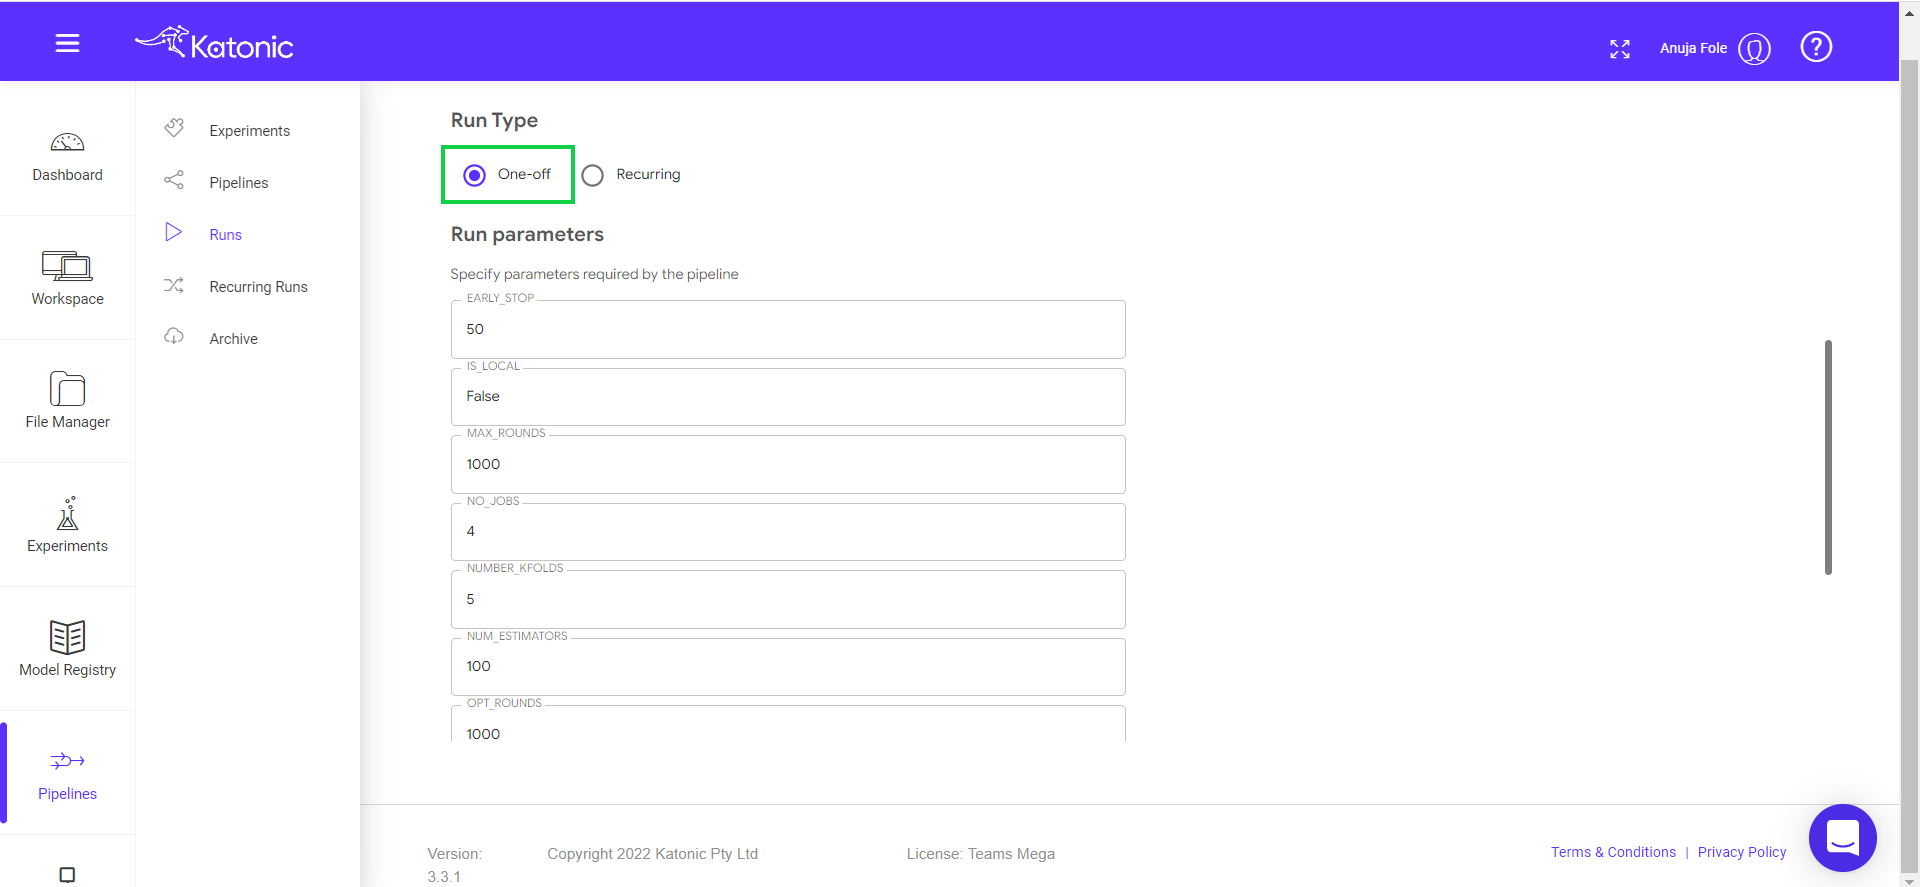
The pipeline can be run in two ways i.e., run once or schedule
Run Once: Select Run Type as One-off radio button and click on start to run the pipeline.
Scheduling: Select Run Type as Recurring.
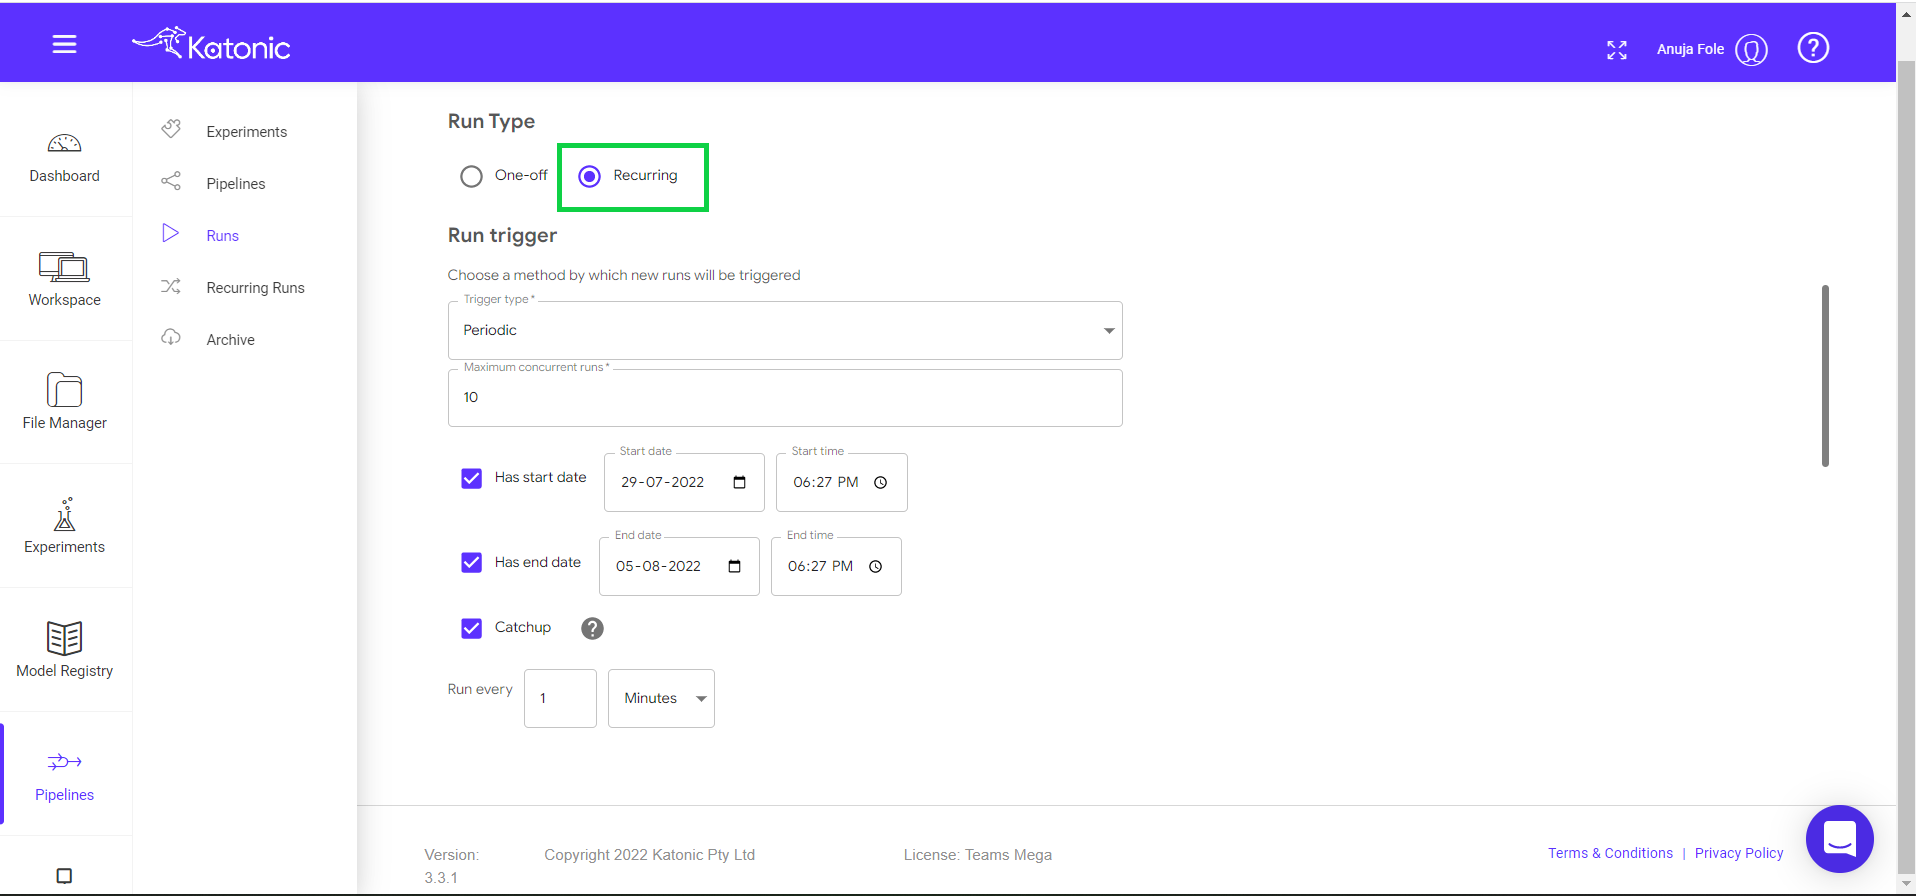
Trigger Type: Select if the pipeline should run as a Periodic or cron Job.
Maximum Concurrent Runs: limit the number of runs launched in parallel.
Start Date and End Date: Give start and end date of scheduler (Optional)
Catchup: Specify how many runs every minute/hour/day/week/month.
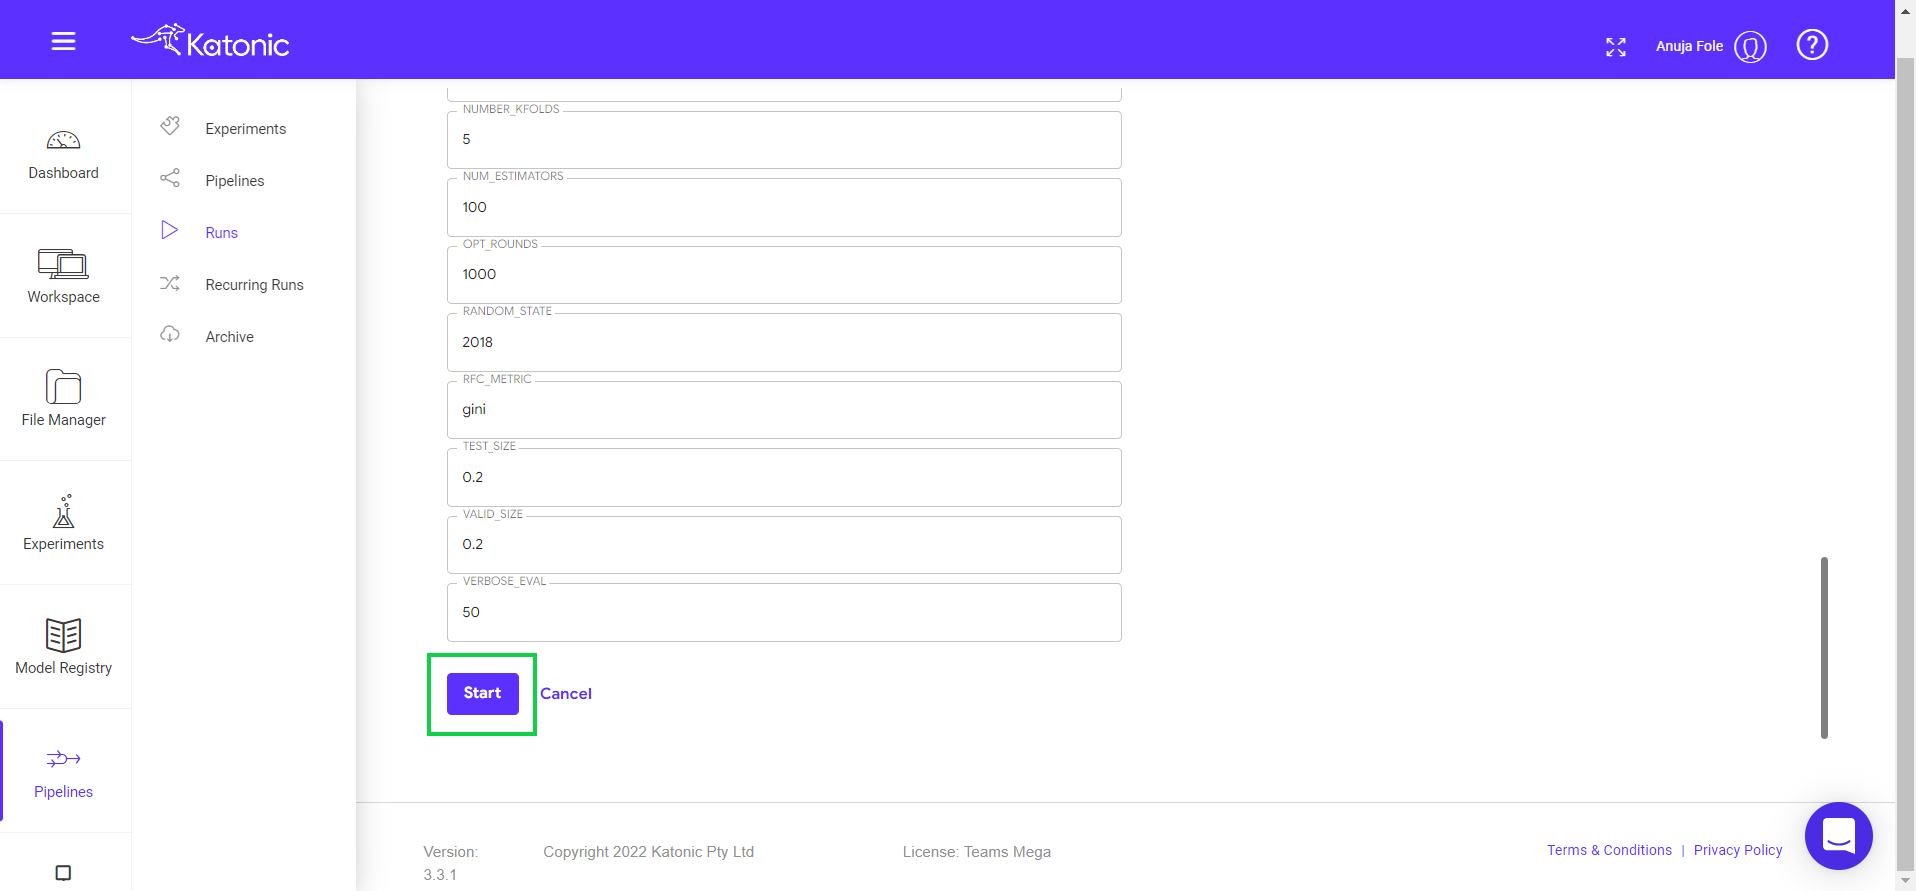
If you want to change any pipeline parameters you can chnage from Run Parameters. Click on Start to start scheduling.
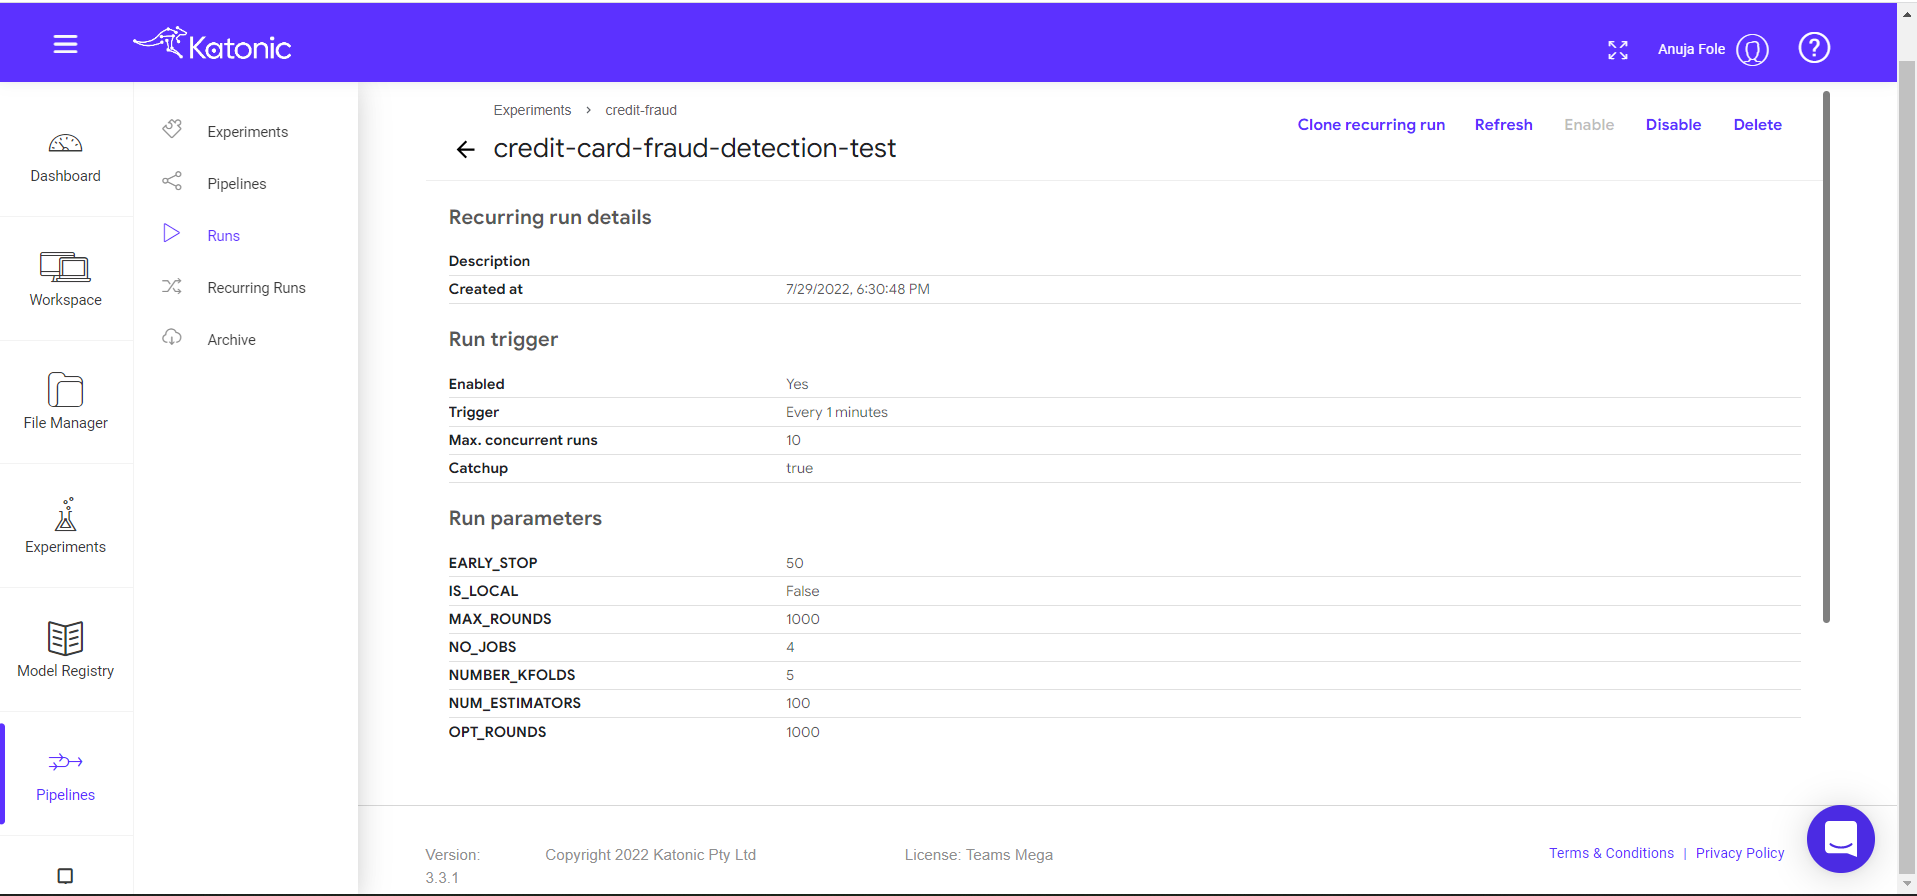
Scheduled runs can be seen here in the experiments.
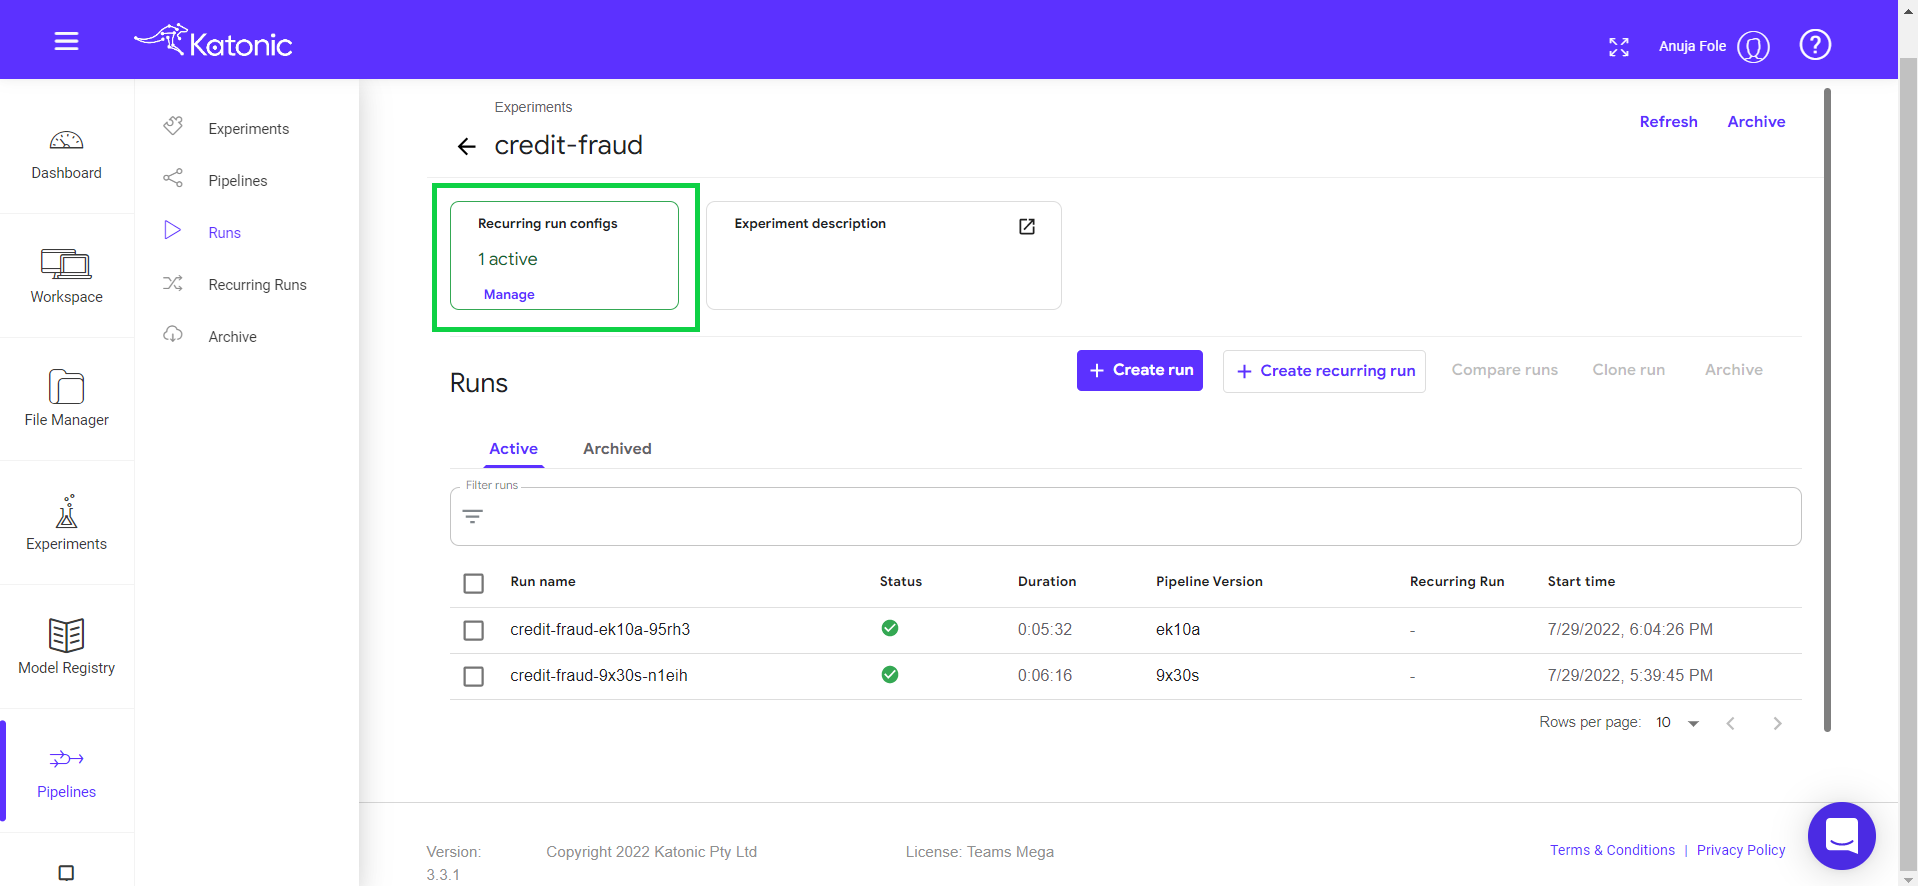
Click on manage to enable or disable the scheduler.
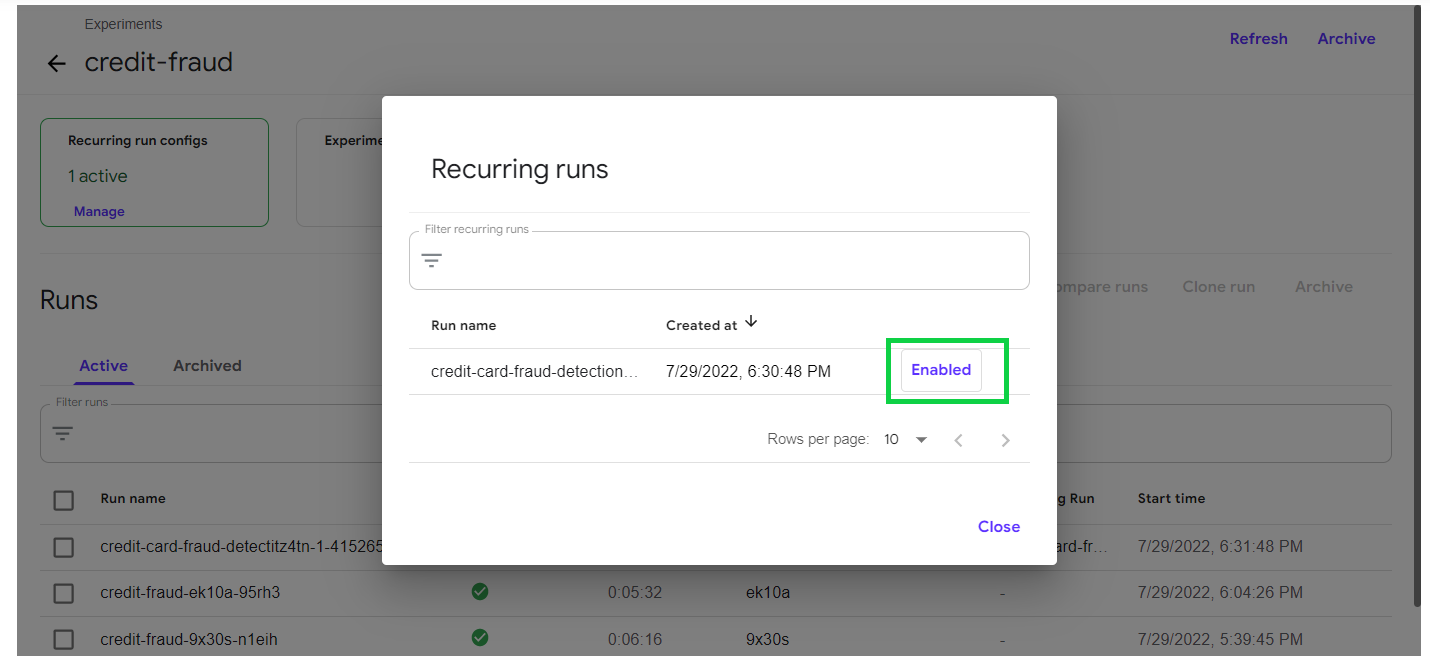
Click on run to check the schedule configurations.