The tool catalog
Tools
A tool is an action an agent can take beyond answering from a model: search a knowledge source, call an HTTP endpoint, run code, or use a capability an MCP server exposes. Tools in the Control Room is where the sources of those tools are registered, inspected and governed. This page explains its five tabs.
Who can use it: the Admin role, in a tenant licensed for tools. The Server catalog tab also needs the Catalog licence. Builders do not open this page: they attach tools to agents in Studio.
Recorded on .
How it works
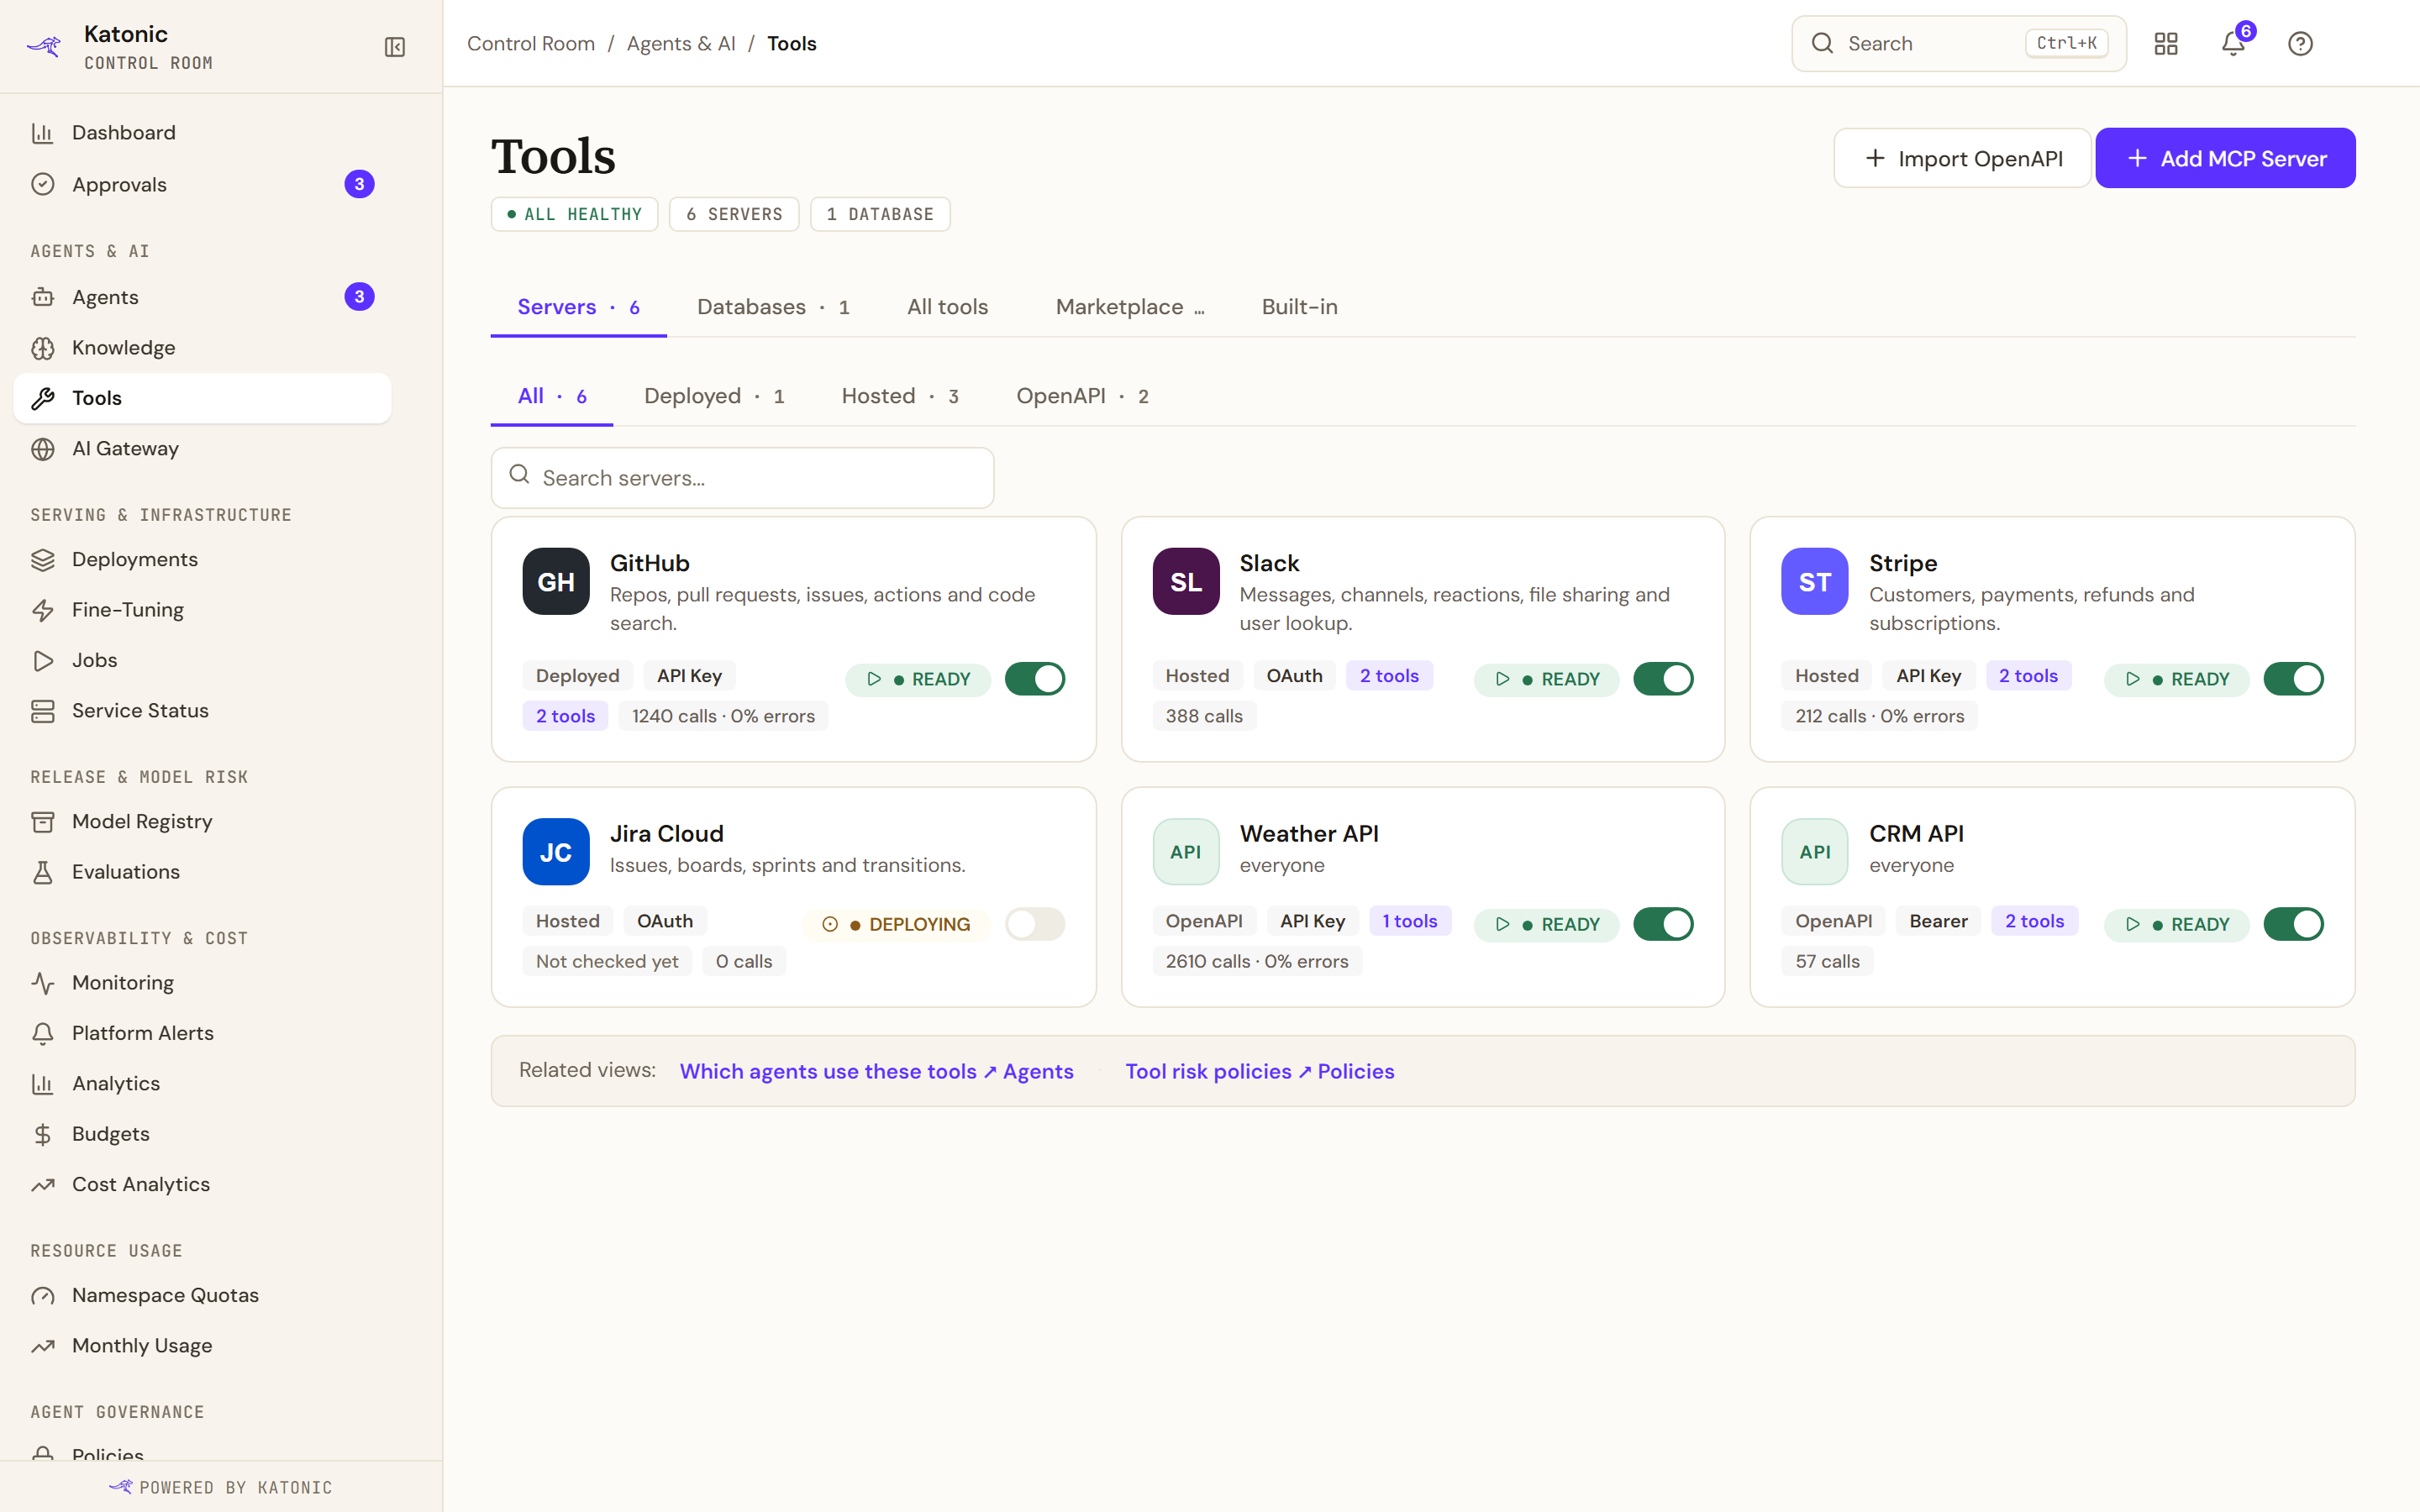
Open Tools under Agents & AI in the Control Room sidebar. The header carries a health chip that reads ALL HEALTHY or names what needs attention (server errors, authentication issues, failed databases, or a tools backend that could not be reached), then chips counting servers and databases. Import OpenAPI and Add MCP Server add a source by hand.
| Tab | What it holds |
|---|---|
| Servers | Every MCP server and OpenAPI source, one card each, with a status pill and an on/off switch |
| Databases | Databases connected so that data agents can query them |
| All tools | Every tool those sources expose, one row each, with its risk |
| Server catalog | The MCP catalog synced from Ops Hub, with Deploy on each card |
| Built-in | The tools that run inside Katonic, with an availability switch each |
Servers
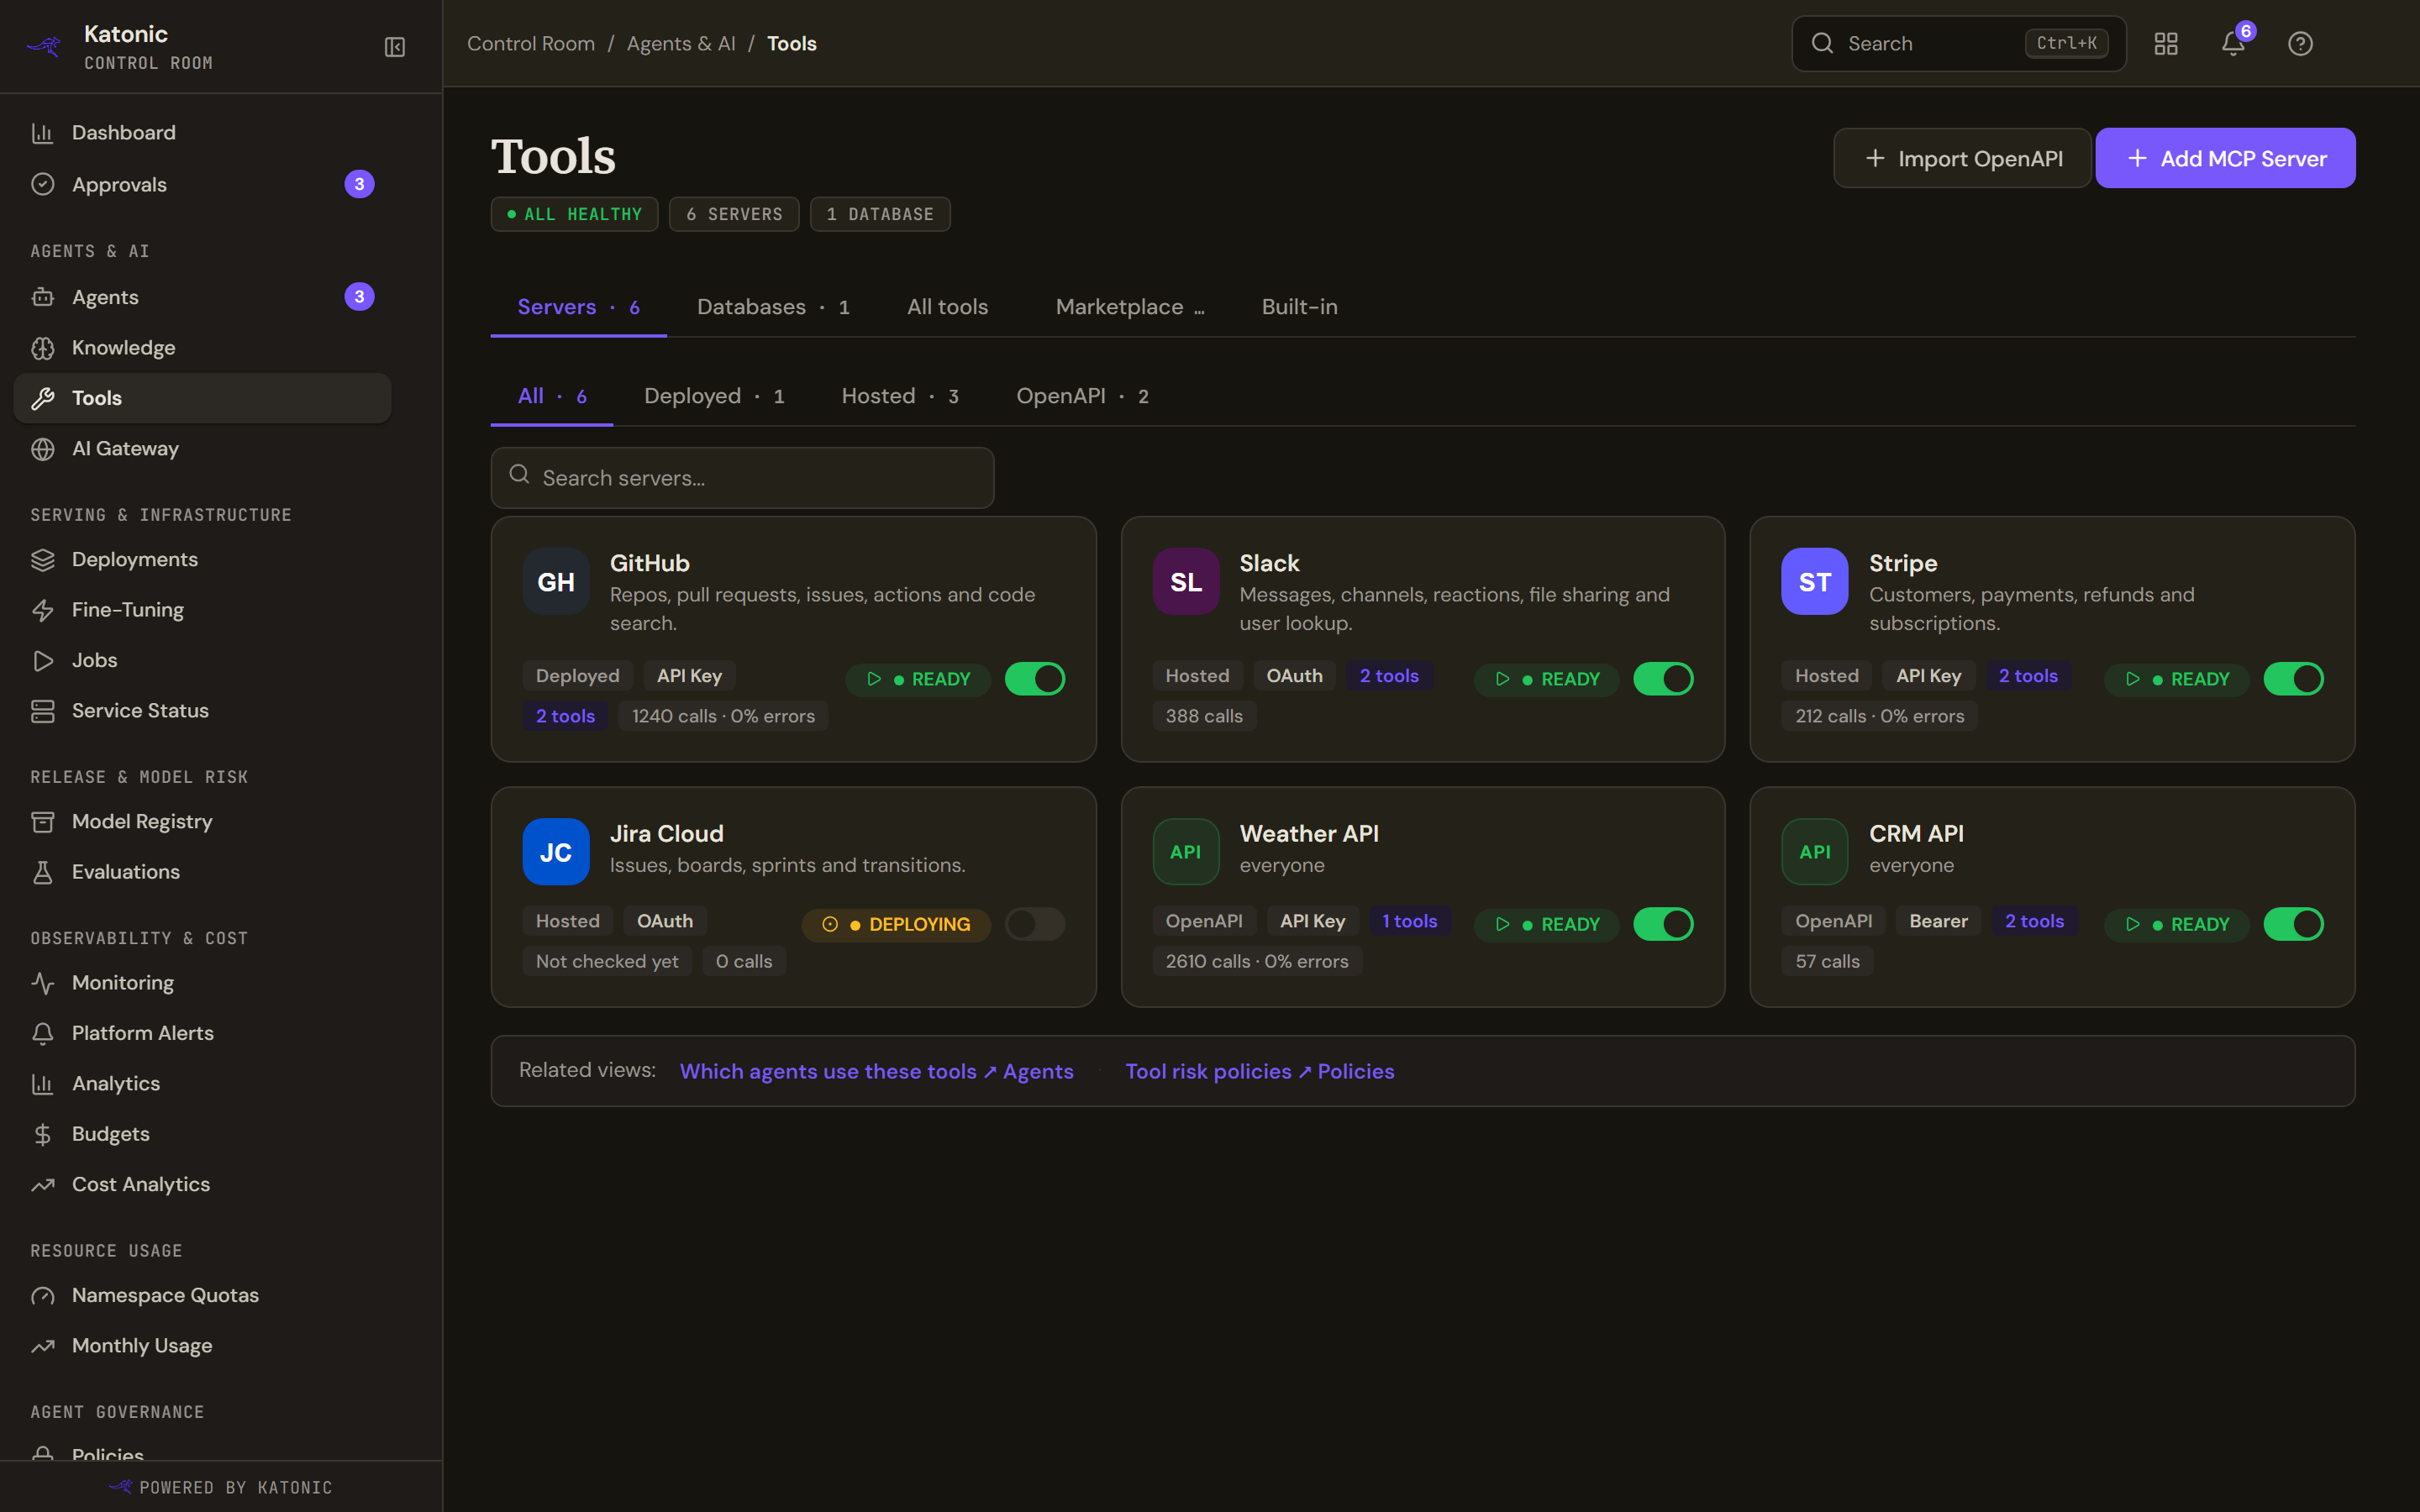
Chips above the grid count the cards by kind and filter them: Deployed (an image running on your cluster), Hosted (a server running elsewhere) and OpenAPI (an imported REST spec). Search servers... narrows by name. A card shows how the source authenticates (No auth, API Key, Bearer, Basic, OAuth or Custom Header), how many tools it exposes, its calls over the last 24 hours, and a status pill: RUNNING, DEPLOYING, STOPPED or ERROR for a server, ENABLED or DISABLED for an OpenAPI source. The switch starts and stops a server, or enables and disables an OpenAPI source for agents; Fix Auth takes its place when a credential has expired; select a card to open its detail. See Add an MCP server and Connect an API as a tool.
All tools
All tools answers what your agents can actually do without opening every card. The chips All sources, Deployed, Hosted, OpenAPI and Database filter by source kind, Search tools matches a name or description, and the All, Read and Write segment filters by risk. The table lists Tool, Source, Kind, Risk and Basis.
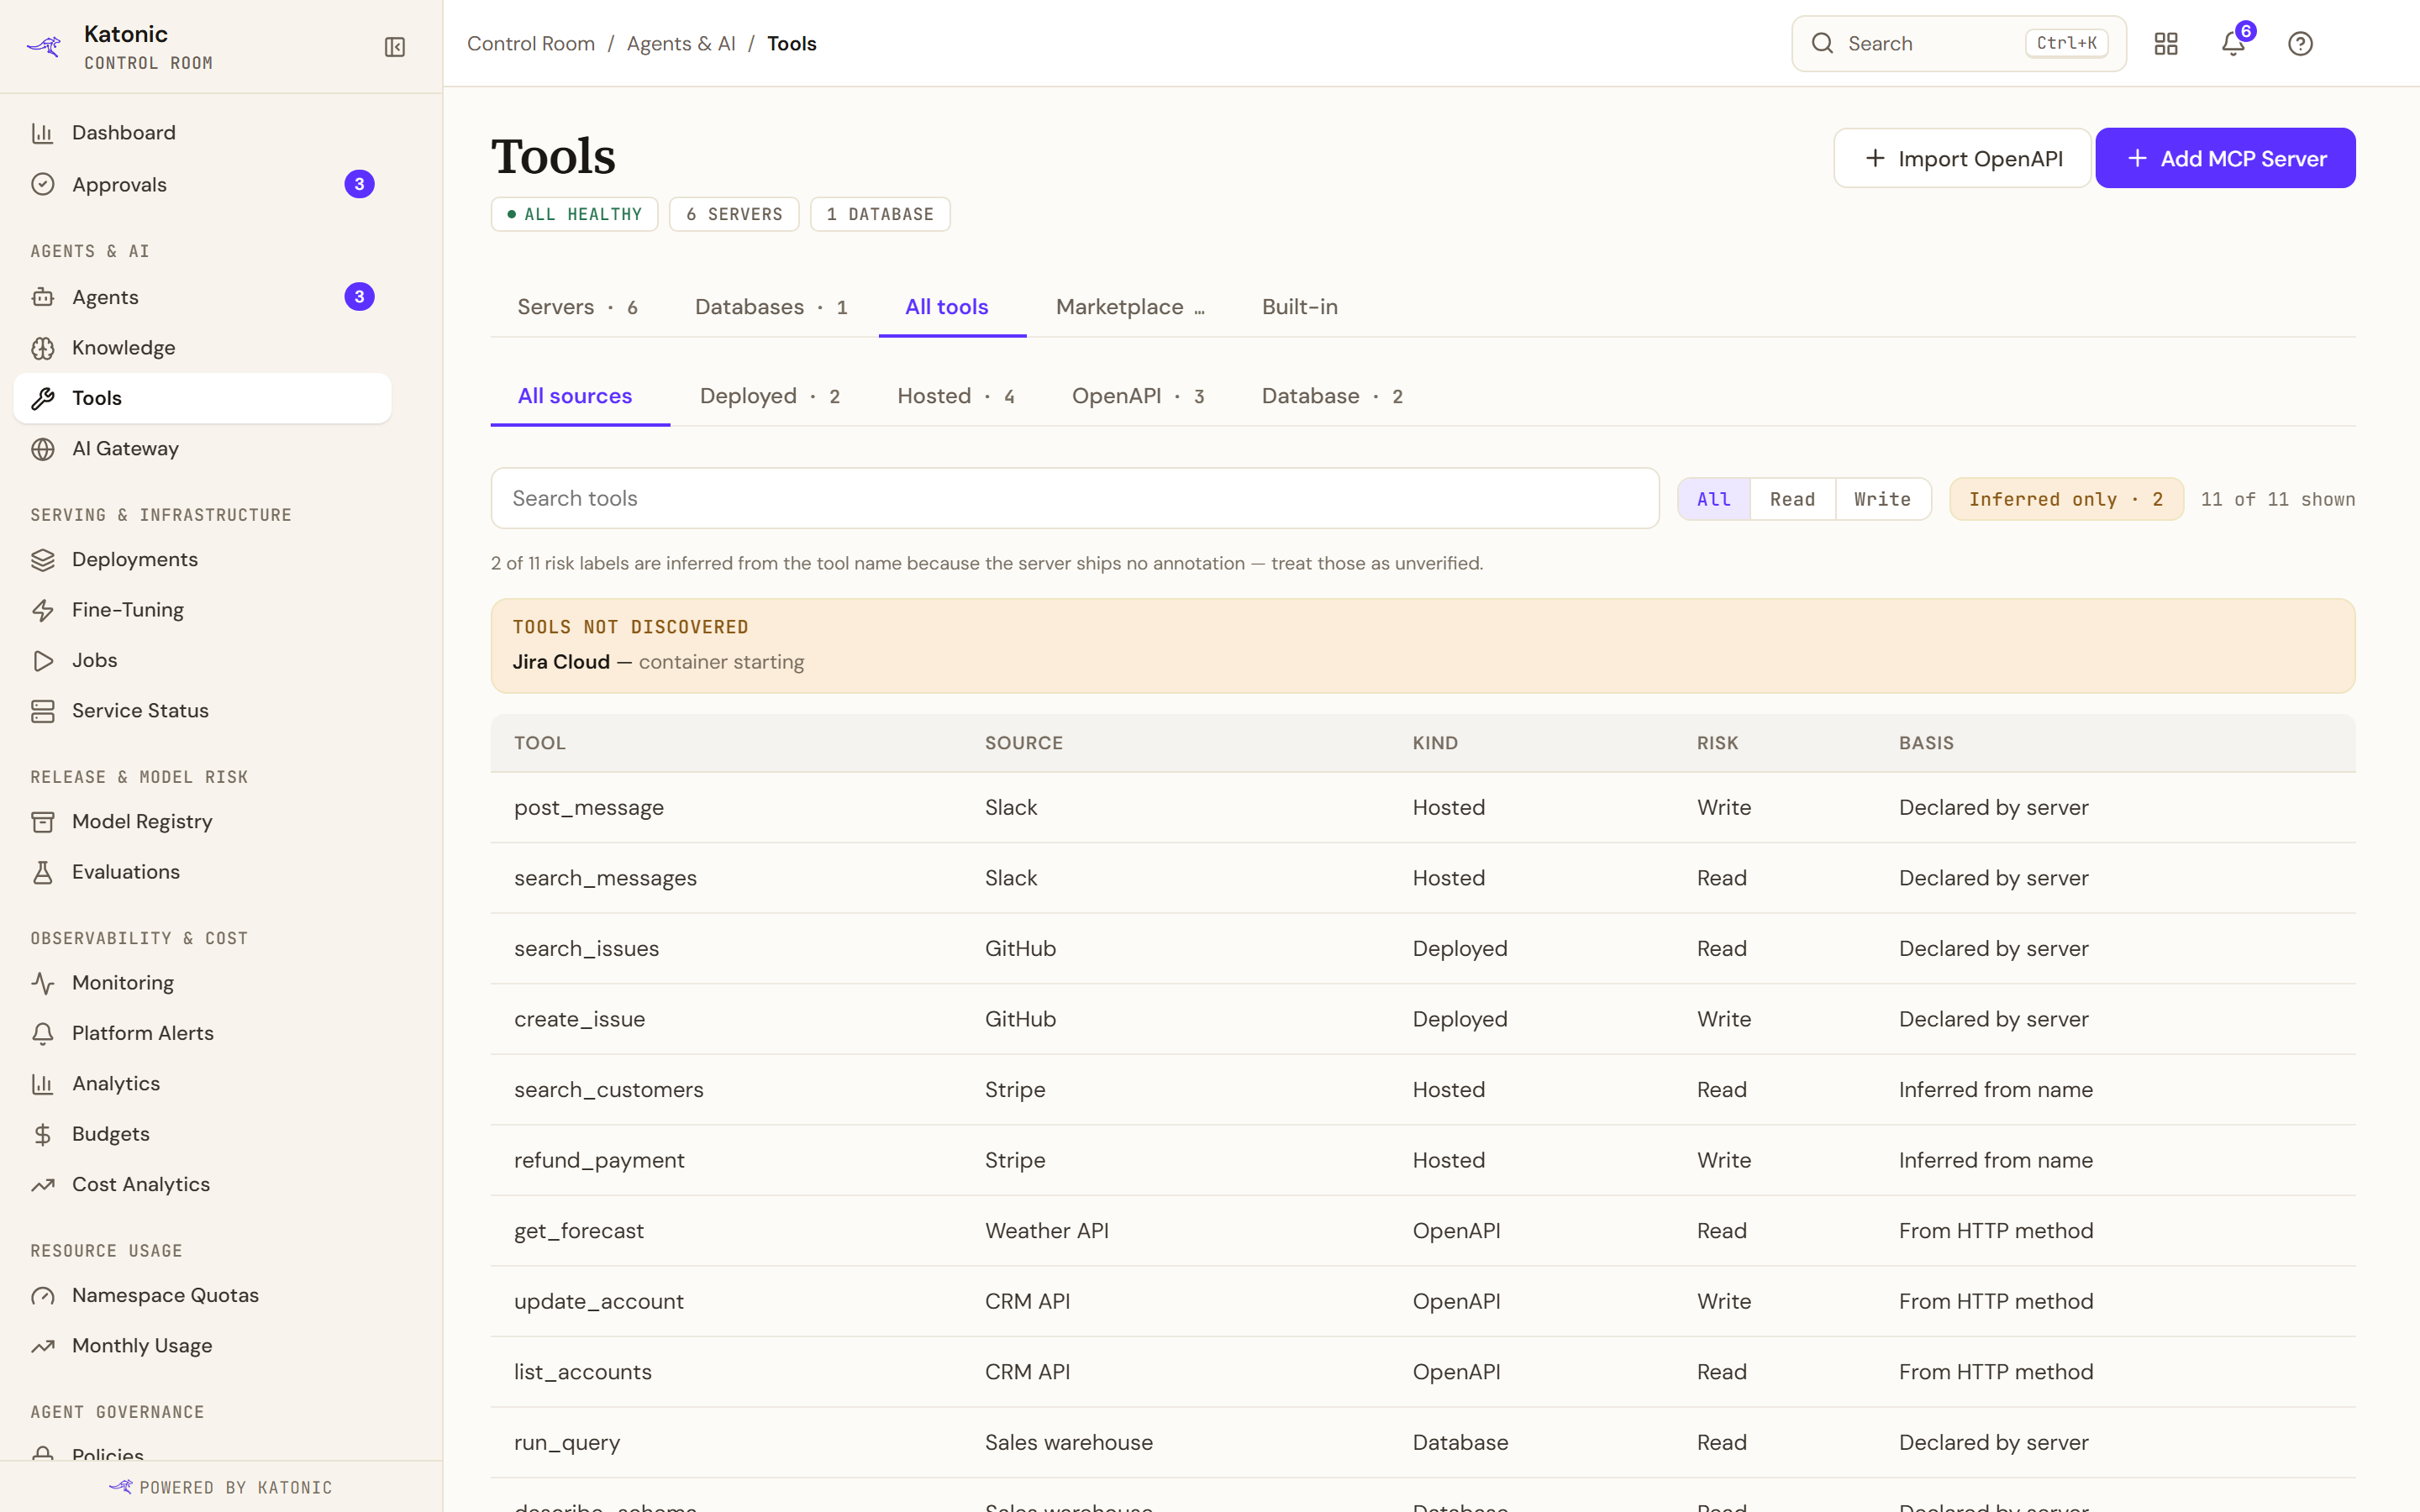
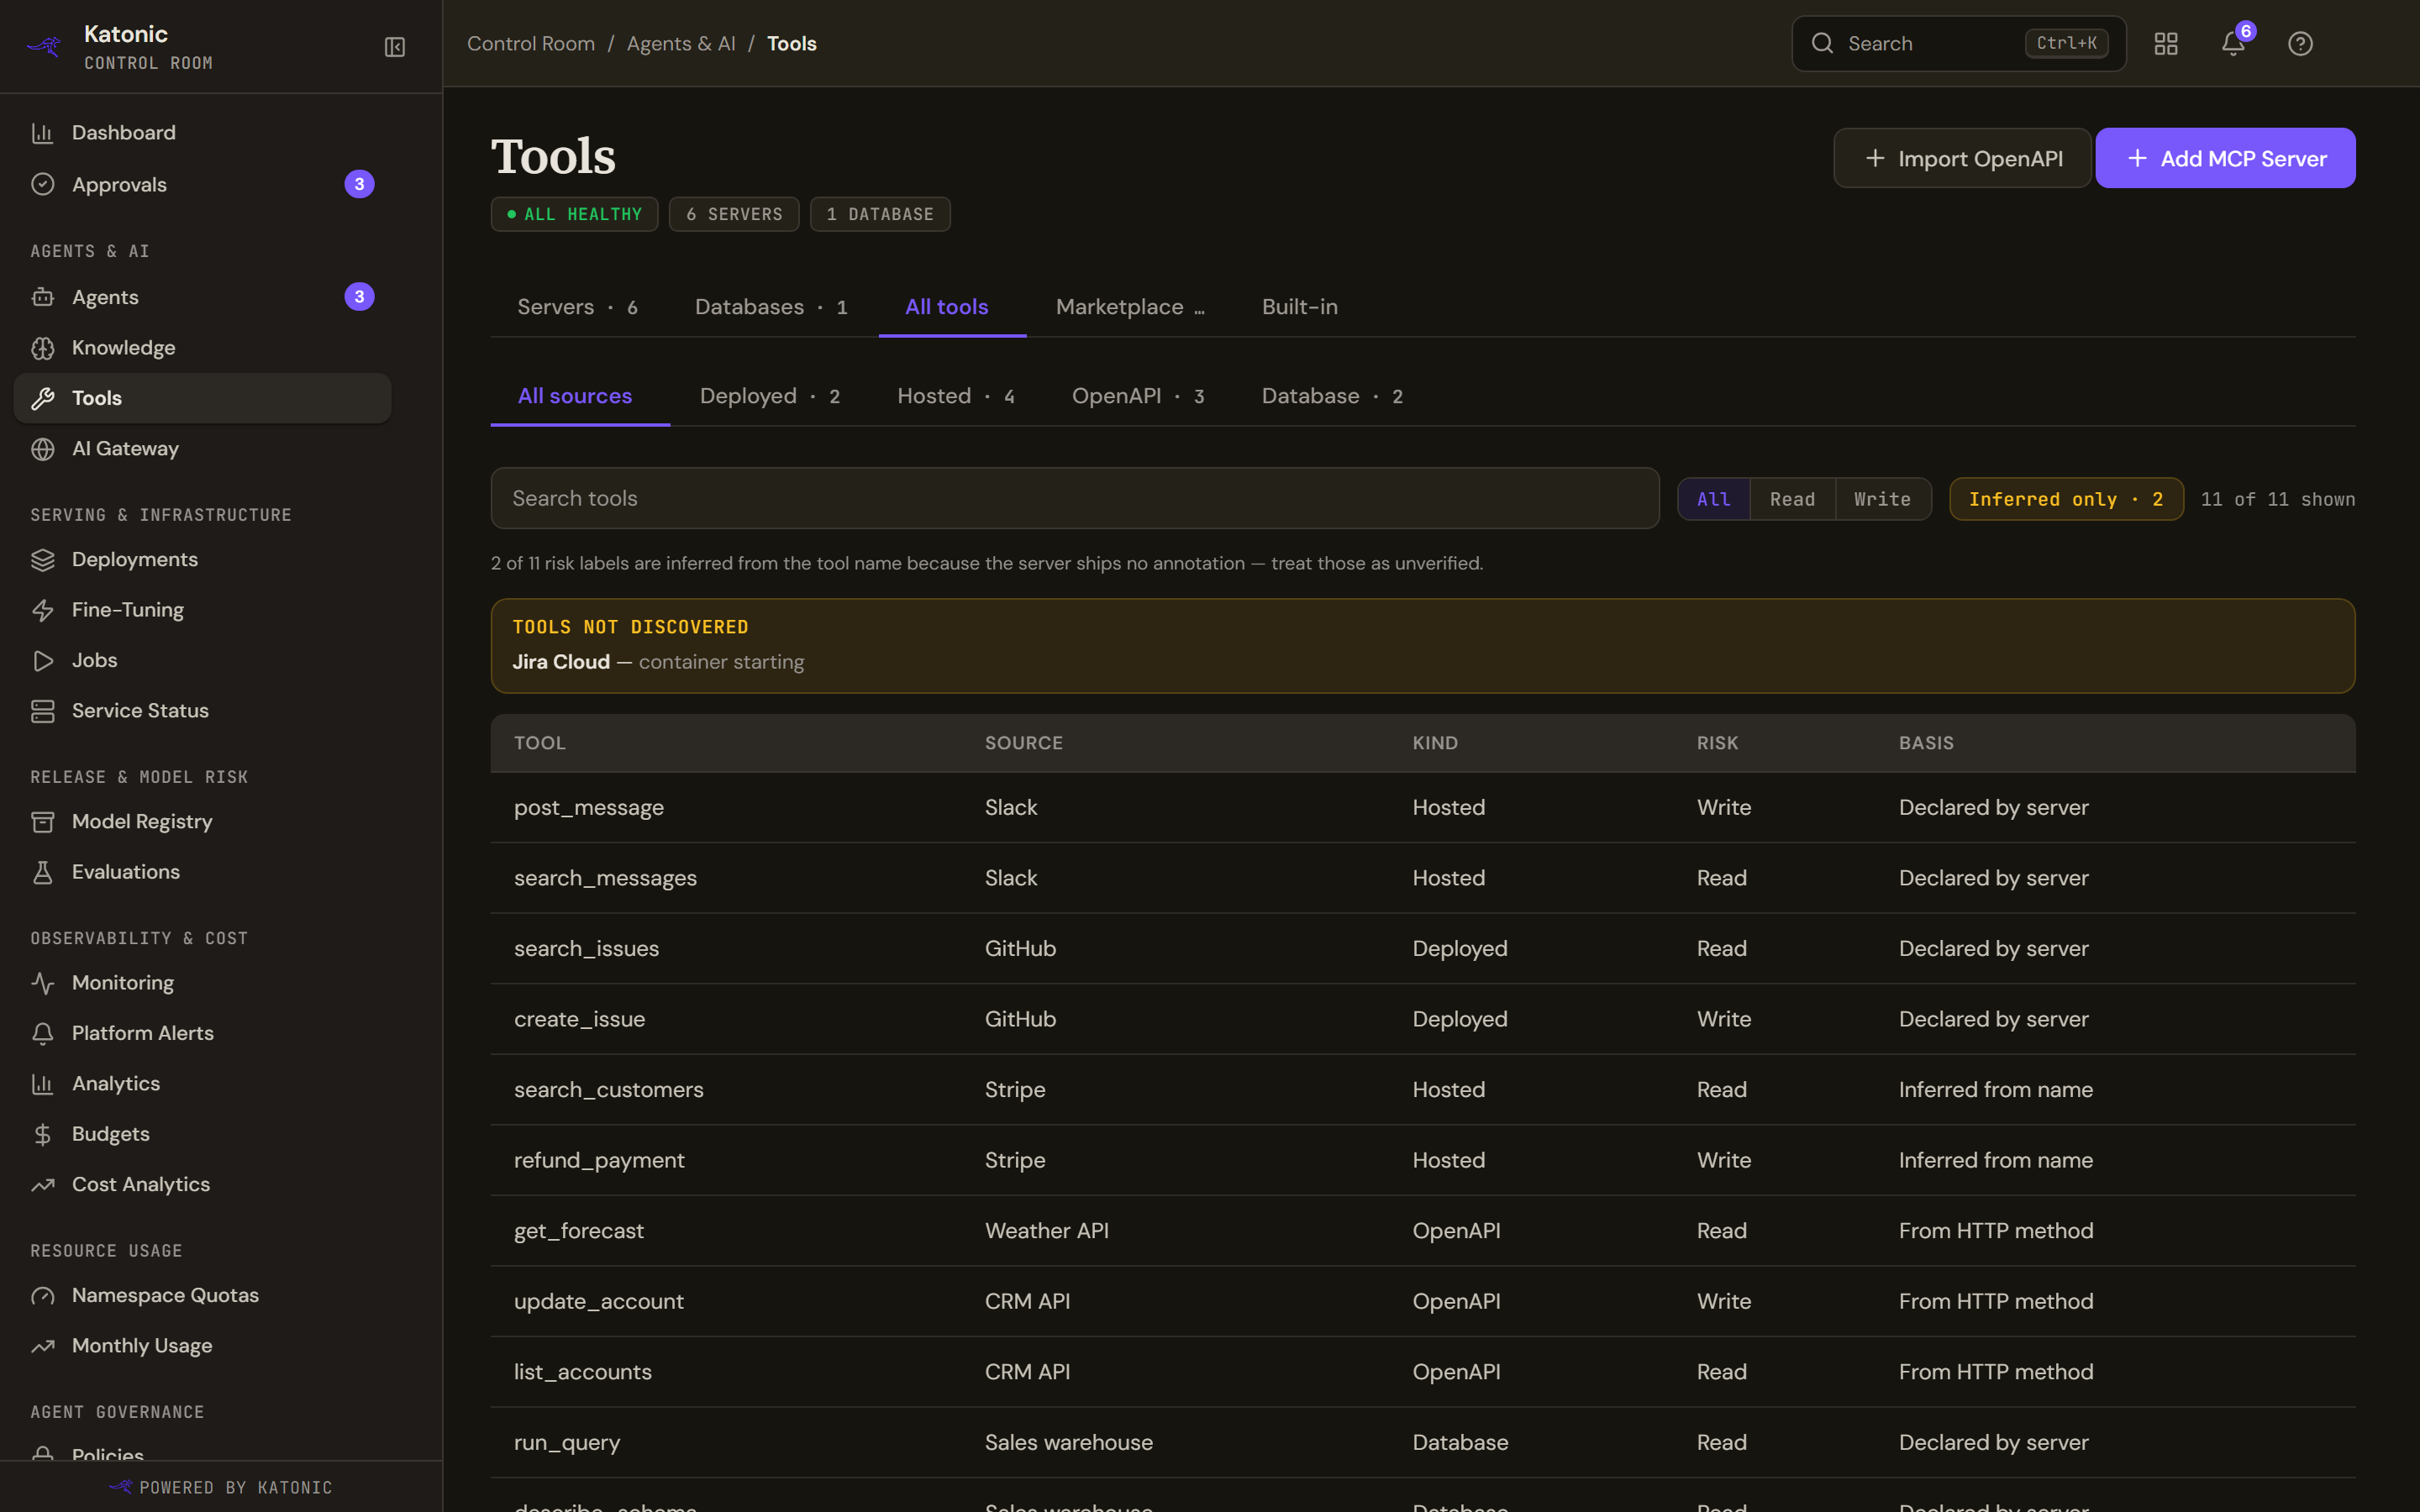
Risk is Read or Write. Basis says how the label was decided: Declared by server (the server's own tool annotations), From HTTP method (the verb of an OpenAPI operation) or Inferred from name (a guess from the name, used when a server ships no annotations). When any labels are inferred, a note counts them and an Inferred only toggle isolates them. A source whose tools could not be enumerated is listed under tools not discovered with the reason, never as a source with zero tools.
Server catalog
The Server catalog tab is the MCP catalog your tenant has synced from Ops Hub, the same list the Catalog zone shows under Tools. A link to the tab made when it was called Marketplace still opens it. Refresh Catalog pulls the current entries and reports the outcome in a notice, including a partial refresh that names how many entries were unusable, or an Ops Hub that returned nothing. The catalog loads the first time you open the tab, so until then its count in the tab strip reads ….
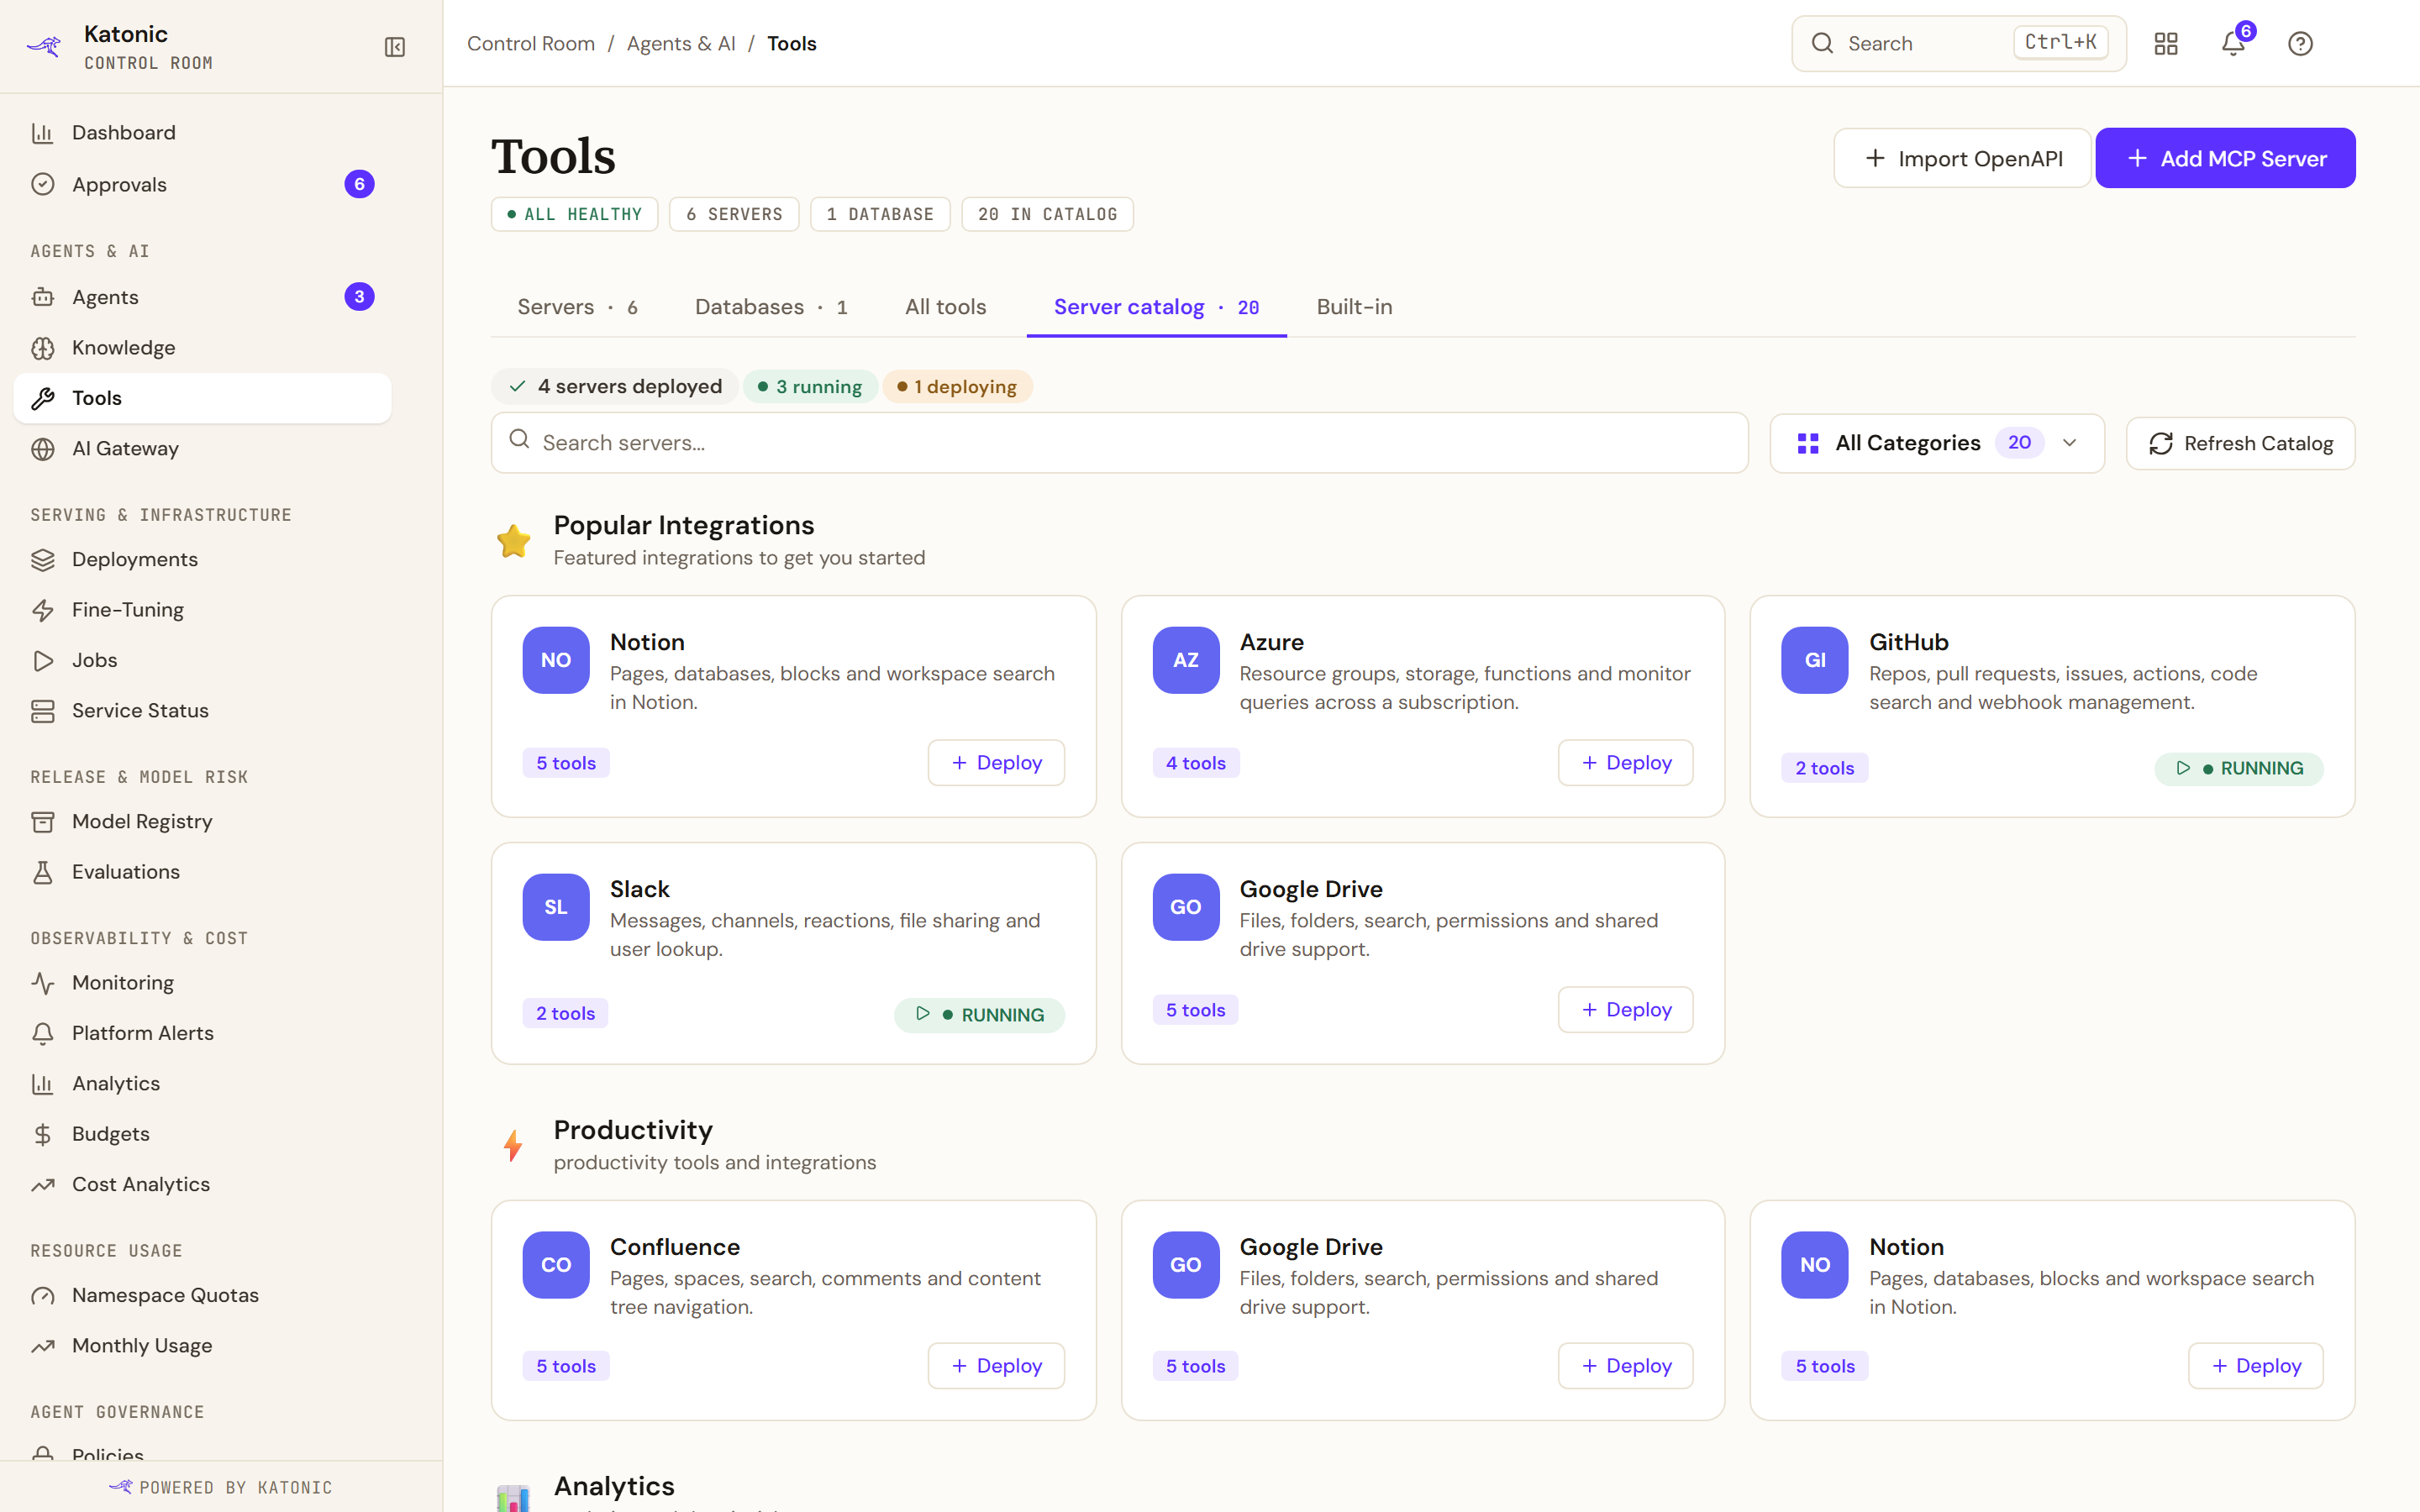
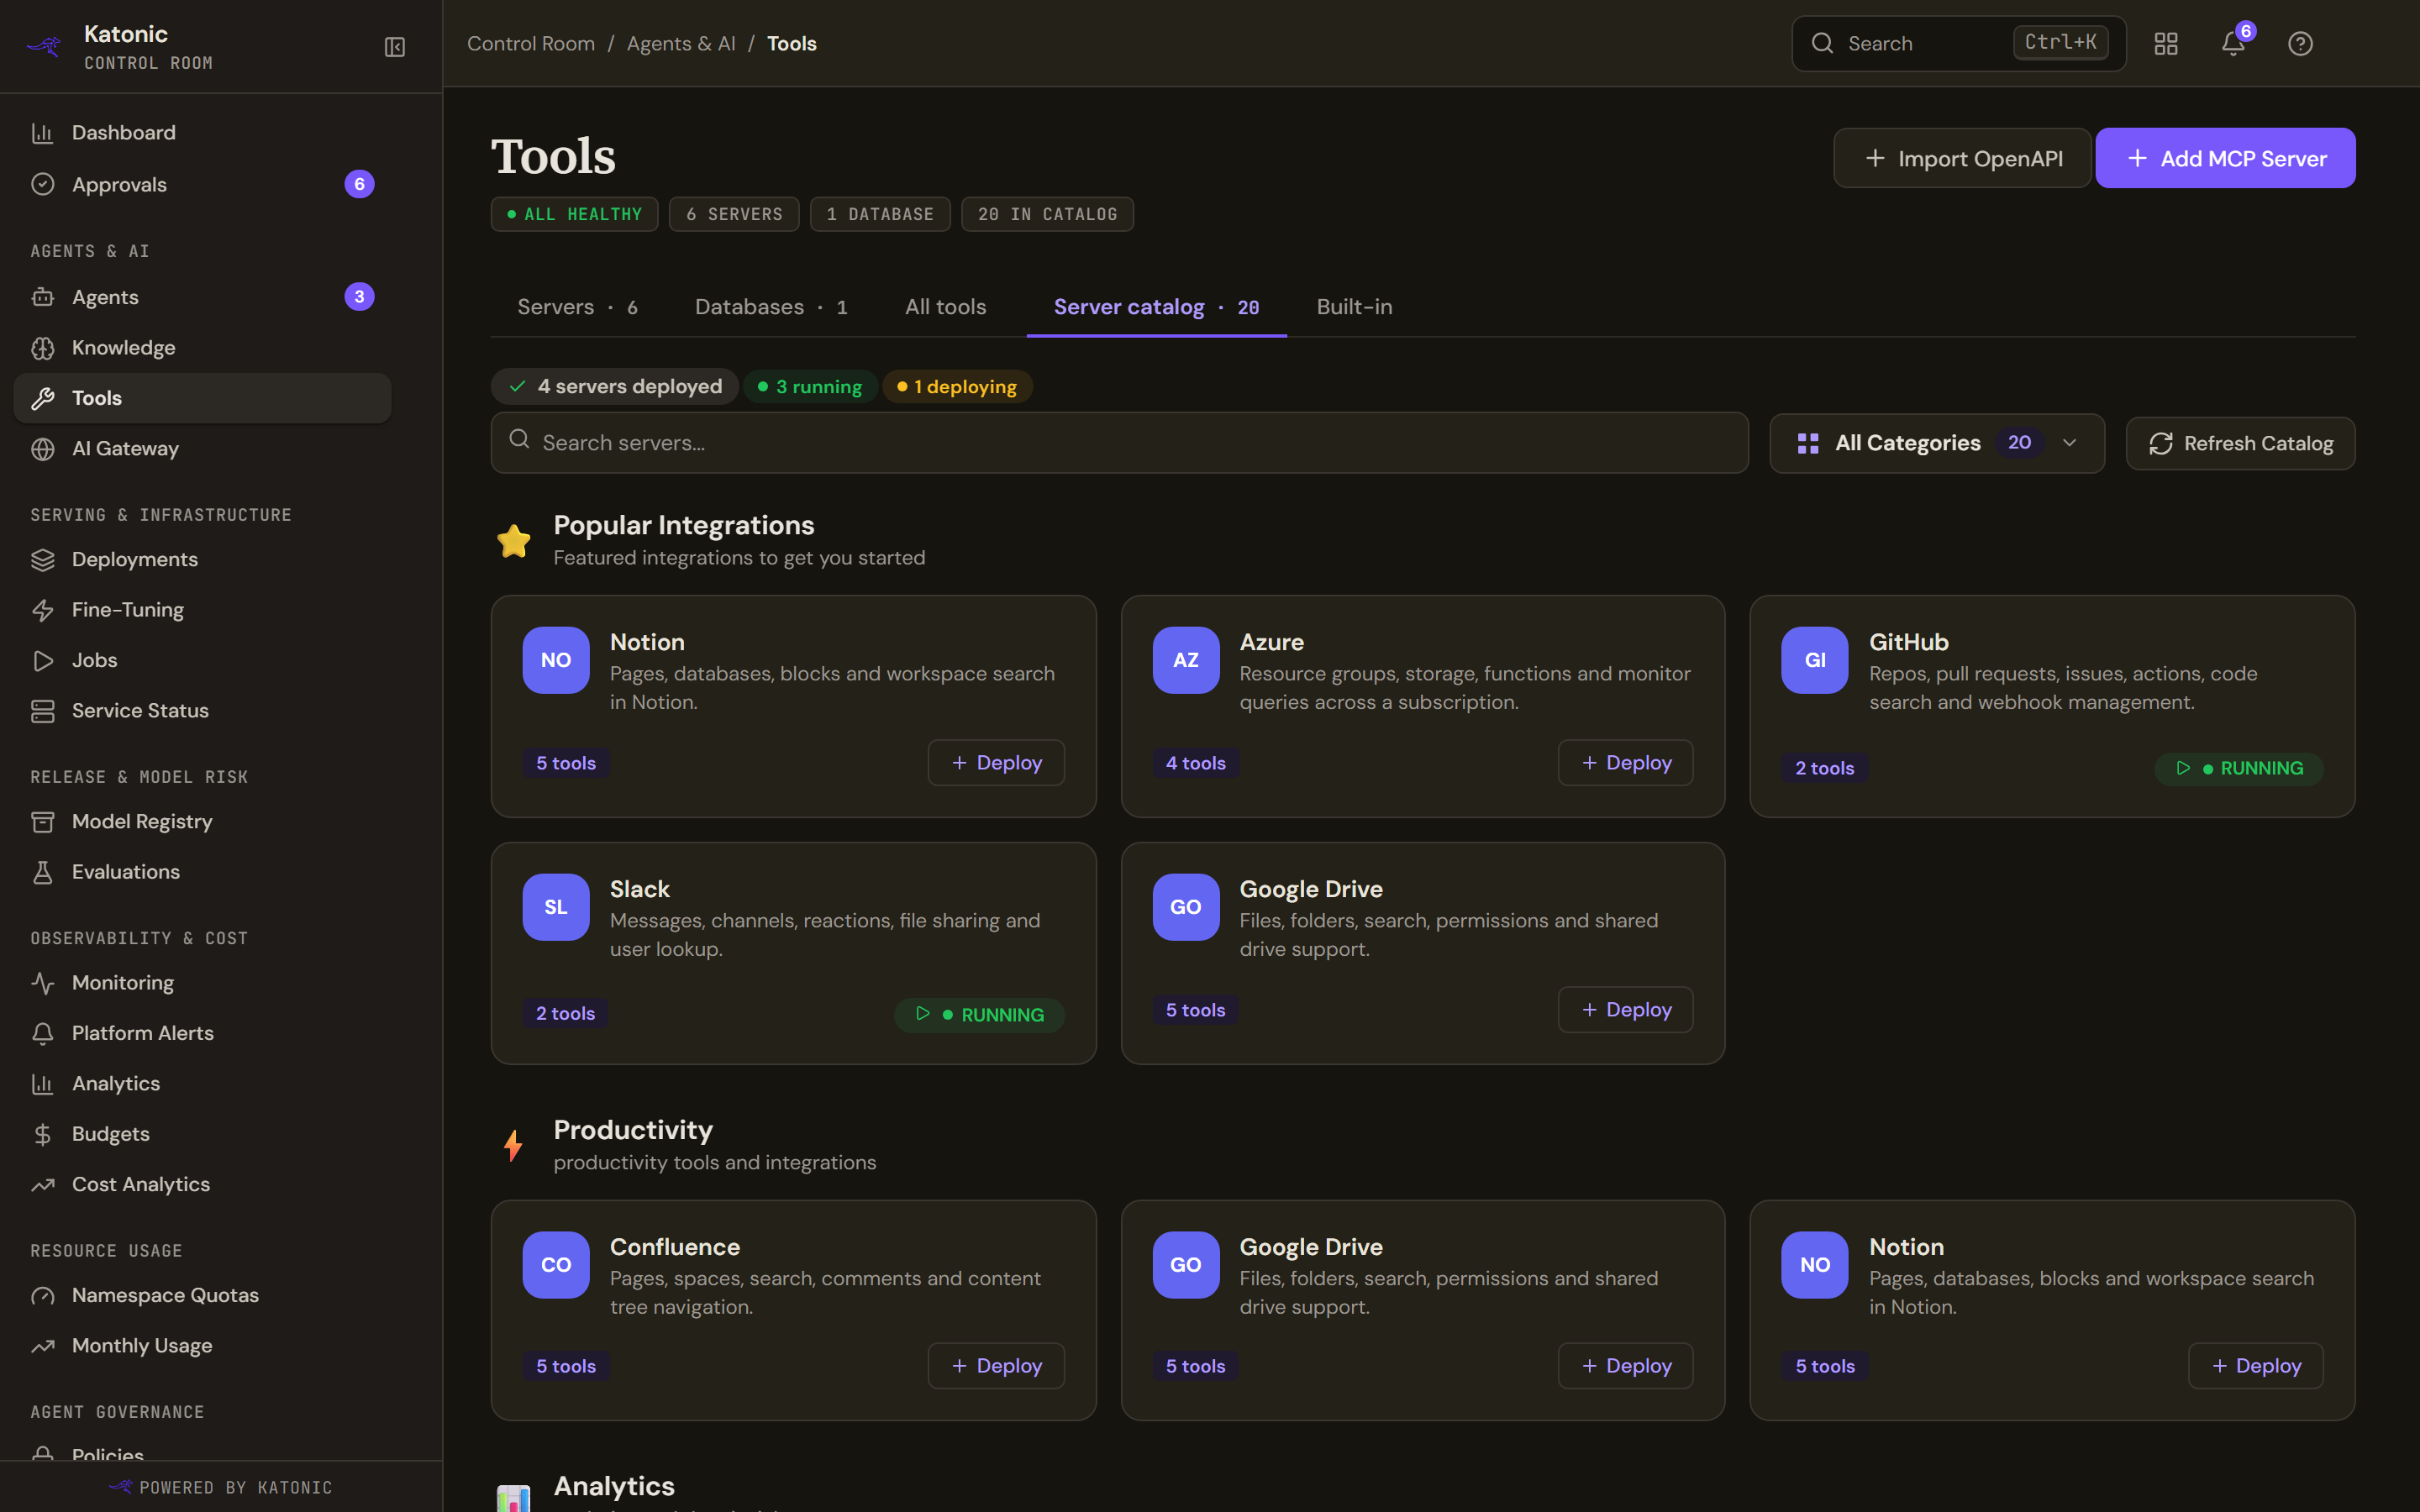
Entries are grouped by category, with a search box, a category picker and a Popular Integrations rail. Deploy on a card opens its configuration; a card already deployed shows its status instead. The tab says why it might be empty: MCP Catalog Empty asks you to refresh, Ops Hub Not Configured points to Platform Settings, and Couldn't load the MCP catalog means the catalog could not be read, not that it has no entries, and offers Retry.
Databases
Databases lists connections made with Connect a database. A card names the engine (Postgres, MySQL, Snowflake or BigQuery), counts its tools, shows READ-ONLY when only curated SELECT queries are allowed, and carries a status of ACTIVE, PROVISIONING, FAILED or DEACTIVATING.
Switch a built-in tool off
Built-in tools run inside Katonic and need no external service. On a deployment where one cannot work, for example Web Search without outbound network, an administrator turns it off with a reason instead of hiding it.
- Open the Built-in tab
The tab lists Date & Time, Code Execution, Web Search, Chat Completion, Artifacts, Document Generator and Rich Visuals, each with a description and a switch reading Available or Disabled.
- Disable the tool and give a reason
Select the tool's switch. It reads Disabled and a reason field appears with a default reason. Edit it to say what builders should know.
- Save
Select Save changes; Discard drops unsaved edits. A notice confirms Built-in tool availability saved, and the setting applies to the whole platform. In the agent wizard's Tools step the tool stays listed, locked and marked Unavailable with your reason, and an agent that still references it fails with that reason instead of hanging.
How tools reach agents
Builders attach tools in Studio. The agent wizard's Tools step lists the connected MCP servers and OpenAPI connections, the built-in tools under Function tools, and published agents that can be called as tools; a write action gets a human-approval gate by default. See Agents.
Limits and behaviour
- A failed read is never shown as an empty list: counts turn into a dash, the health chip says the tools backend could not be reached, and the Servers tab offers Retry.
- The server count leaves out platform-managed rows, the ones the platform runs behind each OpenAPI connection and each connected database; a chip discloses how many.
- Most MCP tools carry an inferred risk, so read the Basis column before relying on a label. Policies decide who may call which tools: see Govern the platform day to day.
- A server's Delete needs the tools delete capability; without it the control is disabled and reads You don't have permission to perform this action.
- When nothing is configured yet, the page opens on the Server catalog tab. Without the Catalog licence that tab is absent.