Binary Classification Model Monitoring
Binary classification model monitoring is the act of evaluating a binary classification model to ensure it performs as expected. This involves running tests to evaluate the performance of the model, such as accuracy metrics and errors in predictions. It also includes checking for any potential issues with the data inputs used in training or testing the model, such as imbalanced classes or missing data points. By monitoring the models, businesses can quickly identify any potential problems or areas of improvement and take corrective action to improve their model’s performance. This in turn helps them achieve better results from the machine learning models they deploy to solve their business problems. Monitoring the models ensures that these powerful algorithms are used correctly and effectively to drive the best results for a business. With careful and regular monitoring, businesses can ensure their models are updated regularly to reflect changes in their data or the environment they are being applied to.
Katonic Model Monitoring System provides:
- Built-in Model Monitoring
- Automated Retraining
How Access the Monitoring System
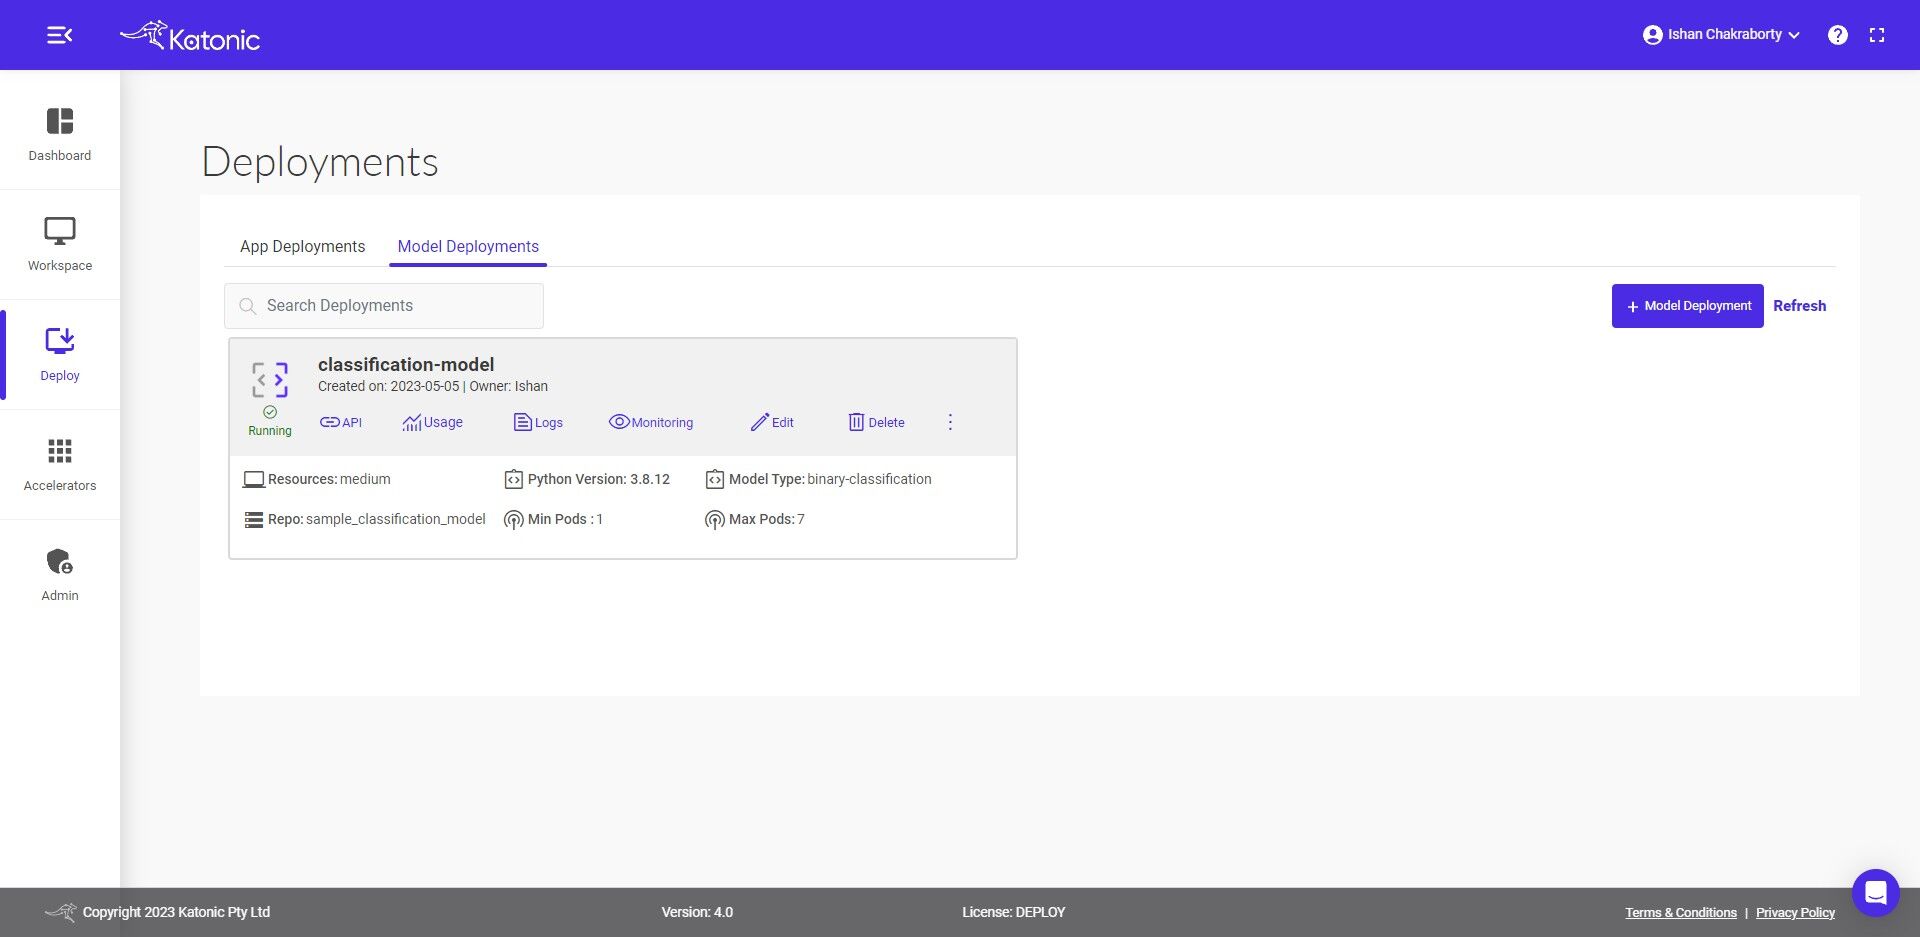
Once you deploy your classification model by selecting the model type as Binary classification, then follow the below steps to monitor the system.
- Navigate to the Deploy section from the sidebar on the platform.

- Click on ‘Monitor’ to monitor the effectiveness and efficiency of your deployed model.
In the Katonic Model Monitoring system, which opens up in a new tab, you can get real-time insights and alerts on model performance and data characteristics. You can also debug anomalies and initiate triggers to execute ML production pipelines to retrain the models with new data, depending on your use case.
In the Dashboard, we provide a total of 14 metrics, 3 operational and 11 models based on real-time feedback, these metrics are:
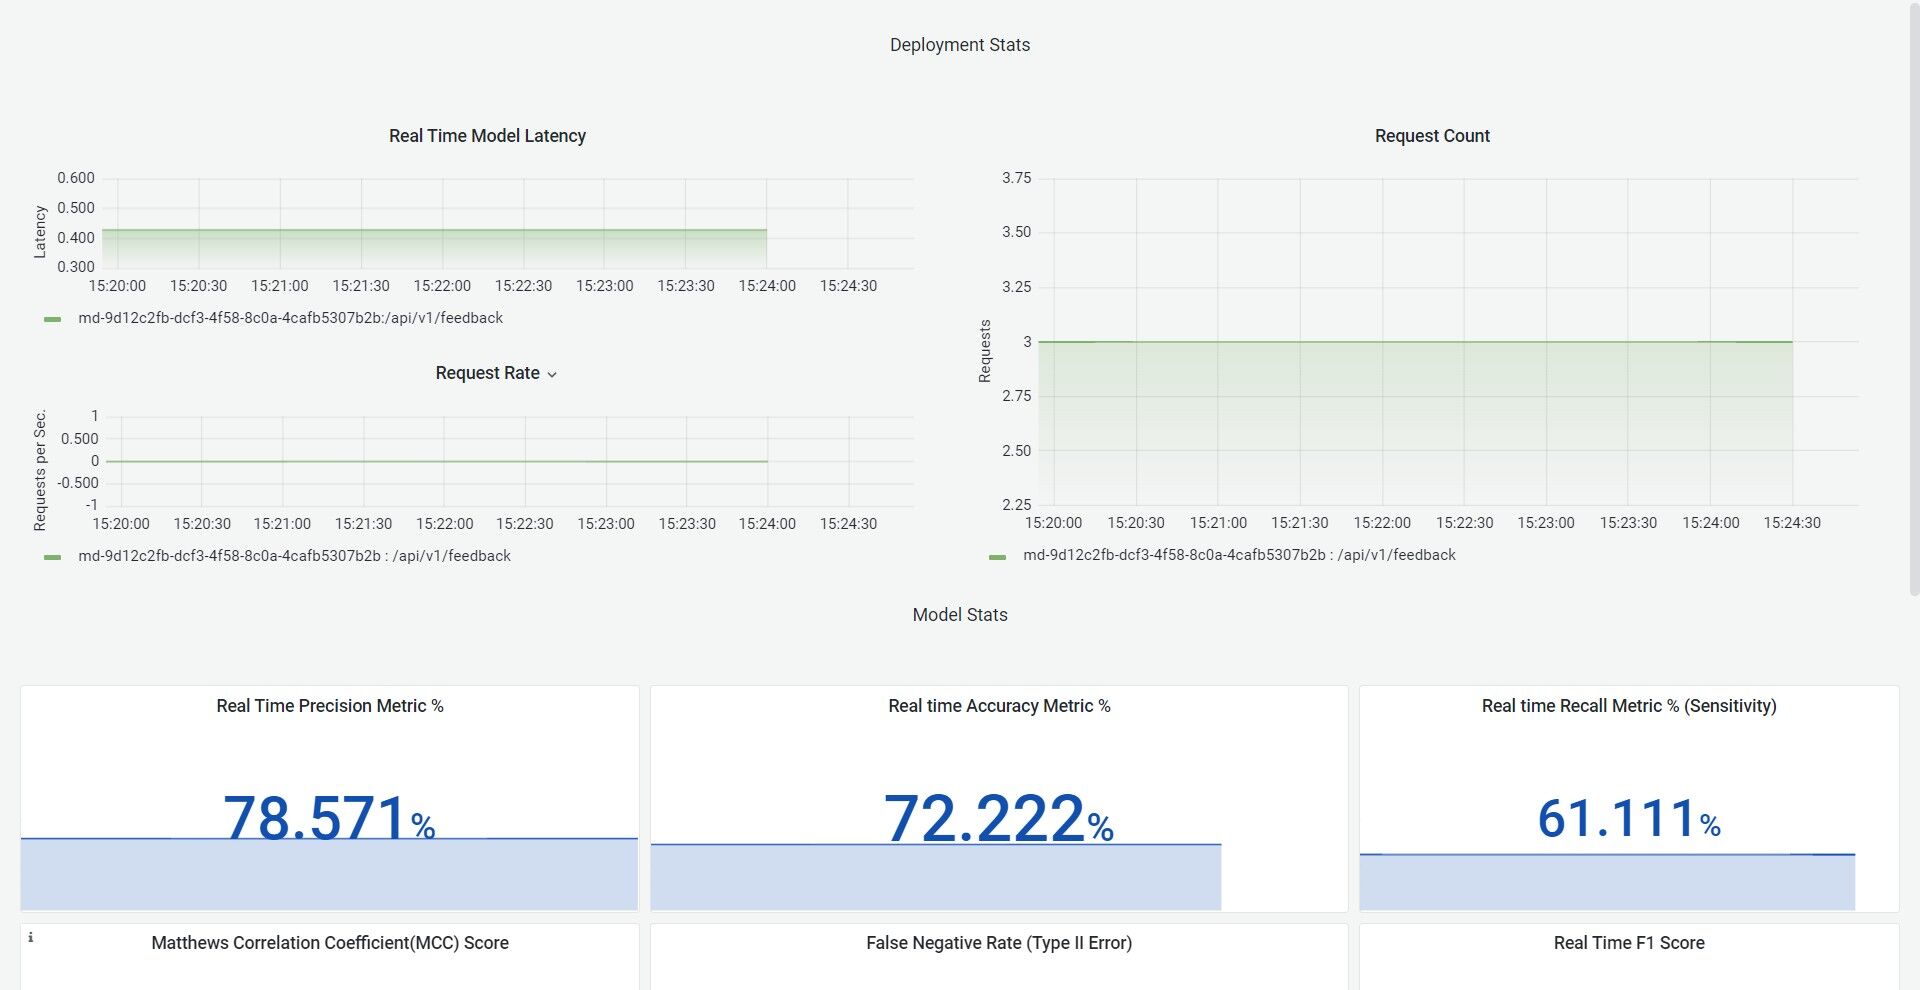
Operational :
- Real-time request latency
- Real-time request rate
- Real-time request count
Binary Classification Monitoring Metrics
Recall Score:
The recall is the ratio tp / (tp + fn) where tp is the number of true positives and fn the number of false negatives. It is a metric used to measure how accurately a model can predict an instance of a class. This metric helps to identify models that are better able to accurately predict the class of a given instance. The recall is intuitively the ability of the classifier to find all the positive samples. The best value is 1 and the worst value is 0. It is especially important for classification tasks that require high accuracy, such as medical or security applications. In these cases, it is essential to identify models that can accurately predict the correct class in order to prevent incorrect predictions from resulting in harm.
Precision Score:
The precision is the ratio tp / (tp + fp) where tp is the number of true positives and fp is the number of false positives. The precision is intuitively the ability of the classifier not to label as positive a sample that is negative. The best value is 1 and the worst value is 0. The Precision Score is a metric used to measure the quality of a model’s predictions. It measures the proportion of true positives among all positive predictions made by the model, with higher values indicating more accurate results. In a classification task, the precision score compares the number of correctly classified instances (true positives) to the total number of instances that the model classified as positive (true positives + false positives). Ideally, the precision score should be as close to 1.00 as possible, indicating that all correctly classified instances were identified by the model.
F1 Score:
The F1 score combines the precision and recall of a classifier into a single metric by taking their harmonic mean. It is primarily used to compare the performance of two classifiers. The F1 score ranges from 0 to 1, where a higher score indicates better performance. Suppose that classifier A has a higher recall, and classifier B has higher precision. It is especially useful when dealing with highly imbalanced datasets or when there are many classes to consider (multiclass classification).
Accuracy:
Accuracy is one metric for evaluating classification models. Informally, accuracy is the fraction of predictions our model got right. The higher the accuracy score, the better the model is performing. Accuracy scores can range from 0 (no correct predictions) to 1 (all correct predictions). They are most commonly used in classification models, where the goal is to accurately determine which class a certain observation belongs to.
False Negative Rate (Type II Error):
False Negative Rate, also known as Type II Error, is a statistical measure of how often the test fails to correctly identify individuals who have a condition. It is the opposite of the False Positive Rate. The false negative rate is calculated by dividing the number of false negatives by the total number of people with a condition (true positives plus false negatives). A false negative rate of 0% means that the test correctly identifies all individuals with the condition while a false negative rate of 100% indicates that the test always incorrectly identifies individuals without the condition. A low false negative rate is desirable because it will reduce the number of people who are falsely identified as having a certain condition, allowing for fewer costly and unnecessary treatments or tests.
False Positive Rate (Type I Error):
False Positive Rate (Type I Error) is a type of error that occurs when a null hypothesis is rejected despite it being true. This means that the test incorrectly states that there is an effect or difference between two groups when in reality there isn't. False positives can be caused by a variety of factors such as low statistical power, inadequate sample size, data collection errors, and more. It is important to understand the false positive rate in order to avoid making incorrect decisions based on erroneous test results. False positive rates can be reduced by increasing sample sizes, using appropriate statistical tests, or setting a higher threshold for rejecting the null hypothesis. By understanding the false positive rate and adjusting research methods accordingly, researchers can ensure their results are accurate and reliable.
Real-Time F2 Score:
The F2 Score is an important metric used to measure the performance of a machine learning model. It combines both precision and recall in one measure and allows us to easily compare different models. The F2 Score is calculated by taking the harmonic mean of precision and recall, which means that it gives more weight to low values than the regular arithmetic mean. This makes the F2 Score more suitable for evaluating models that have an uneven class distribution. It is also helpful when there is a high cost associated with false positives or false negatives. The F2 Score ranges from 0 to 1, with a higher score indicating better performance. Ideally, the F2 Score should be as close to 1 as possible.
True Negative Rate (Specificity):
The true negative rate (TNR) is a measure of how accurately an algorithm or model can identify negative test results. It measures the proportion of true negatives out of all negatives in the test set. In other words, it's the percentage of real negatives that were correctly identified by the model. A TNR of 100% means that all negative test results were correctly identified, while a TNR of 0% means that none of the negative test results were identified. A higher true negative rate is desirable as it indicates that the model is better at identifying negatives accurately. In addition, a high TNR can help reduce false alarms and improve overall accuracy.
Negative Predictive Value:
Negative Predictive Value (NPV) is an important measure used to evaluate the accuracy of a diagnostic test. It refers to the likelihood that someone has a disease given a negative result on the test. In other words, it is the probability that those who are tested and found to be negative actually do not have the condition in question. Generally, NPV is considered to be the most useful measure of diagnostic accuracy.NPV is calculated by dividing the number of true negatives (people who have a negative test result and actually do not have the disease) by the total number of patients tested. The higher this ratio, the greater the accuracy of the test in correctly identifying those without the disease.
False Discovery rate:
The False Discovery Rate (FDR) is a statistic used to control the number of false positives when conducting multiple hypothesis tests. It allows researchers to obtain accurate results while controlling the rate of false positive findings. FDR works by setting a threshold for rejecting a null hypothesis, which limits the rate of falsely rejected hypotheses. This threshold can be adjusted depending on how confident researchers are in the accuracy of their findings. For example, if a researcher is very confident in their findings, they may choose to set a lower threshold for rejecting the null hypothesis and thus have higher chances of finding true positives while accepting a greater rate of false positives. On the other hand, if the researcher is less confident in their findings, they may choose to set a higher threshold, which would limit the rate of false positives while reducing their chances of finding true positives. By setting an appropriate FDR threshold, researchers can ensure that their results are both accurate and reliable.
Matthews Correlation Coefficient(MCC) Score:
The Matthews Correlation Coefficient(MCC) Score is a measure of the quality of binary classification models, and it helps to identify how well a model is able to distinguish between two classes. The MCC score ranges from -1 to +1, where values closer to 0 indicate an overall weaker correlation between predicted and observed class labels, while values closer to +1 indicate a stronger correlation. In other words, the higher the MCC score, the better the model is at predicting class labels correctly. An important feature of this metric is that it takes into account false positives and false negatives, which makes it an ideal metric for measuring performance in imbalanced datasets where one class is much more frequent than the other. Additionally, it is not affected by changes in class distribution, which makes it a reliable metric even when there are large changes in predicted and observed labels. Ultimately, this metric can help to provide an overall measure of model performance, as well as aid in parameter tuning and model selection.
For Feedback input:
{
  "predicted_label":[1,1,1,1,0,0,0,0,1,0,1,0],
  "true_label": [1,1,0,1,0,1,0,0,1,0,1,0]
}