Cost Insights
LLM Cost Management Overview
Note: Administrator privileges are necessary to access the cost management modules on the platform.
Cost Tracking The Katonic LLM Cost Management feature facilitates efficient monitoring of resource consumption and associated costs across diverse functionalities. Users can gain insights into the financial aspects of operations involving Embedding, Chat, Extract, Summarize, Generate, Classify, and Multimodal functions.
Resource Optimization Optimizing resource usage is at the core of this feature. Users can leverage cost insights to enhance efficiency and reduce unnecessary expenses, ensuring a streamlined and cost-effective LLM deployment.
Usage Insights Gain valuable insights into LLM usage patterns, empowering users to make informed decisions on resource allocation. These Usage Insights operate at different levels: Project-level, User-level, and Model-level, offering a nuanced understanding of resource utilization.
To access the Cost Insights dashboard, follow these steps:
Login to Katonic Generative AI Platform:
Log in to your Katonic Generative AI platform account using your credentials.
Navigate to the Admin Section:
Once logged in, click on the 'Admin' section in the platform's interface.
Select Cost Insights Board:
Within the Admin section, locate and select the 'Cost Insights' board.
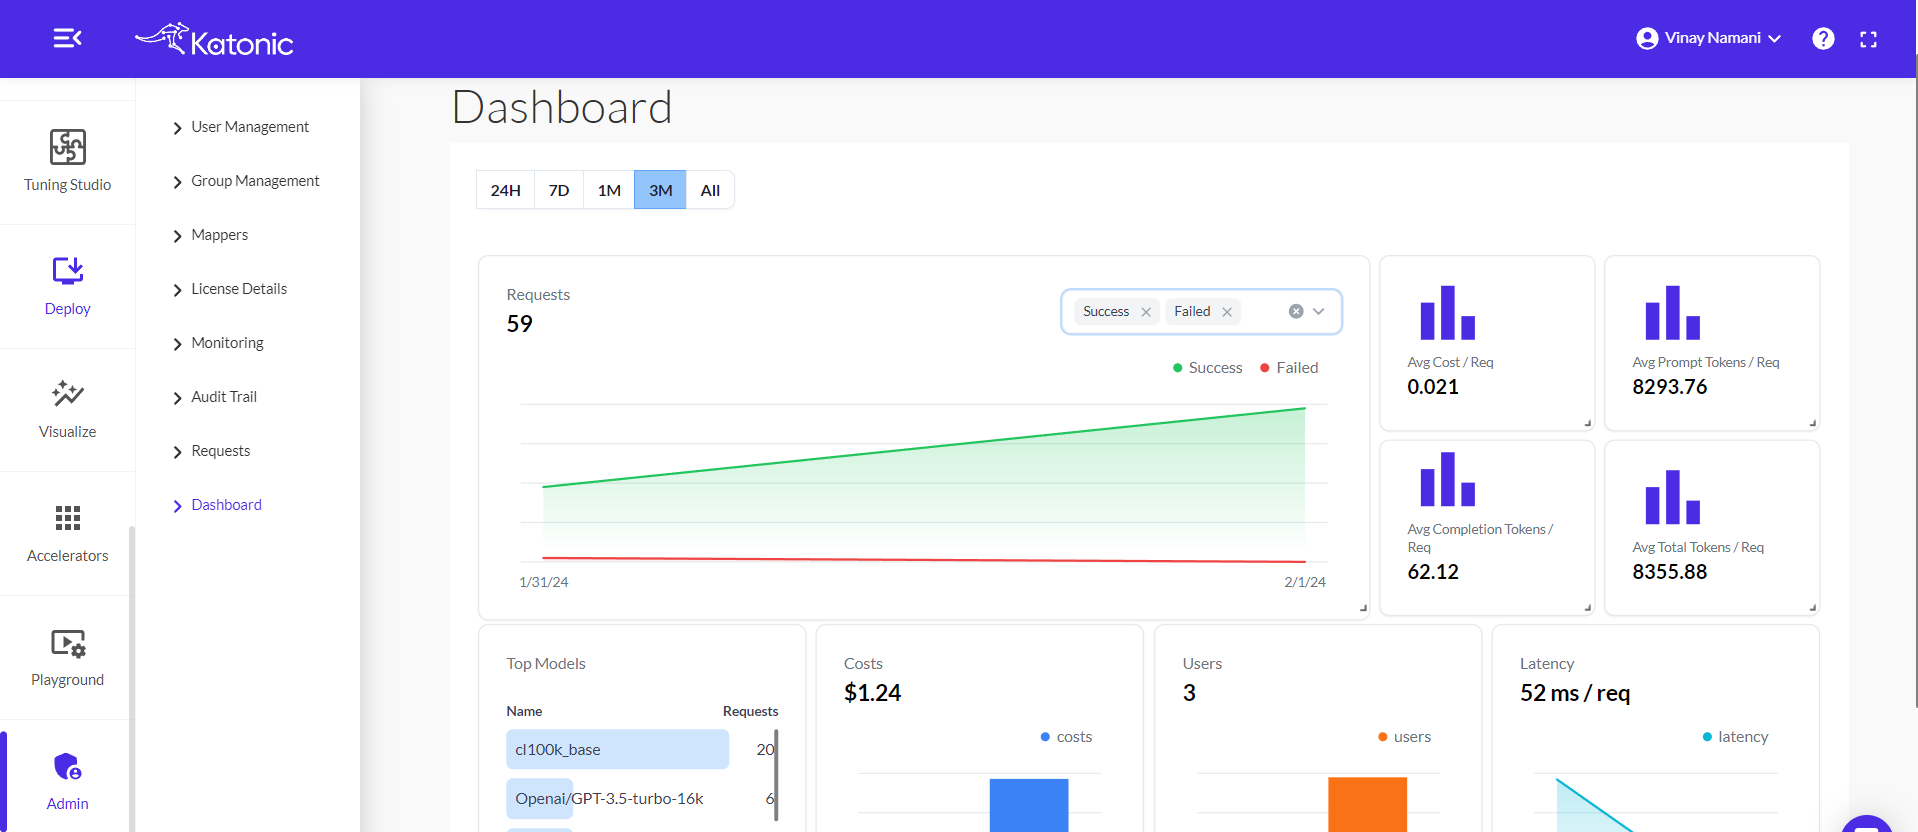
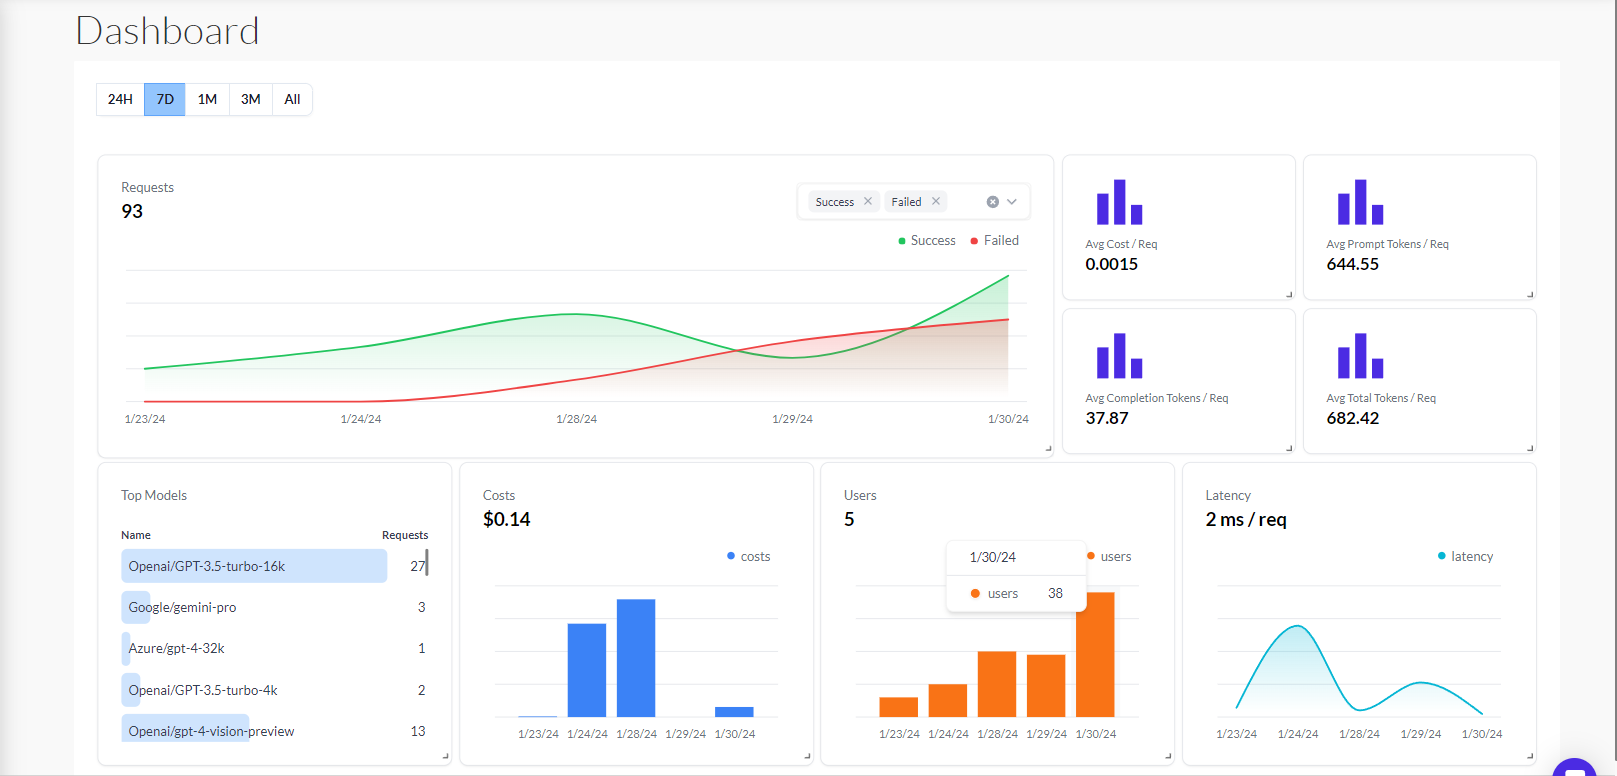
Cost Insights Dashboard
The following insights will be available in the dashboard.
Time Filters for Flexibility: Empower decision-making by filtering data for 1 day, 7 days, 1 month, 3 months, or all time.
Visualizing Request Outcomes: A graph showcases the number of both failed and succeeded requests, offering insights into overall system performance.
Cost Efficiency at a Glance: Understand financial implications with the display of average cost per request within the selected time period.
Token Efficiency Metrics: Gain insights into user interactions by exploring the average number of prompt tokens per request.
Completion Tokens Analysis: Evaluate model performance through the average number of completion tokens per request.
Comprehensive Token Usage: A breakdown of the average total tokens per request provides a holistic understanding of resource consumption.
Model Utilization Statistics: A bar graph visually depicts how frequently each model has been utilized within the specified time frame.
Cost Distribution Over Time: Explore the dynamic distribution of costs over different time periods through an insightful bar graph.
Latency Insights Over Time: A dynamic line graph presents a visual representation of request latency, aiding in performance assessment.