Analytics in Studio
Studio's Analytics answers one question in five views: what did my work cost and how well did it run. It is a personal view by default, not the organisation's, and that distinction changes every number on the page.
Who can use it: anyone who can open Studio sees their own work. Wider scopes need a grant or an administrator role.
Recorded on .
Analytics in four steps
The video above walks the page; the pages under What to read where go deeper on each tab.
- Set the scope and the range
Scope is My work, My team or Organization, opening on the widest one you are entitled to; Range is the last 7, 30, 90 or 180 calendar days in UTC, and every delta compares the range against the same number of days before it. Copy link carries range, scope and tab together; nothing polls until you press Refresh; Export writes every section as CSV.
- Read the Overview
Six tiles give agents used, deployments, fine-tune jobs, apps in production, LLM calls and spend against the prior period, and each tile is a door to the view that answers it. Where your time and money went stacks spend by category across the range.
- Read the agents
The Agents matrix gives each agent its calls, p95 latency, errors, cost, evaluation pass rate, trend, sparkline and status; My comparison decisions sets predicted against actual lift, and Failure patterns groups failures by theme.
- Check the resources
Deployments gives each LLM deployment a card with health, load, latency, cost and a right-sizing verdict. Fine-tuning plots each job's cost against its evaluation lift. Apps & Jobs lists your apps in production and your batch jobs with their success rate.
The page
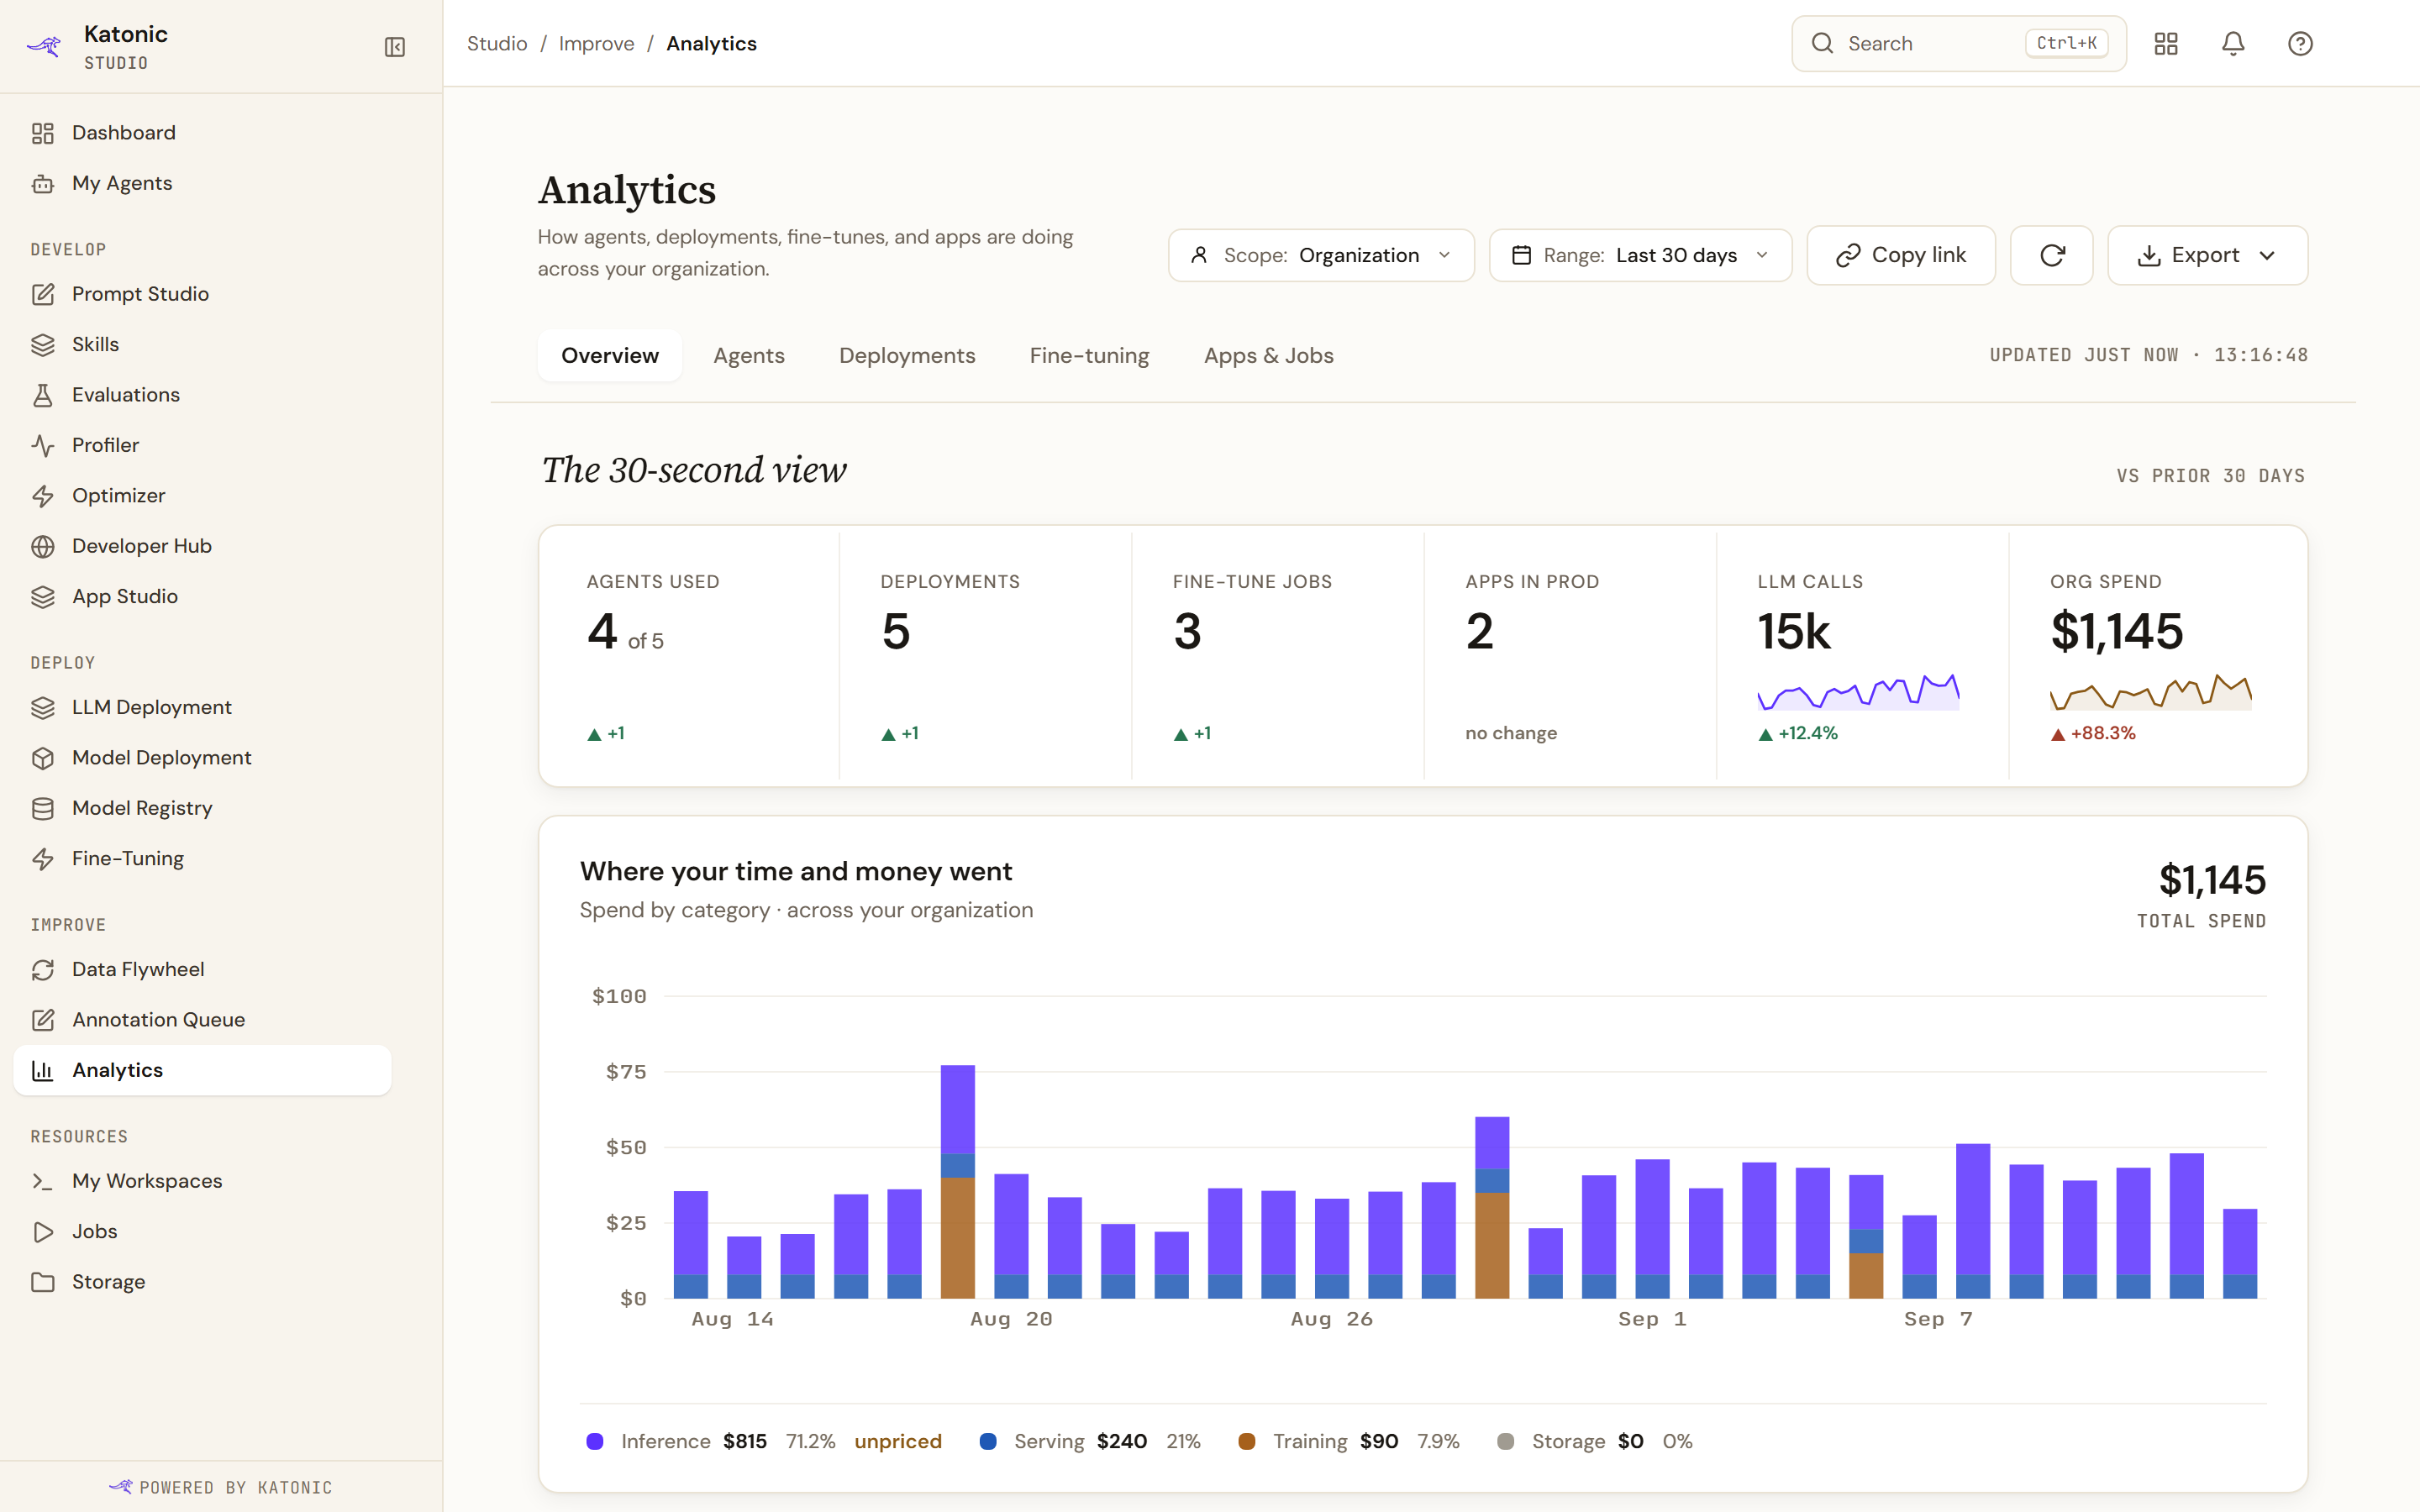
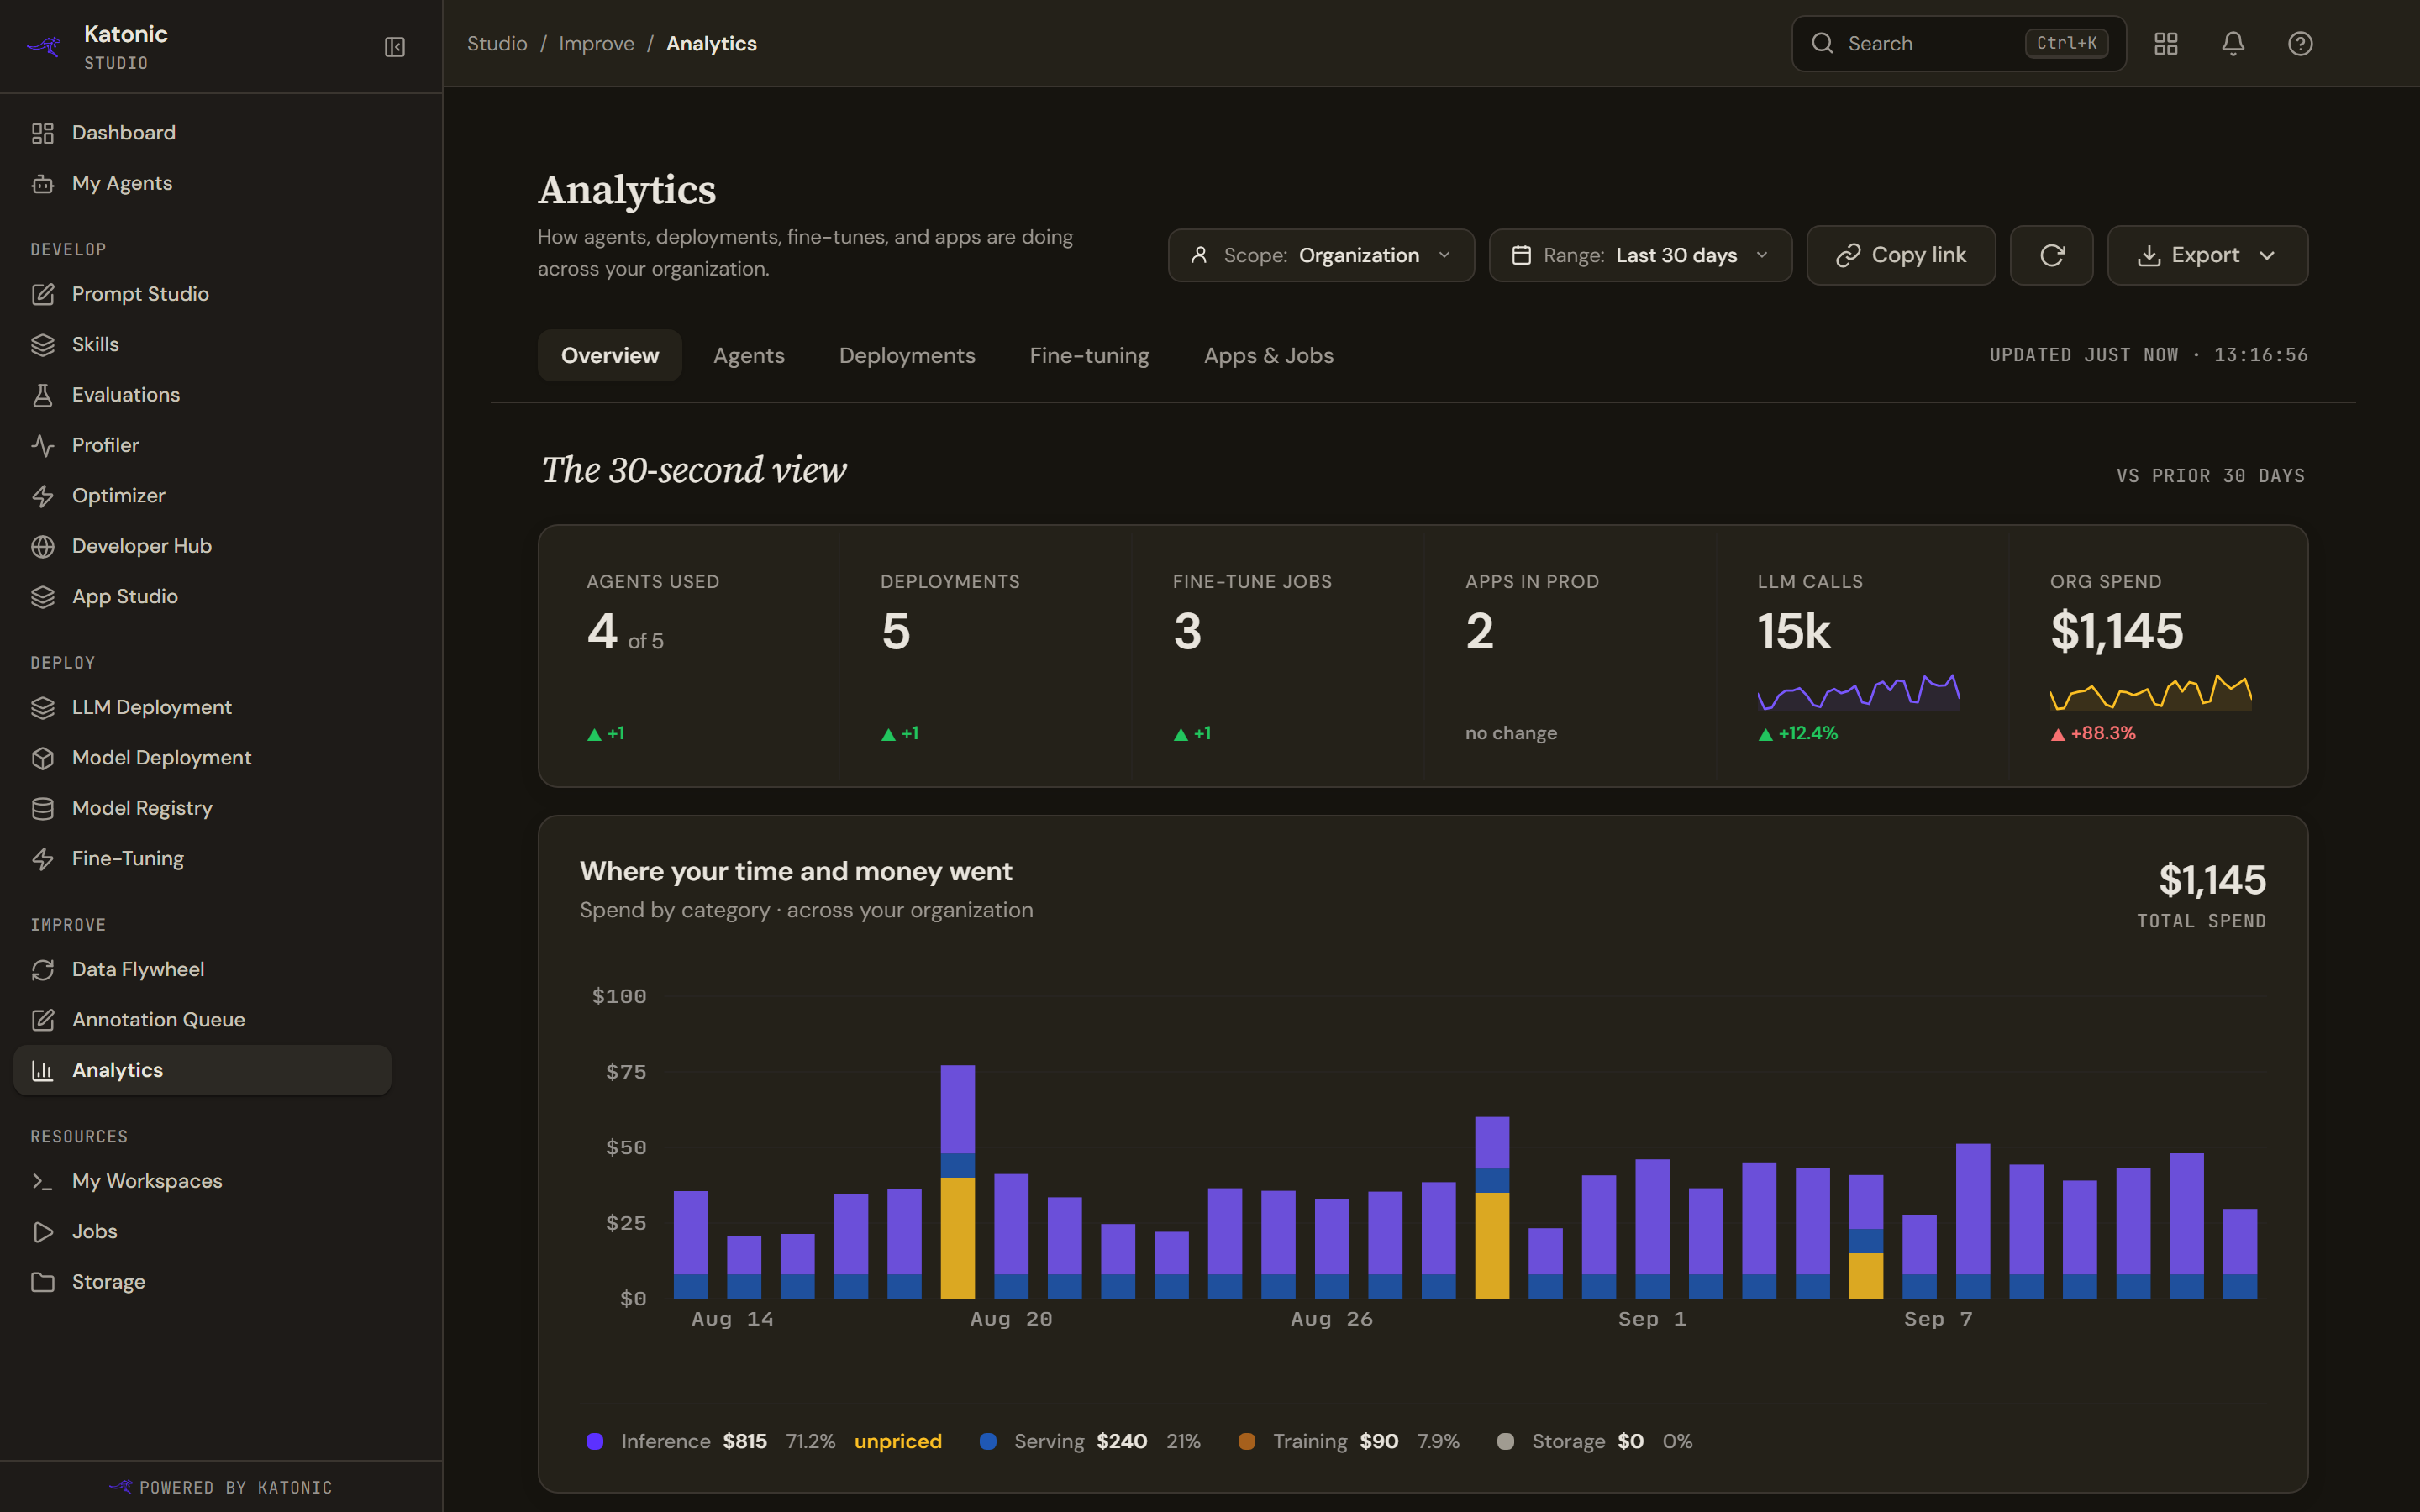
Five tabs sit under the header: Overview, Agents, Deployments, Fine-tuning and Apps & Jobs. One is loaded at a time, and each fetches its own data, so a section that fails does not take the page with it.
Above them are the controls that change everything below: a scope, a range, a refresh and an export.
Scope
| Scope | What it covers | Who gets it |
|---|---|---|
| My work | The agents, deployments, jobs and apps you own | Everyone |
| My team | Your team's agents | An administrator, or the Auditor grant |
| Organization | The whole tenant | An administrator |
The page opens on the widest scope you are entitled to: an administrator lands on the organisation, someone with the Auditor grant on the team, and everyone else on their own work. Where you have only one, the picker is a disabled chip.
Team scope has a real limit worth knowing before you read anything into it. Deployments, fine-tunes and apps have no team dimension in the platform at all, so in team scope those three tabs quietly stay on your own resources. The page says so in a note rather than leaving you to infer it.
The server checks the scope again for itself. Asking for a scope you are not entitled to quietly returns the narrower one rather than an error.
Range
Last 7 days, Last 30 days, Last 90 days or Last 180 days, defaulting to thirty. A range is that many whole calendar days in UTC, ending today and including today so far: on 5 October, Last 7 days runs from 29 September at 00:00 UTC until now. Every tab, every delta and Export use that one window.
Every delta compares the range against the same number of whole days just before it. Early in a UTC day a delta can read low, because today is still partial. A figure whose previous window was zero reads new, with the previous value on hover.
The address and Copy link
The range and the scope are both kept in the address. Picking a scope updates it without adding an entry to your browser history, so a reload or a pasted link reopens the same range and scope. An address naming a range that does not exist falls back to thirty days, and a scope you are not entitled to is ignored in favour of your default.
Copy link copies a link carrying the range, the scope and the tab together, and a "Link copied" chip shows under it for about two and a half seconds. If the browser refuses the clipboard, the page says "Could not copy. The address bar carries the range, scope and tab." Copy the address yourself.
Following a number
The Overview's tiles and the Agents matrix's cells are doors: selecting one opens the tab, page or Control Room view that answers it, carrying the range you are on and, from a matrix row, the agent.
Beside every tile and every matrix heading, an information affordance gives that number's definition: what it measures, its unit, the window it uses, where the platform reads it from, how scope applies to it and any caveat.
Refresh
Nothing polls. The page loads when you open a tab and does not change again until you press Refresh, which reloads every tab you have visited rather than only the one in front of you. A line beside the tabs says how long ago the data was fetched.
A refresh that fails keeps the figures you already had and says it could not refresh, rather than blanking them.
Export
Every section exports as CSV, taken from the server rather than from what is on screen, and the file names its scope. The column names in the file are the raw field names, not the headings in the table.
The two charts, the spend bars and the fine-tune scatter, also export as PNG. Nothing else does: the cards and tiles are ordinary page elements with no image behind them.
What to read where
Before there is anything
A tenant with no agents at all gets Nothing to analyze yet and a button to create the first one. That is different from a range with no activity, which shows the empty text for each section instead.