Evaluations
Evaluations
Evaluations, under Develop in Studio, measures an agent the same way every time: a dataset of questions with expected answers, one agent version, and evaluators that score every row. Runs are kept, can be scheduled and can be compared, so a change to a prompt or a model shows up as a number rather than an impression.
Who can use it: the Builder role or higher, in a tenant licensed for evaluations. Administrators see every run in the Control Room's Evaluations page.
Recorded on .
Evaluations in four steps
The video above walks the hub; the pages under Related go deeper on each part.
- Read the runs list
The header counts the runs and carries Schedules and Datasets, Import dataset and New evaluation. Four figures cover the week: average overall score, pass rate, active runs and cost. Each row is one run with its agent, dataset, overall score, the change against the previous run, evaluators, status, timing and the reason it failed. The chips All, Mine, Scheduled and Failed and the filters by agent, dataset, evaluator and time window narrow the list.
- Compare two runs
Compare 2x turns the list into a chooser; pick exactly two runs and the bar offers them side by side, with the overall score against the pass threshold, what changed between them and the deltas per evaluator. Schedules holds the recurring evaluations and Datasets the library a run measures against.
- Start a new evaluation
New evaluation is one form in five parts: a name, the agent and version, the dataset, the evaluators, then the pass threshold, the judge model and the schedule. The rail lists what is still missing, the preview reads your choices back, and Start evaluation runs it.
- Read a run
A run's page offers Re-run, Compare with the previous run, Export and Send failing cases to Annotation. Overview scores each evaluator against the threshold; the other tabs are Samples, By evaluator, Trace timeline, Config and Logs.
What an evaluation is not
Six tools in Studio and the Control Room say something about how well an agent works. An evaluation is the measured middle: the same questions, the same agent version, scored the same way, on demand or on a schedule.
| Tool | The question it answers | What it works on | When it runs |
|---|---|---|---|
| Prompt Studio's Test tab | Does this draft handle these few cases | A handful of cases in your browser, against the draft | While you edit, the inner loop |
| Evaluations, this page | How does this agent version score on this dataset | A dataset of questions and expected answers, one version, chosen evaluators | On demand or on a schedule |
| Optimizer | Is there a better system prompt than the live one | Candidate prompts scored against a dataset with your evaluators | A run you launch; you decide whether to apply the winner |
| Profiler | Did the agent answer well in production, and at what cost | The traces of real conversations over a window, scored by the judge | Continuously, as traffic arrives |
| Data Flywheel | Can the agent's production failures be turned into a change to it | Failure clusters from traces, a training set, proposed edits, a canary | One round at a time, with people at the gates |
| Analytics | What did every agent cost and how often did it fail | Requests, spend, latency, tool calls and guardrail checks over hours to a month | Always, as history |
The runs list
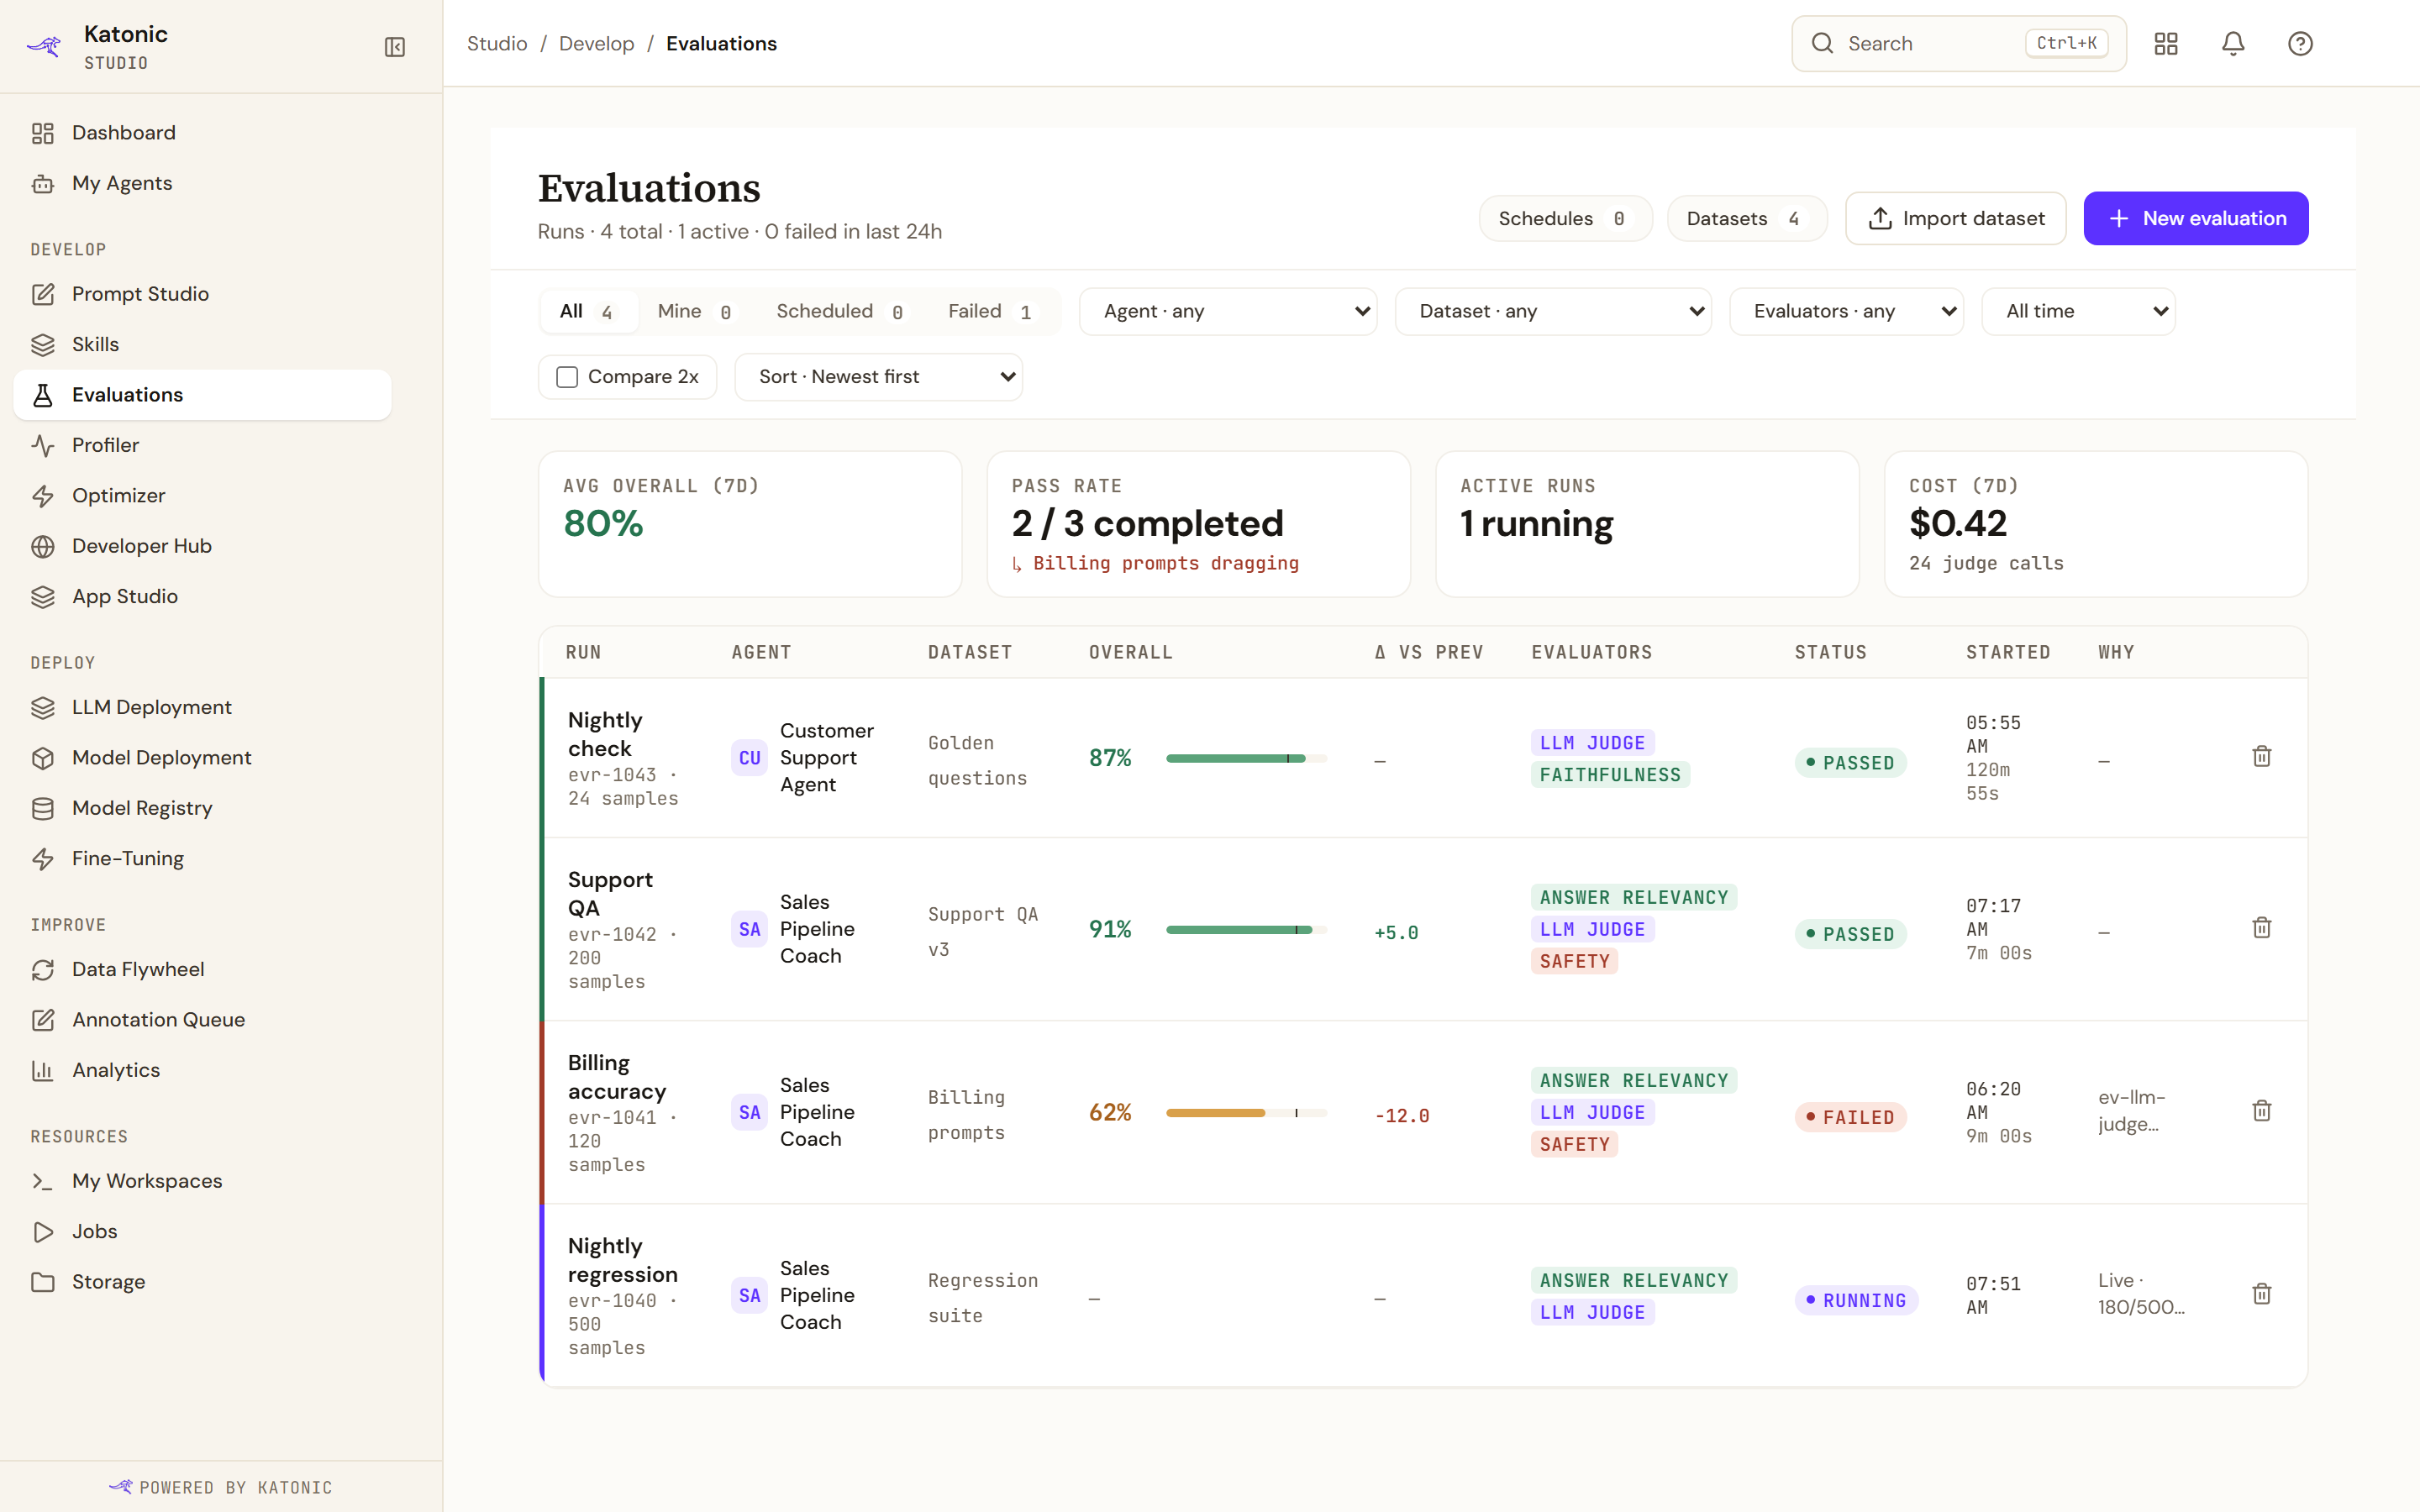
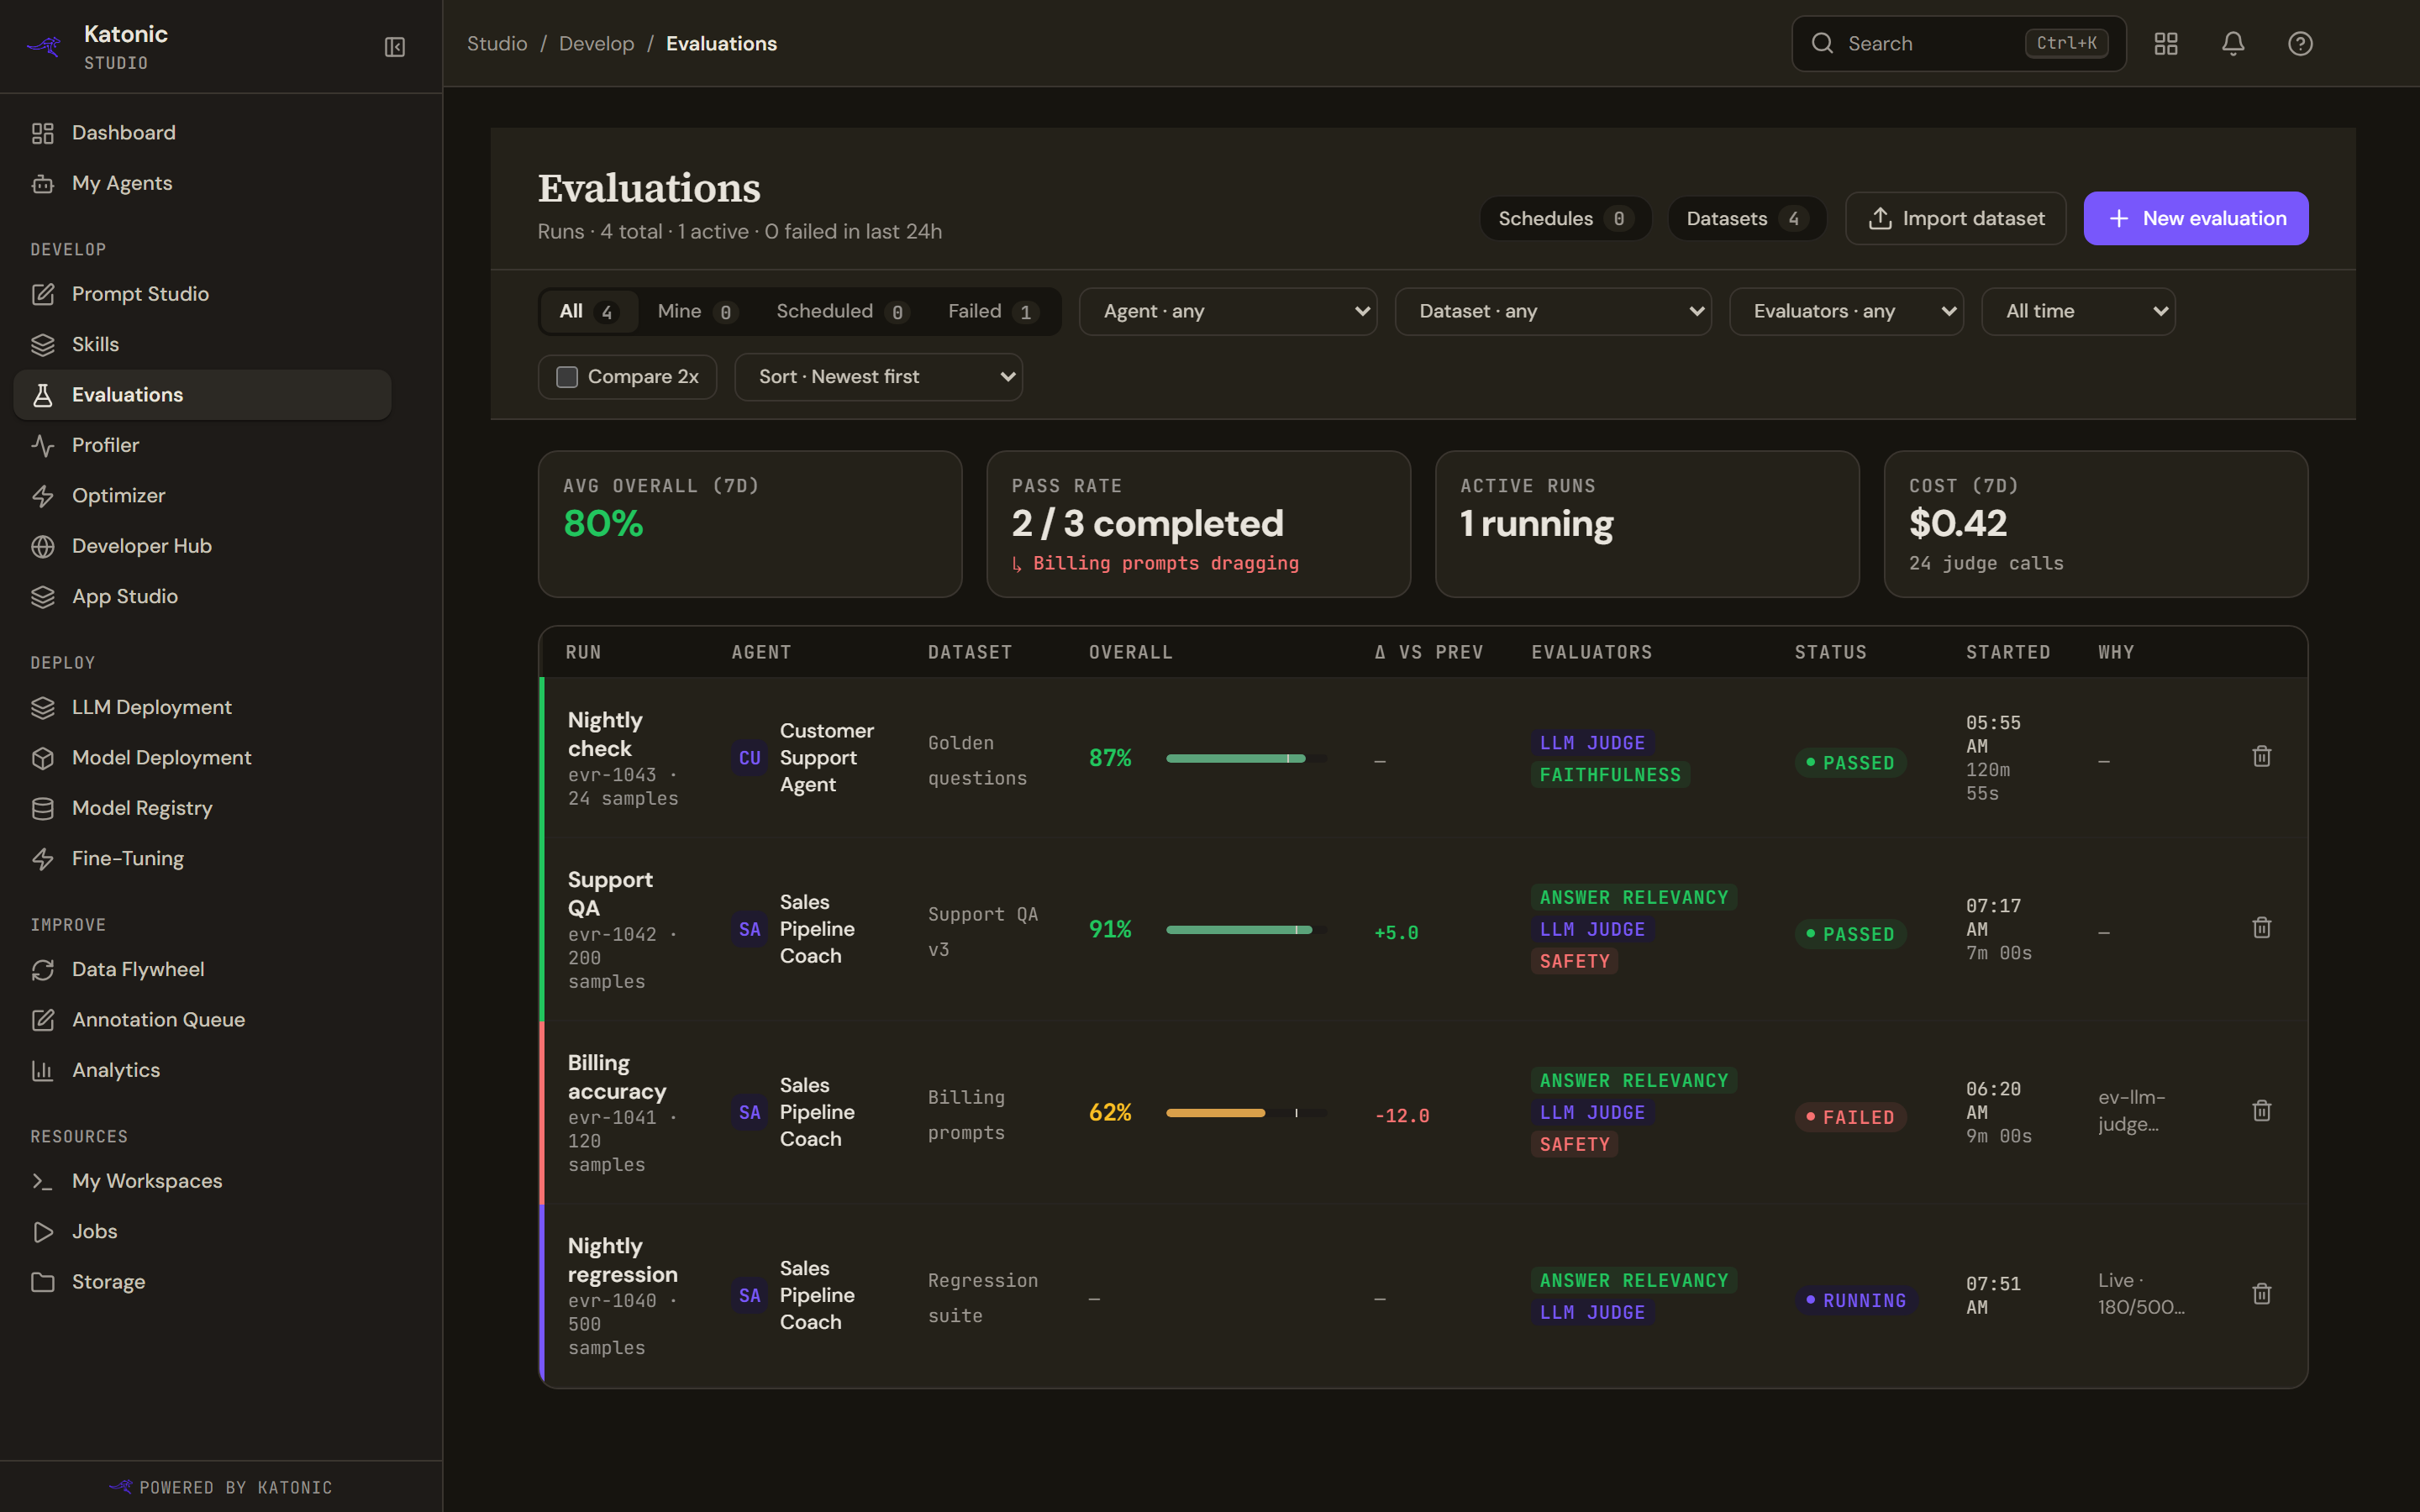
The header counts the runs, how many are active and how many failed in the last day, and carries Schedules and Datasets with their counts, Import dataset and New evaluation.
Four figures cover the week: the average overall score, the pass rate as completed runs that passed, how many runs are active, and cost. The pass rate names the dataset dragging it down where one is. Cost reads no cost data yet until judge calls are priced, which is honest rather than zero.
Each row is one run:
| Column | What it holds |
|---|---|
| Run | The run's name and id |
| Agent | The agent and version measured |
| Dataset | What it was measured against |
| Overall | The score |
| Δ vs prev | The change against the previous run of the same agent, worked out from the runs on screen |
| Evaluators | Which ones scored it |
| Status | Passed, Failed, Errored or Running |
| Started | When, and how long it took |
| Why | The reason, when it failed |
Narrowing the list
The chips All, Mine, Scheduled and Failed each carry a count, and the header's Schedules opens the recurring evaluations themselves, with each one's cadence, next run and last result. Beside them, filters by agent, by dataset, by evaluator and by time window, and a sort: newest first, biggest regression first, highest score or lowest.
Compare 2x turns the list into a chooser and counts your selection; picking exactly two runs offers them side by side. See Read a run's results.
When a filter or the time range leaves nothing, the table says how many runs fall outside the range and offers to show them all, so an empty table never reads as an empty tenant.
Limits and behaviour
- A run invokes the agent once per dataset row, so a few hundred rows take minutes.
- A run stuck at Running may simply need the page refreshed to re-check its status.
- The overall score is the mean of the quality evaluators. The measurement evaluators, latency, runtime, calls and tokens, are excluded from it and from pass or fail. A run that selects only those reports no score and no verdict, and says so instead of printing a percentage.
- Where more than a quarter of judge calls fail, the run is marked degraded: it still reports a score, and says how many evaluator dispatches went unscored.
- The change against the previous run is worked out from the runs the list has loaded, so on a long history it can name the wrong predecessor.