Profiler
Agents
The Profiler, under Develop in Studio, answers one question about one agent: did it answer well over the last window, and what did that cost? It reads the traces the agent emits as it handles conversations, scores them with the LLM judge, and breaks the result down by version, by node and by individual answer.
Who can use it: the Builder role or higher, in a tenant licensed for agents. Nothing inside the Profiler is gated further by role; the controls that are dimmed are dimmed for everyone.
Recorded on .
The Profiler in four steps
The video above walks the hub; the seven views below each have their own page.
- Pick the agent and the window
The agent picker lists your whole fleet; the range buttons offer 1h, 24h, 7d and 30d, and each tab keeps its own window. The header says whether data is arriving: the age of the last span, the traces in the window and the version that produced them. Export downloads the view as JSON; the overflow offers Copy link and Refresh.
- Read the Overview
Answer quality out of five with the share evaluated and the split of helpful, partial, wrong and refused, then latency, spend and requests against the prior window. Where one node dominates, an auto-detected trade-off says what it costs and what it buys. Anatomy breaks the window down per node with the bottleneck flagged, and Recent answers lists the latest traces.
- Find an answer in Traces
Every answer in the window with the judge's score. Saved views pull out low scores, the slow tail, errors and high cost; filters narrow by score, latency and user; search finds a trace by id or question. Selecting a row shows the question, the answer, the score and the cost, and Open takes you to the trace.
- Use the other views
A node page opens from a row in the breakdown once enough traces have completed. Compare needs two versions with traffic in the window. Live tail shows answers as they arrive, newest first. Errors opens the page headed Issues, which groups everything wrong by what is broken, and a healthy agent stays empty.
How it works
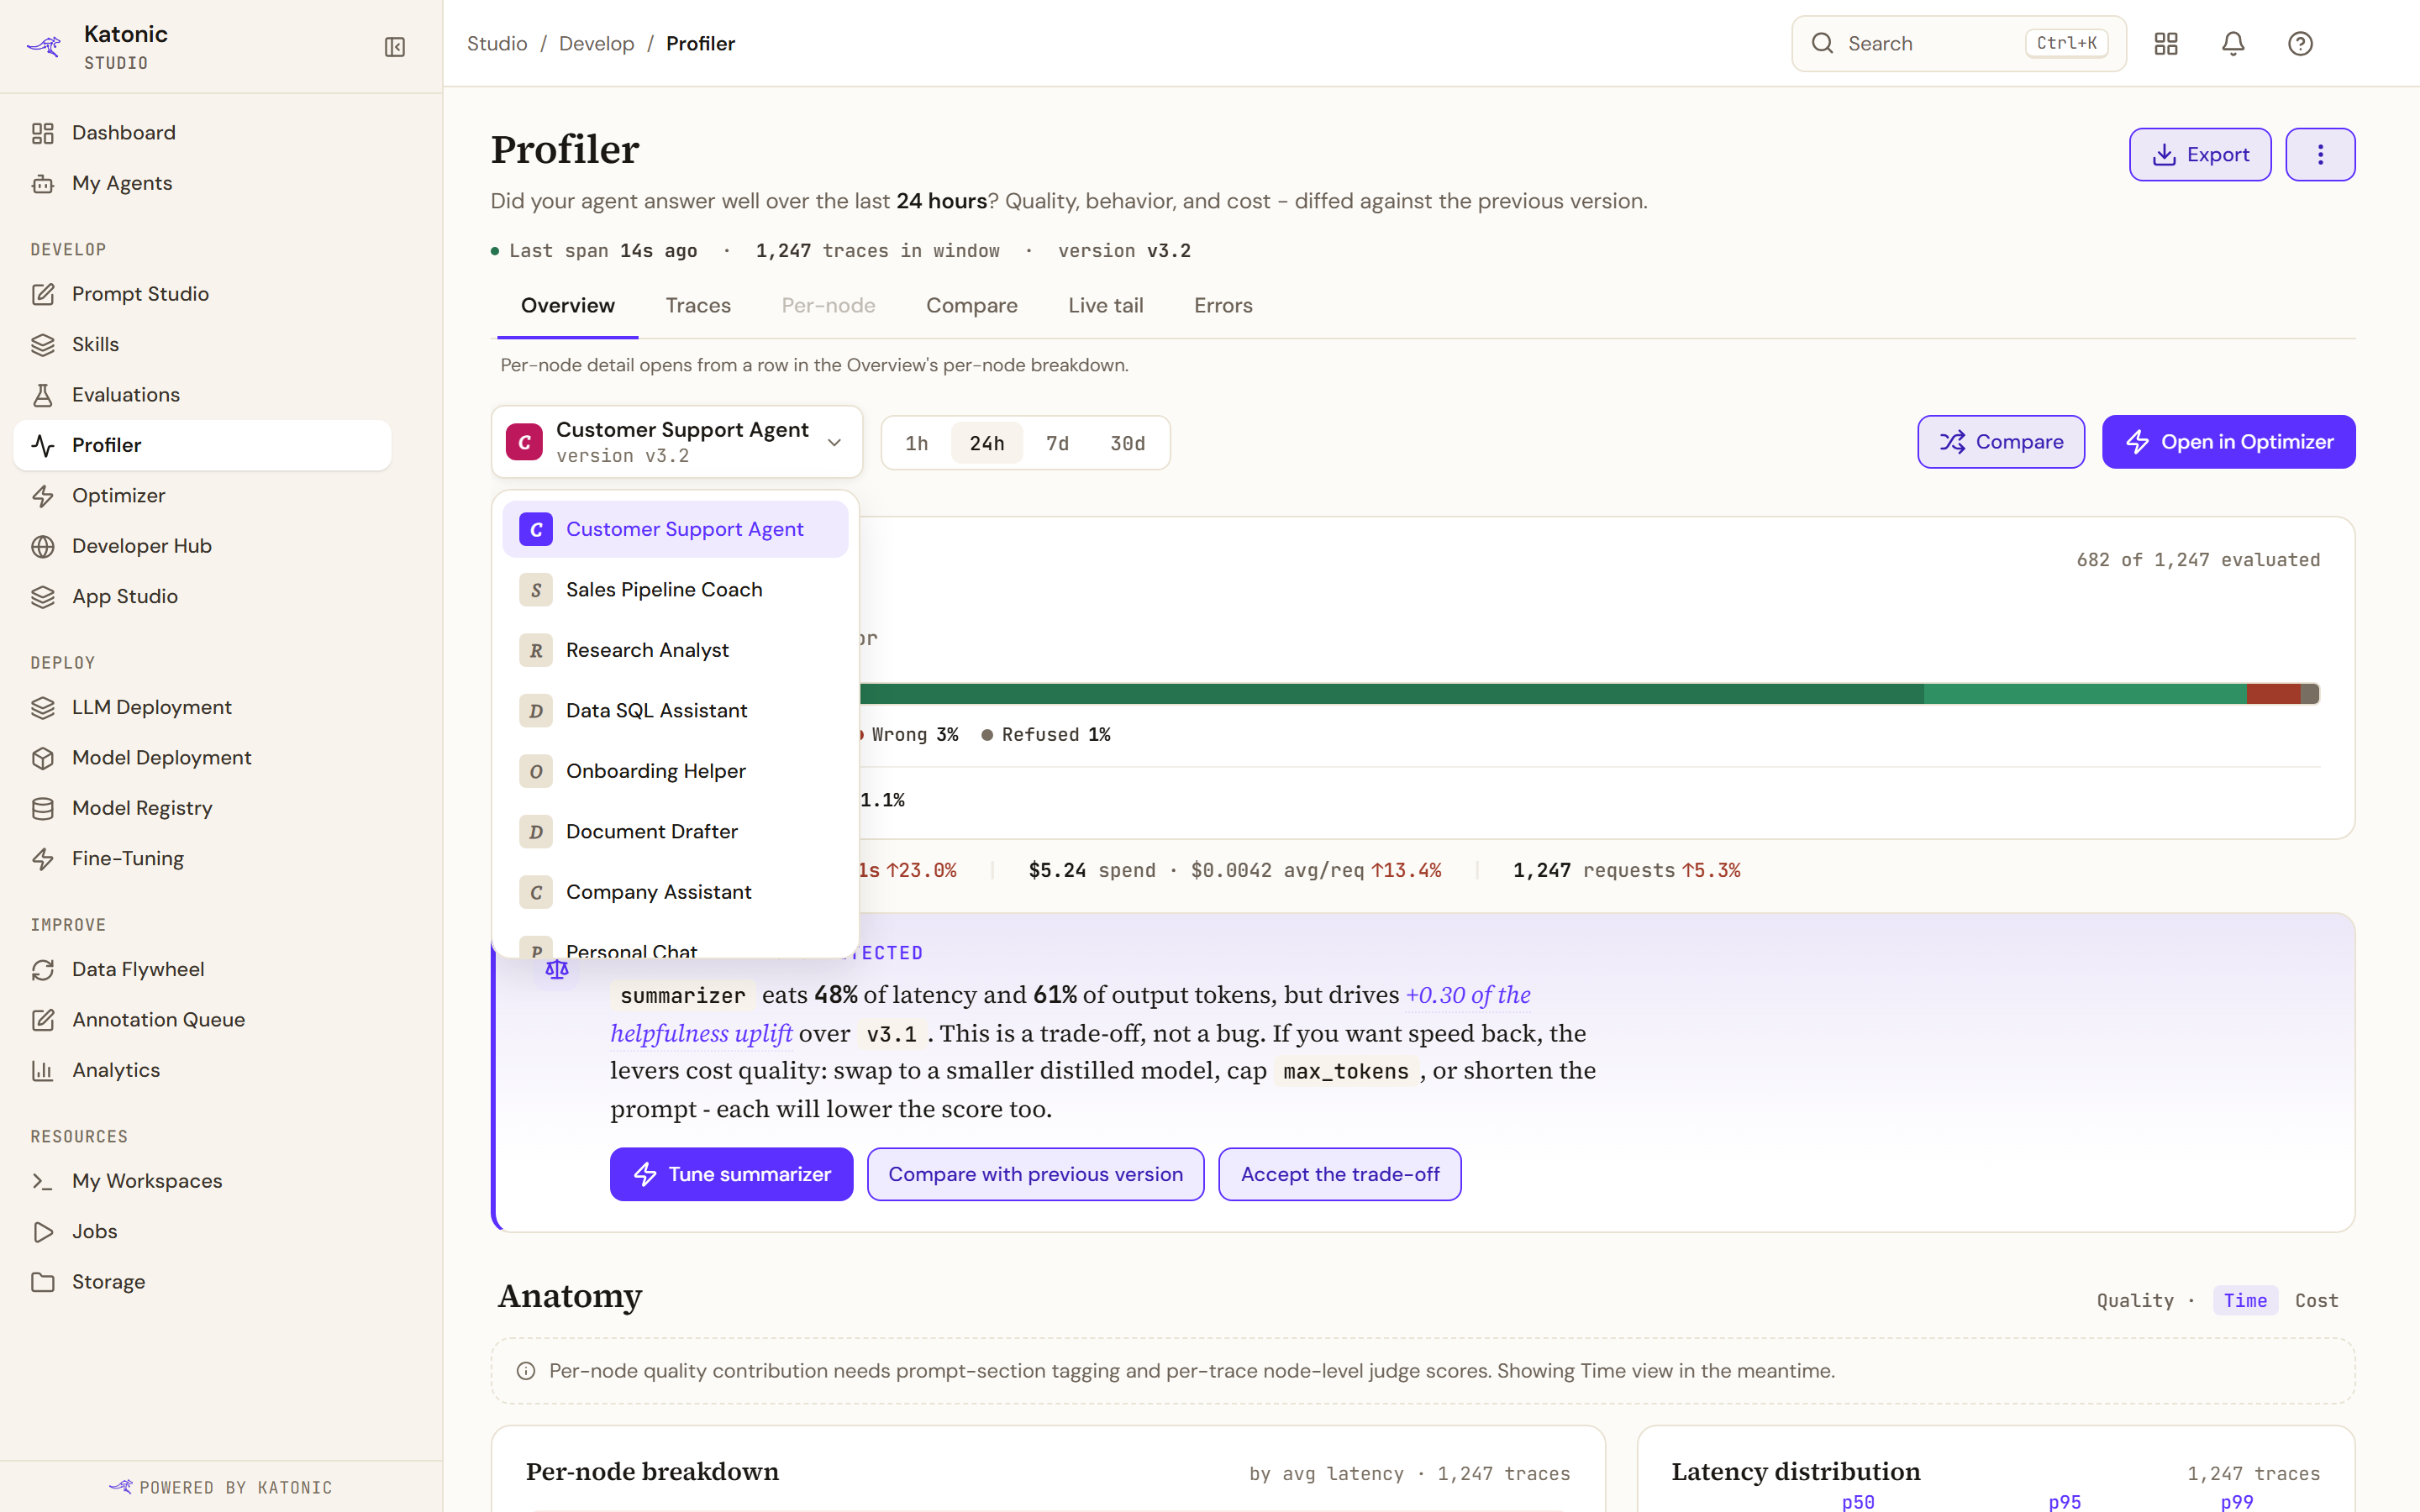
Every view works on one agent and one window. The agent picker sits in the toolbar and lists your whole fleet; the range buttons offer 1h, 24h, 7d and 30d, and there is no custom range, because the service accepts only those four windows. Each tab keeps its own window, so changing it on Traces does not change it on Errors. Only the Overview's window is carried in the address, so a link to the Overview can pin a range.
The header tells you whether data is arriving: Streaming with the age of the last span, how many traces are in the window, and which version of the agent produced them. Export downloads the view you are looking at as JSON, and says so when the window is empty. The overflow menu offers Copy link and Refresh.
The seven views
| View | What it answers |
|---|---|
| Overview | Did it answer well, how fast, at what cost, and which node dominates |
| Traces | Which individual answers were bad, slow or expensive |
| A single trace | How one answer was built, span by span |
| A single node | Whether one node earns its keep |
| Compare | Did the new version actually answer better |
| Live tail | What the agent is answering right now |
| Issues | Everything wrong, grouped by what is broken |
The tab strip carries all of these except the trace page, which opens from a trace row; the Issues view's tab is labelled Errors. Per-node is in the strip but is never clickable: a node page opens from a row in the Overview's per-node breakdown, and the note under the strip says so. Until an agent is resolved, the other tabs are dimmed.
What the Profiler needs
- Traces. An agent emits them as it handles conversations. Until the first one arrives, the Overview explains how to produce one and offers Run a sample trace, a copyable code snippet and a four-step guide to wiring tracing into an agent you build in code.
- The judge, for quality. Every score on every view comes from the LLM judge evaluating traces. Without it the Overview says auto-eval is not configured and offers Enable auto-eval; the quality figures elsewhere stay empty rather than guessing.
- Two versions with traffic, for Compare. Publishing a second version is not enough: both versions need conversations in the window.
- A configured SLO, for breach groups. Issues groups a breach only where an SLO exists to breach.
Limits and behaviour
- A failure from the observability service is reported as a service error, never as an agent with no traces. The wording on each view says which it is.
- Quality covers only the traces the judge has evaluated. The Overview prints that count beside the score, so a mean over three traces is visible as such.
- Per-node quality needs prompt-section tagging and per-node judge scores. Until then the Anatomy card offers Time and Cost only, and says why.
- The Quality view of the per-node breakdown is present but dimmed: it needs prompt-section tagging and per-trace node-level judge scores, and says so. Two other controls that used to sit dimmed beside it, replaying a question against another version and filtering the live tail, have been removed, because neither has an endpoint behind it to wire.
- A line-level prompt diff is not part of the comparison payload, so Compare shows the metric, quality and per-node diffs and says the prompt diff is not wired.