The domain graph
Knowledge
A source's Domain graph is a typed layer beside its passages: entities and the relationships between them, which an agent queries with the graph tool rather than by retrieval. The documents are already searchable without it; the graph answers a different kind of question, about how things connect.
Who can use it: the Builder role, or a Member holding the Knowledge Admin grant, in a tenant licensed for knowledge.
Recorded on .
How a graph fills
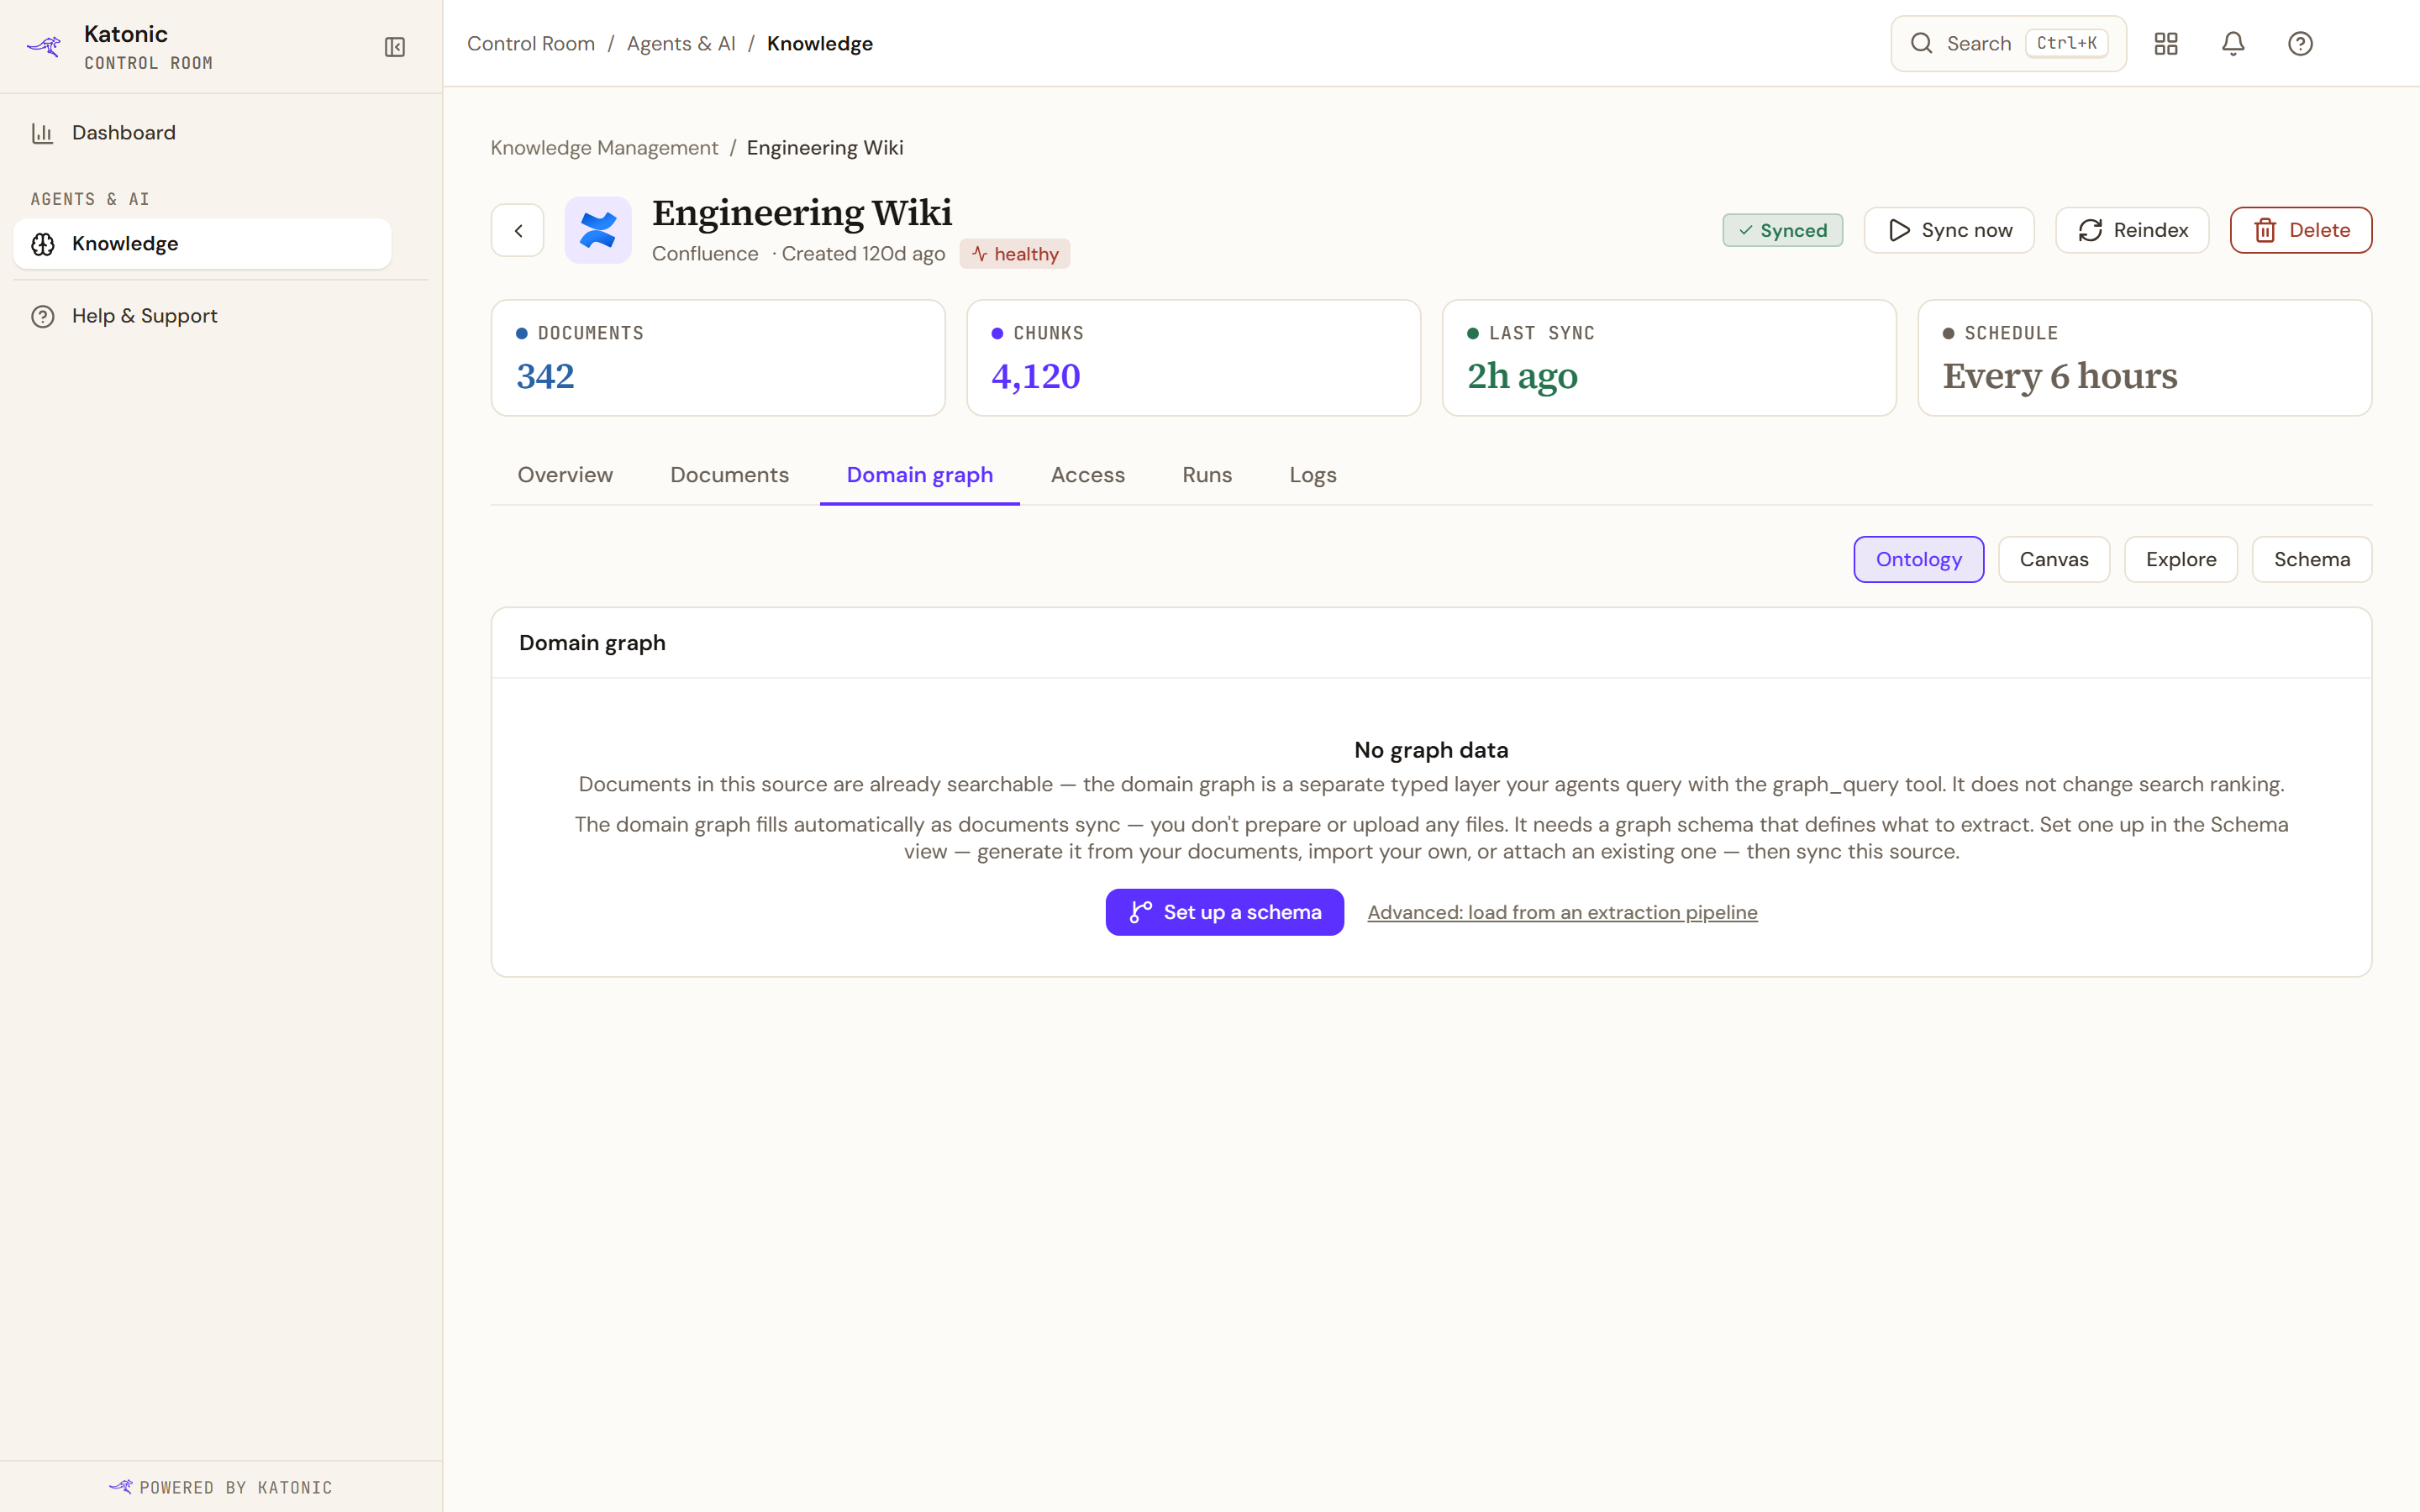
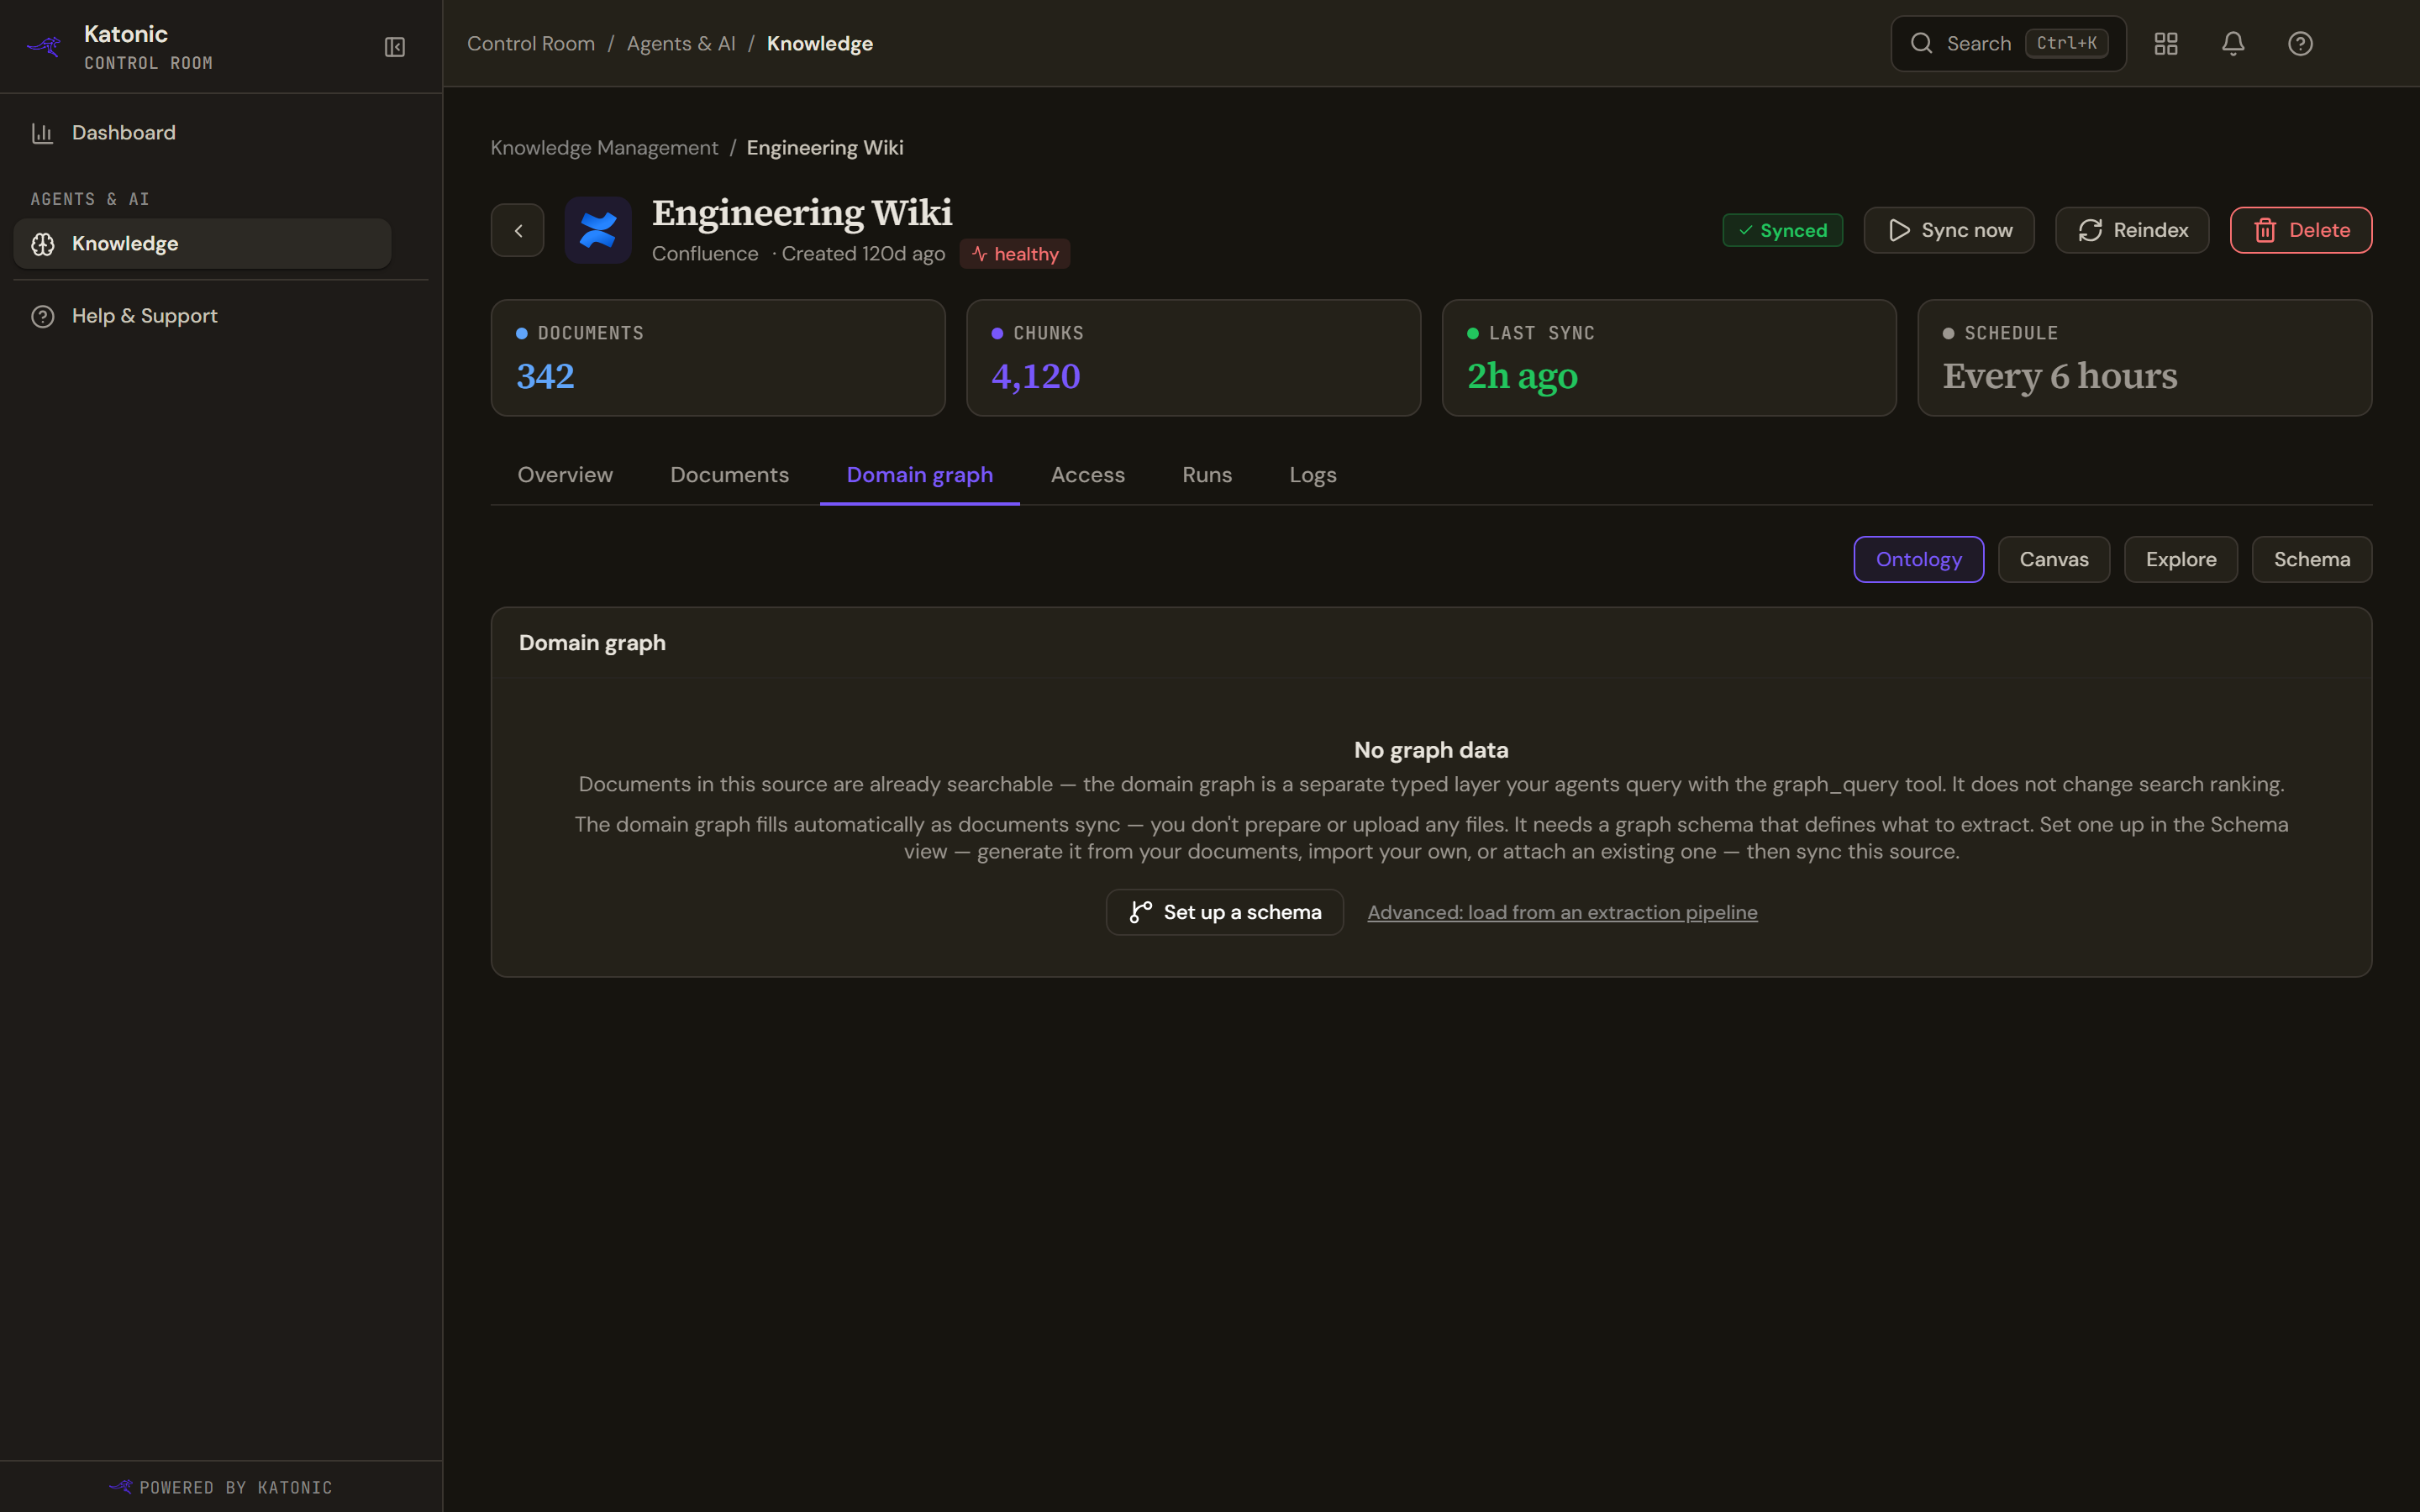
You do not prepare or upload anything. The graph fills as documents sync, guided by a graph schema that says which entity types and relationships to extract. Without a schema there is nothing to extract into, and the tab says so and offers to set one up.
Two things about filling are worth knowing before you wait for one:
- An incremental sync does not populate the graph. A full reindex does, because extraction runs over every passage.
- Extraction is per source and can be turned off. A source's Overview offers Tenant default, Extract entities or Search only, and the change applies to future syncs. Rebuilding or removing the graph for documents already ingested needs a reindex, which re-runs extraction over every passage and costs model time.
An empty tab is therefore normal on a new source. It says the documents are already searchable and that the graph is a separate layer, so an empty graph is not a broken source.
The four views
The tab carries four views of the same data.
| View | What it is for |
|---|---|
| Ontology | What kinds of thing are in the graph and how many, with the relationships between them |
| Canvas | The graph drawn, expanded one relationship at a time |
| Explore | A filtered table of one entity type and its neighbours |
| Schema | Which schemas this source is held to, and how strictly |
Ontology
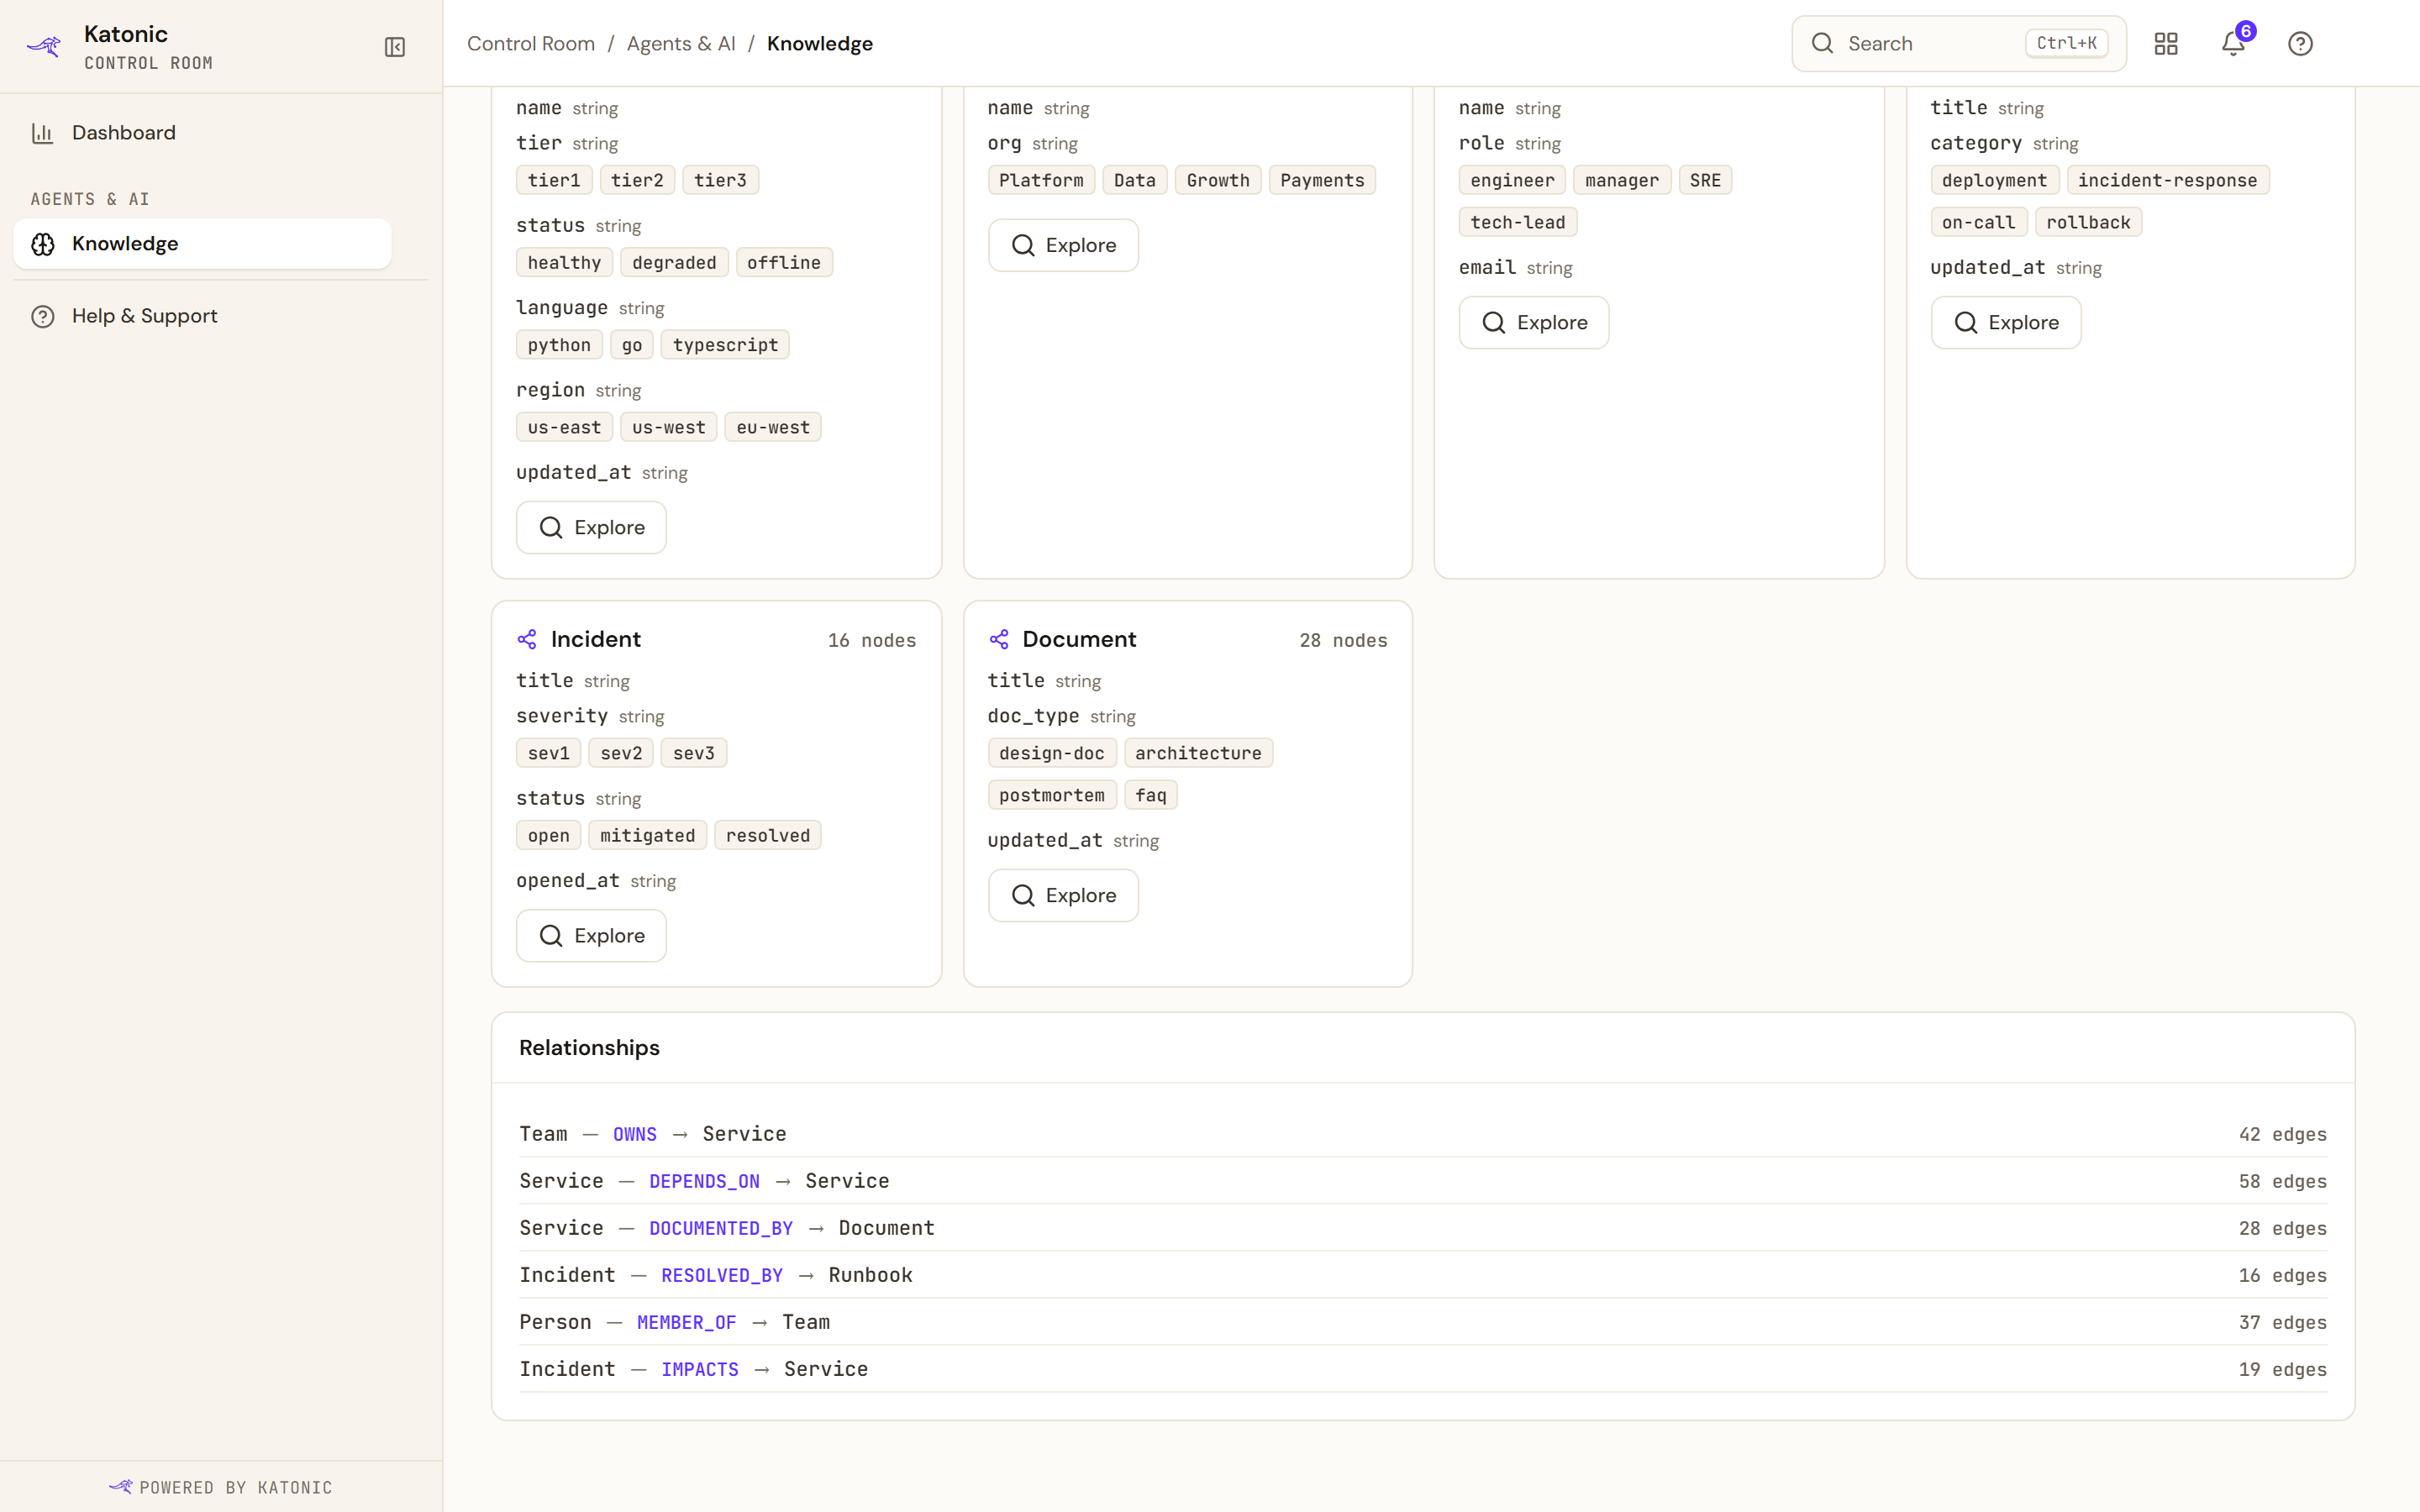
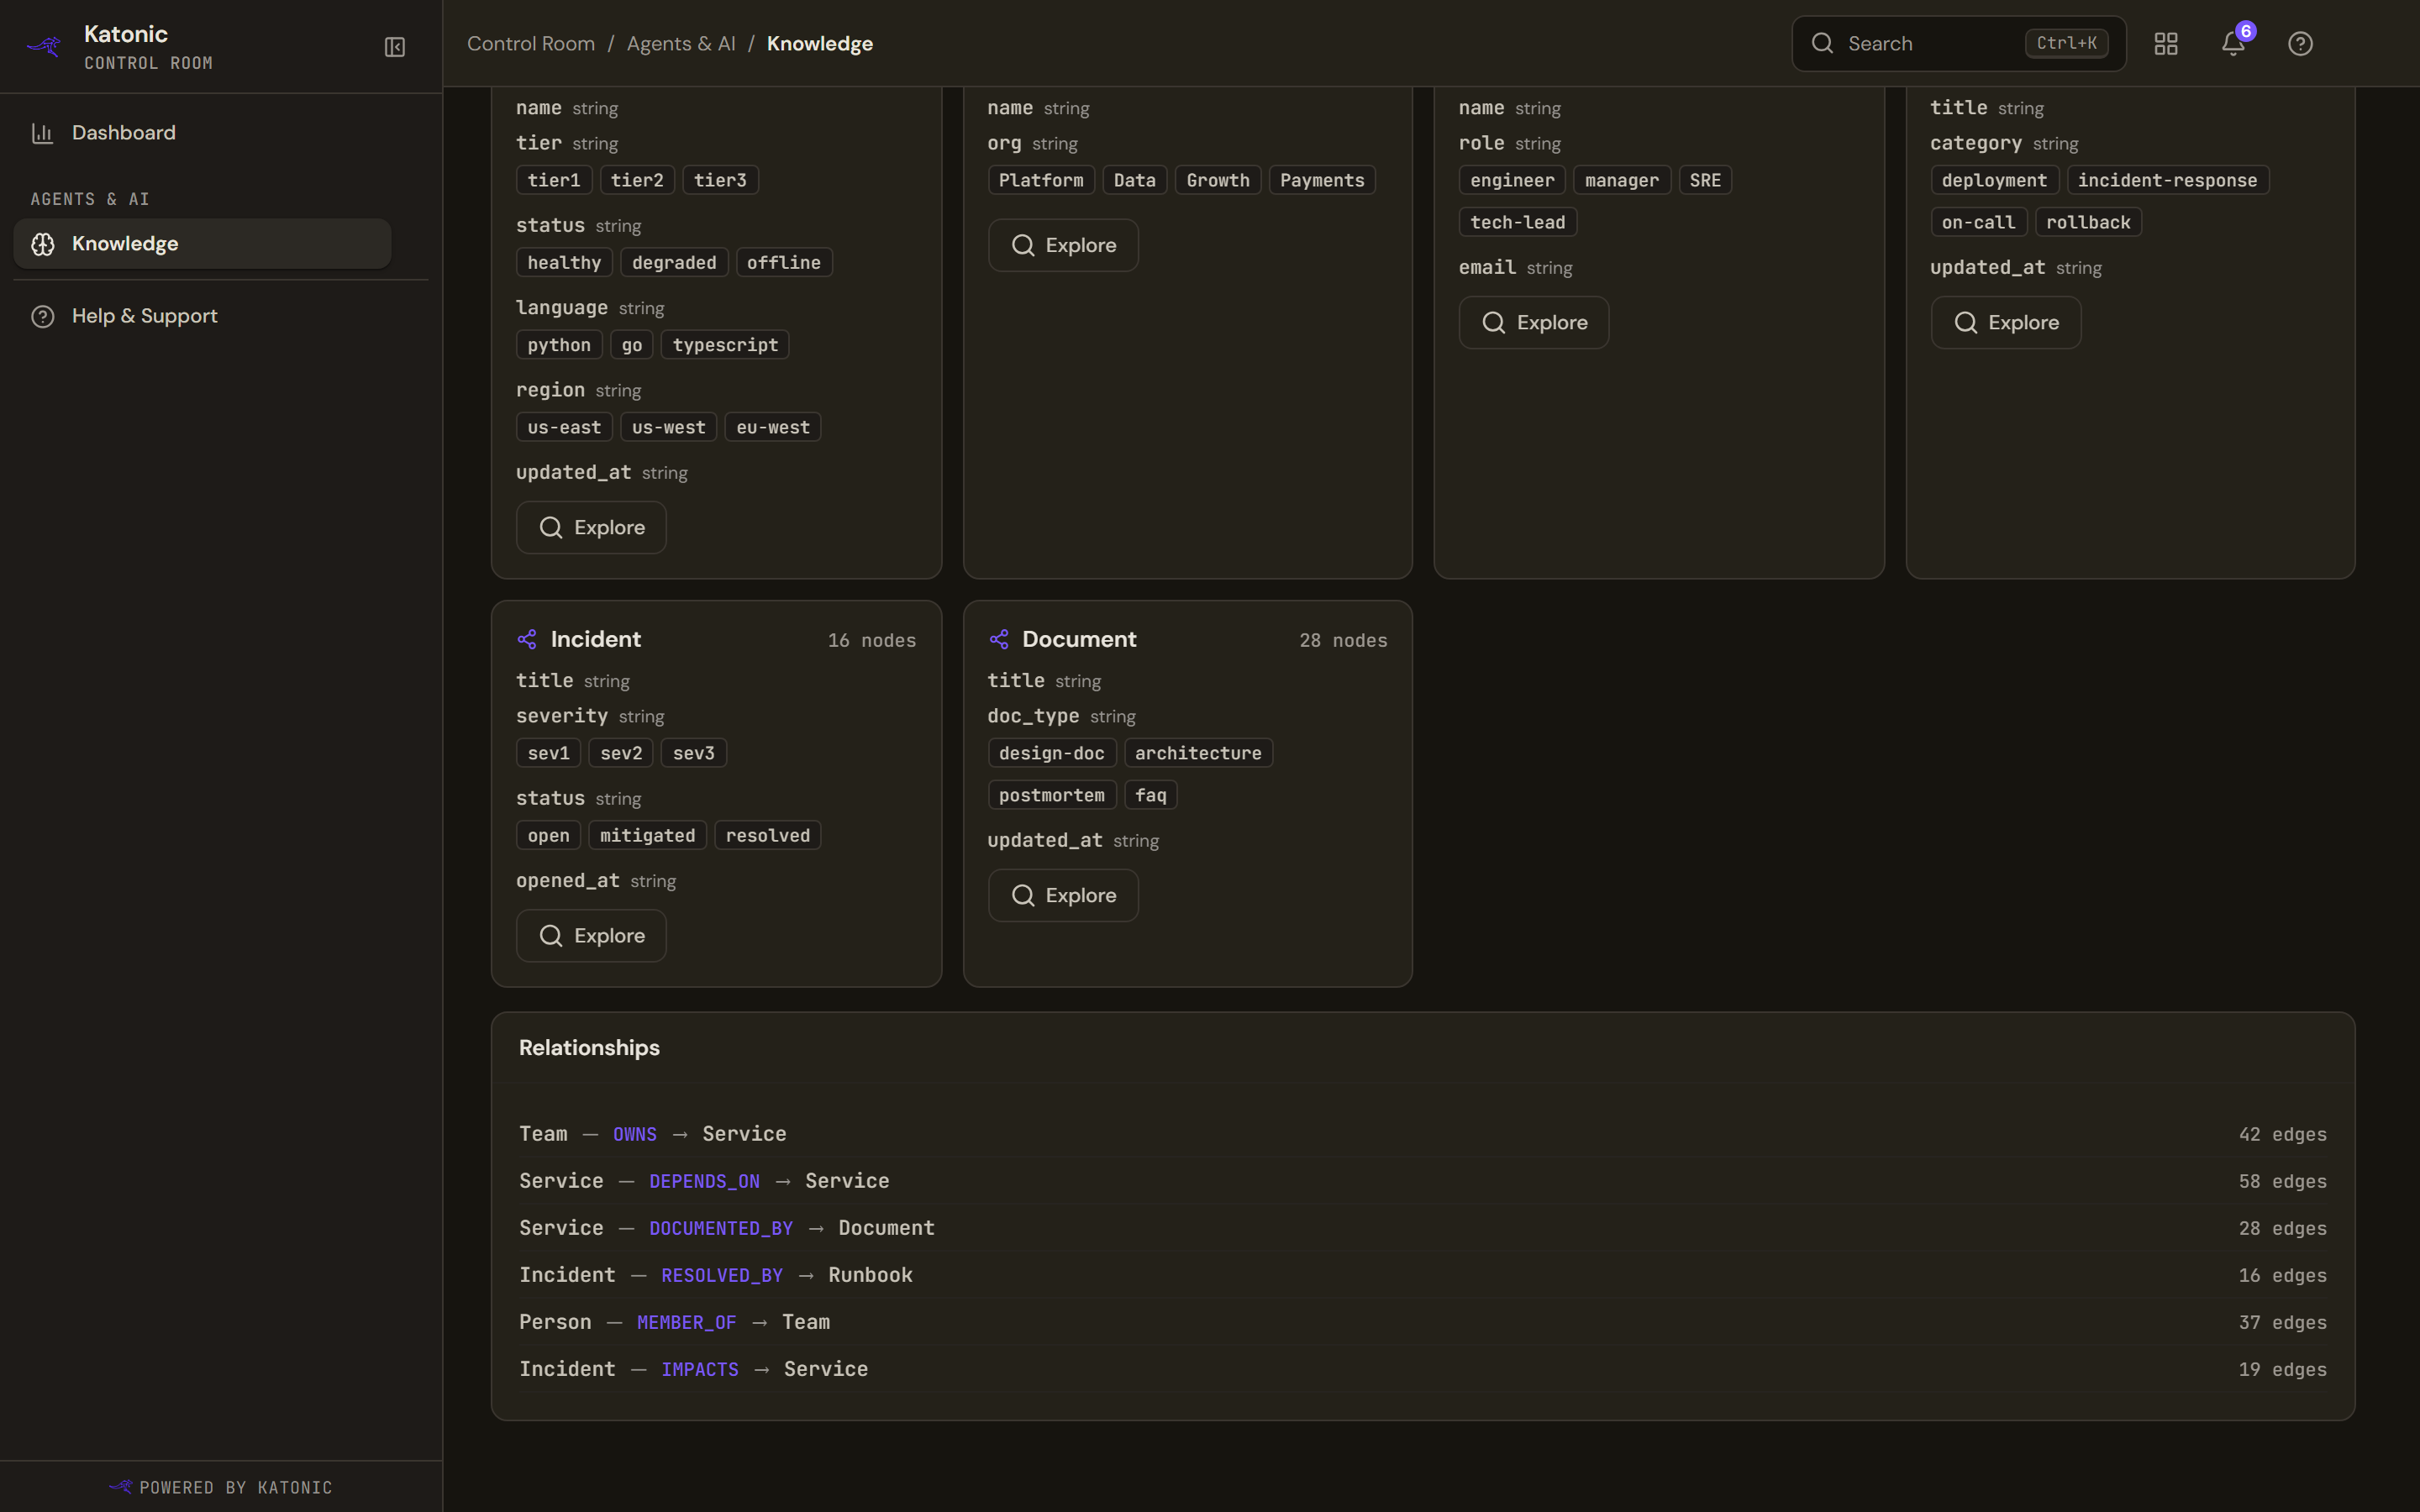
Ontology is the summary: one card per entity type with its count and a sample of values, then the relationship types with their counts. A line above gives the totals of nodes, edges and node types, and a chip says whether the graph conforms to the schema attached to it.
Explore on a card opens that entity type in the Explore view. Where a source has a graph but no schema yet, Promote to graph schema takes what was discovered and seeds a schema from it, which you then tighten and publish.
Build a graph in three steps
- Turn extraction on
On the source's Overview, set Graph Extraction to Extract entities. The change applies to future syncs.
- Attach a schema
On the Domain graph tab select Set up a schema, then Generate a schema from your documents, review the node types, their keys and the relationships, and select Attach this schema. It is published, attached in Advisory mode, and a full reindex starts.
- Read and govern it
When the reindex has run, read the counts on Ontology, walk the graph on Canvas, filter it on Explore, and set how strictly loads are held to the schema on Schema.
Limits and behaviour
- A load of the graph is capped at 10,000 nodes and 20,000 edges, and a single query at three hops and 200 rows. The views are built for graphs of that order.
- Counts the platform cannot state exactly are shown as a lower bound rather than rounded into a number that looks certain.
- Loading a graph from an extraction pipeline of your own is possible but is an advanced path; the empty state links to it.
Troubleshooting
- No graph data. No schema is attached, or no full reindex has run since one was. Set up a schema, then reindex.
- The graph is unavailable. The graph service did not answer. The tab distinguishes this from an empty graph.
- You do not have access to this graph. Your access to the source does not extend to its graph.