Logging and Monitoring
This guide describes the Logging and monitoring stack provided in the existing Logging stack of Katonic MLOps Platform.
Overview
What is EFK Logging Stack?
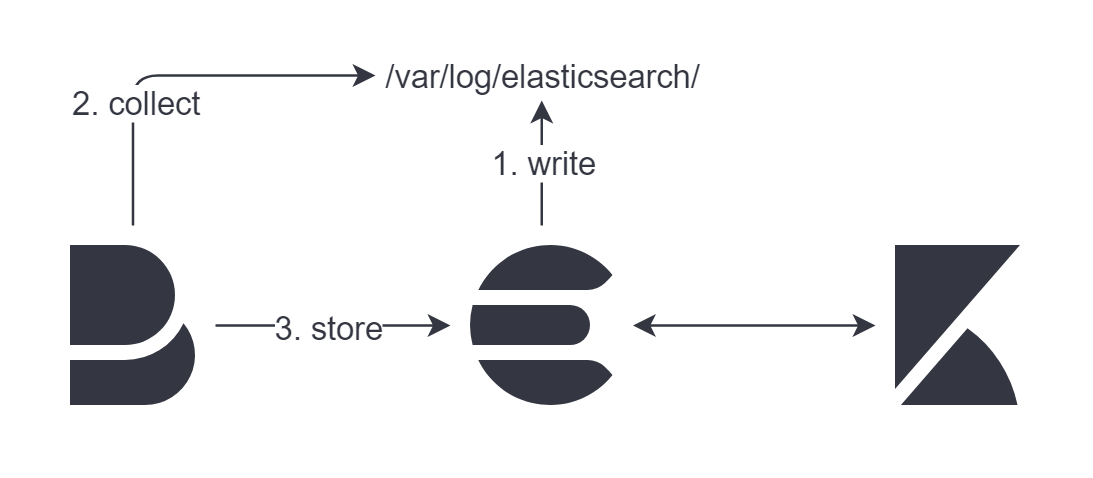
The EFK-Logging Stack is a complete collection of three open source products -
Elasticsearch , Filebeat and Kibana - all developed and managed by Elastic.
Katonic Elastic Stack provides centralized logging in a low-cost, scalable, cloud-friendly manner. Its user interface streamlines data analysis so you can spend your time gleaning insights from your data instead of fighting with a clunky interface
In this guide, we will take a comprehensive look at the different components comprising the stack.
Elasticsearch
Elasticsearch is an open source, full-text search and analysis engine, based on the Apache Lucene search engine.
It has quickly become the most popular search engine and is commonly used for log analytics, full-text search, security intelligence, business analytics, and operational intelligence use cases.
Filebeat
Filebeat is a lightweight shipper for forwarding and centralizing log data. Installed as an agent on your servers, Filebeat monitors the log files or locations that you specify, collects log events, and forwards them either to Elasticsearch or Logstash for indexing.
All the data present in your existing Katonic Cluster is being fetched by the Filebeat and forwarded to the Elasticsearch.
Kibana
Kibana is a visualization layer that works on top of Elasticsearch, providing users with the ability to analyze and visualize the data.
Kibana also includes advanced applications such as Canvas, which allows users to create custom dynamic info graphics which are suitable for their data, and Elastic Maps for visualizing geospatial data.
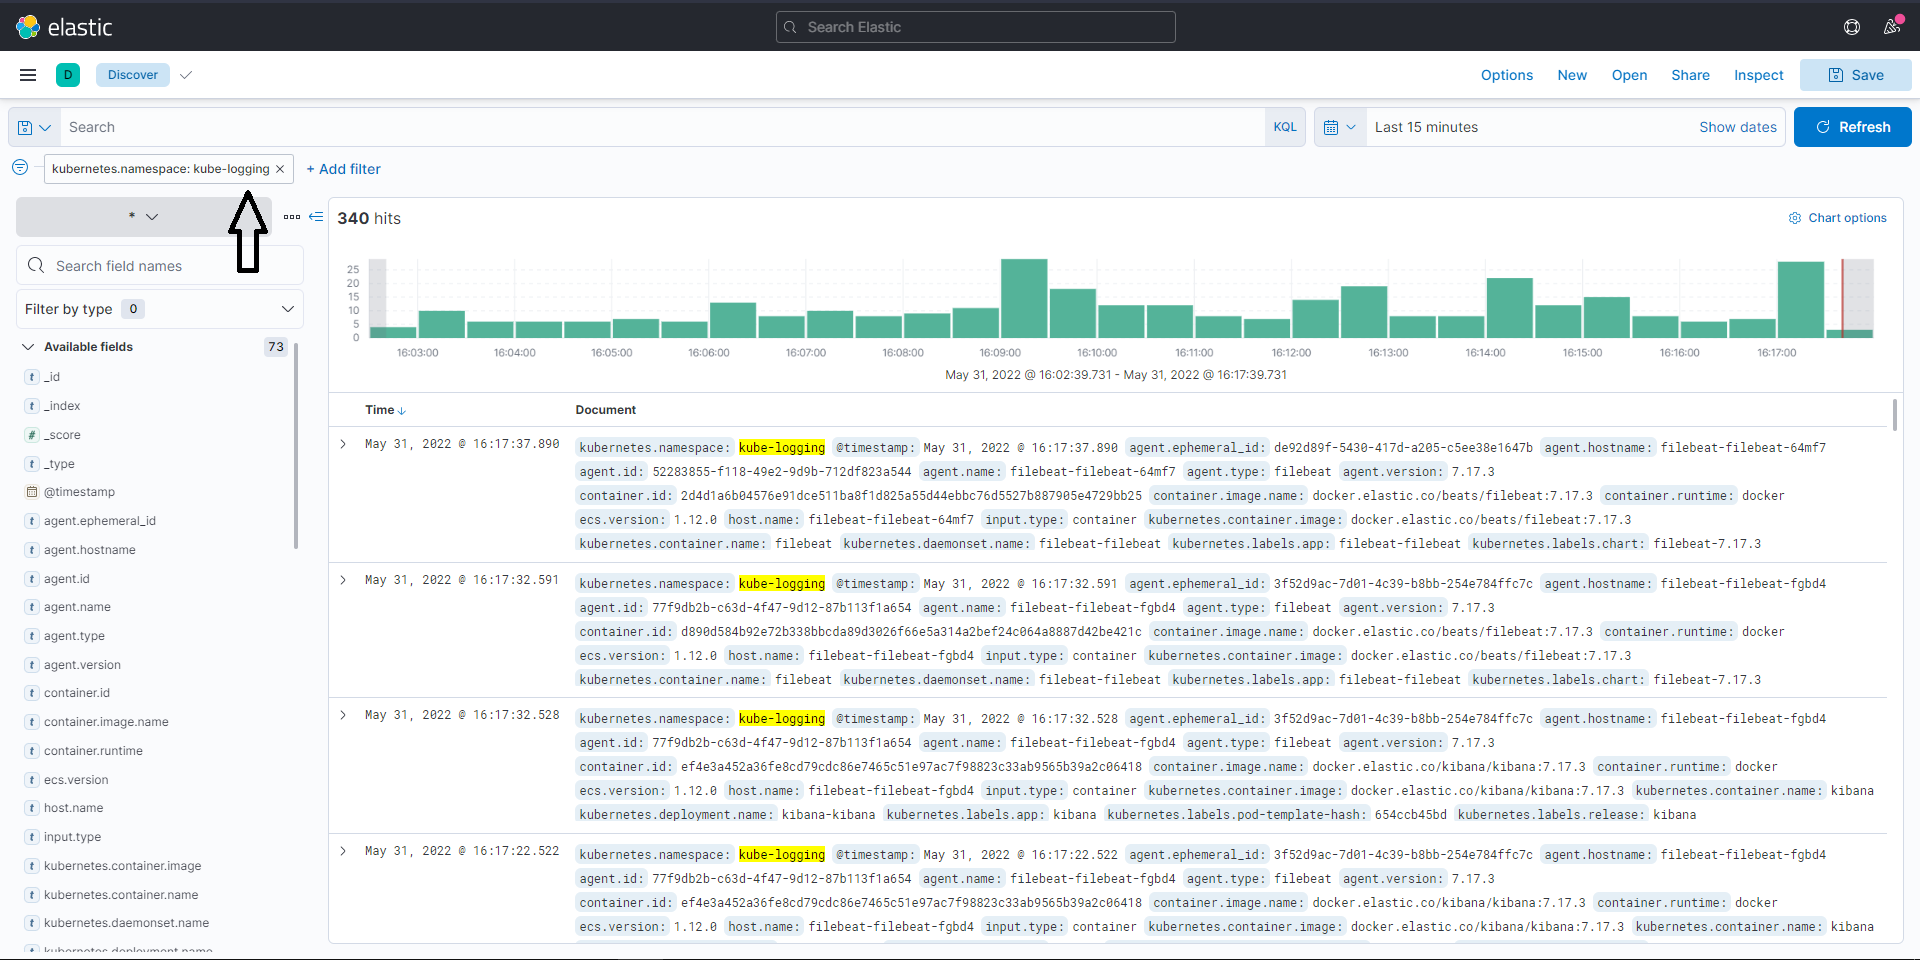
All the logs and data collected from the filebeat is displayed on the Kibana dashboards.
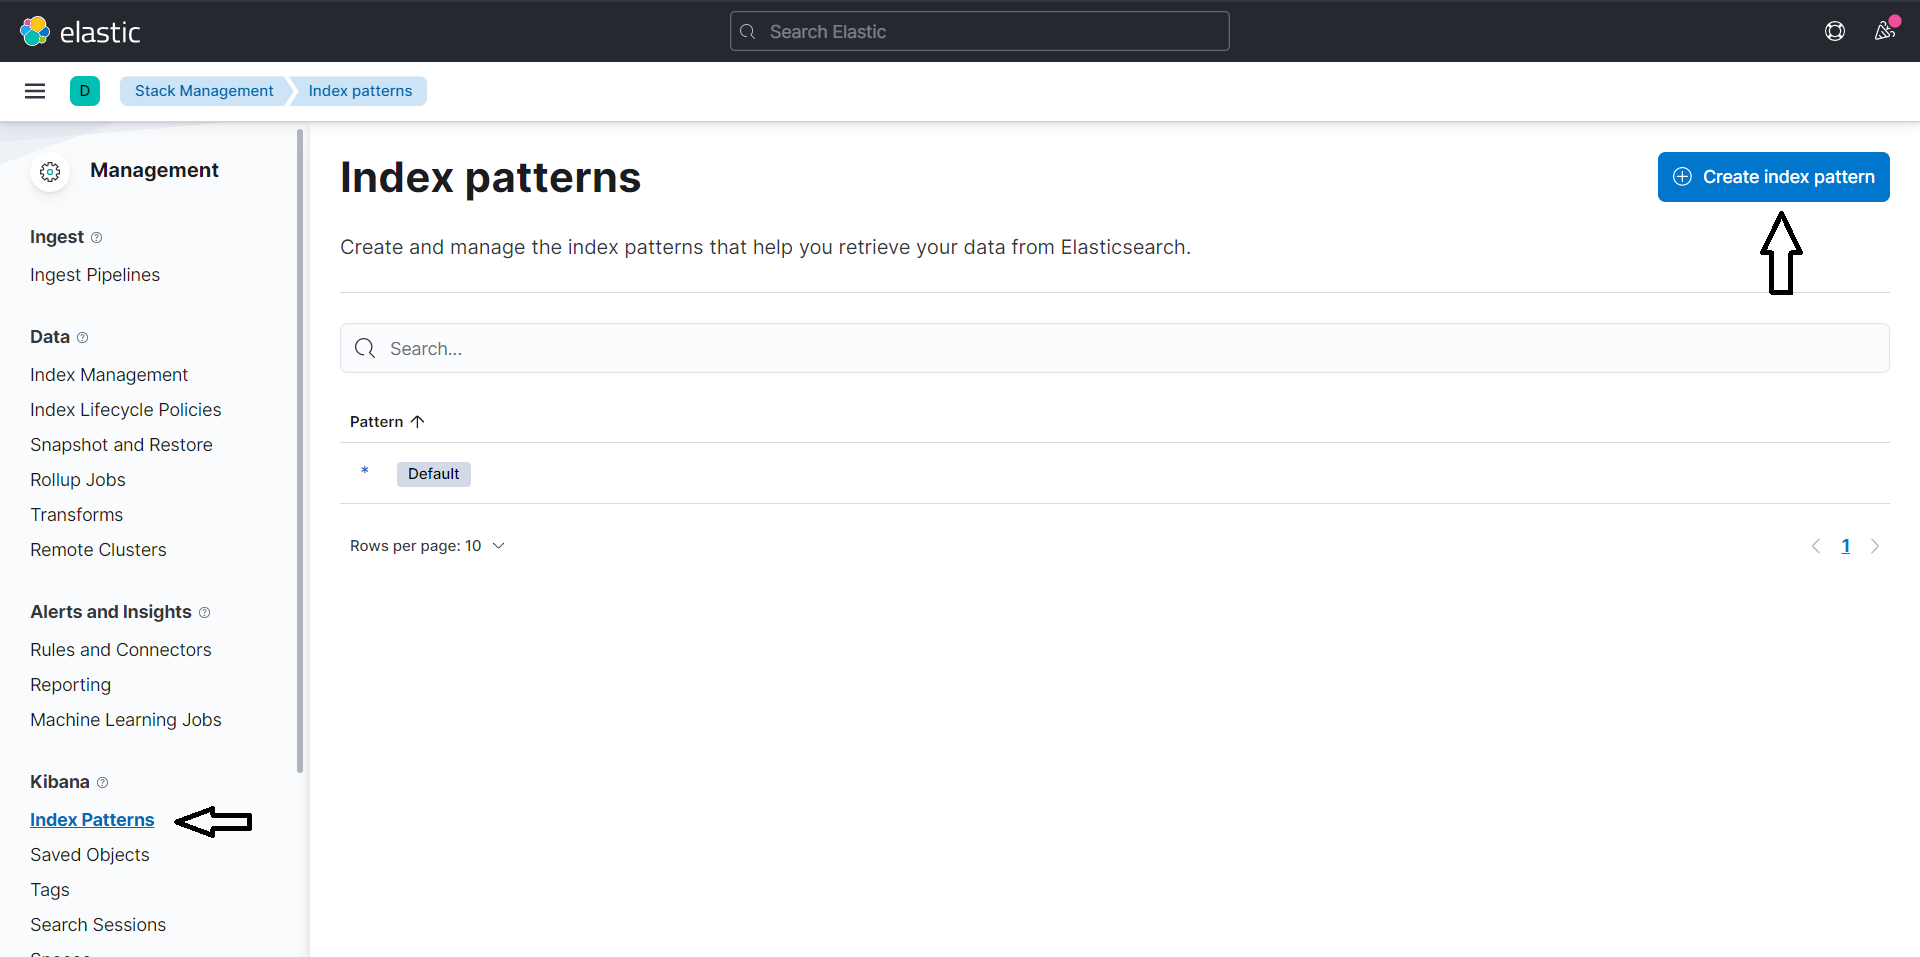
Steps to create the Index Pattern in Kibana:
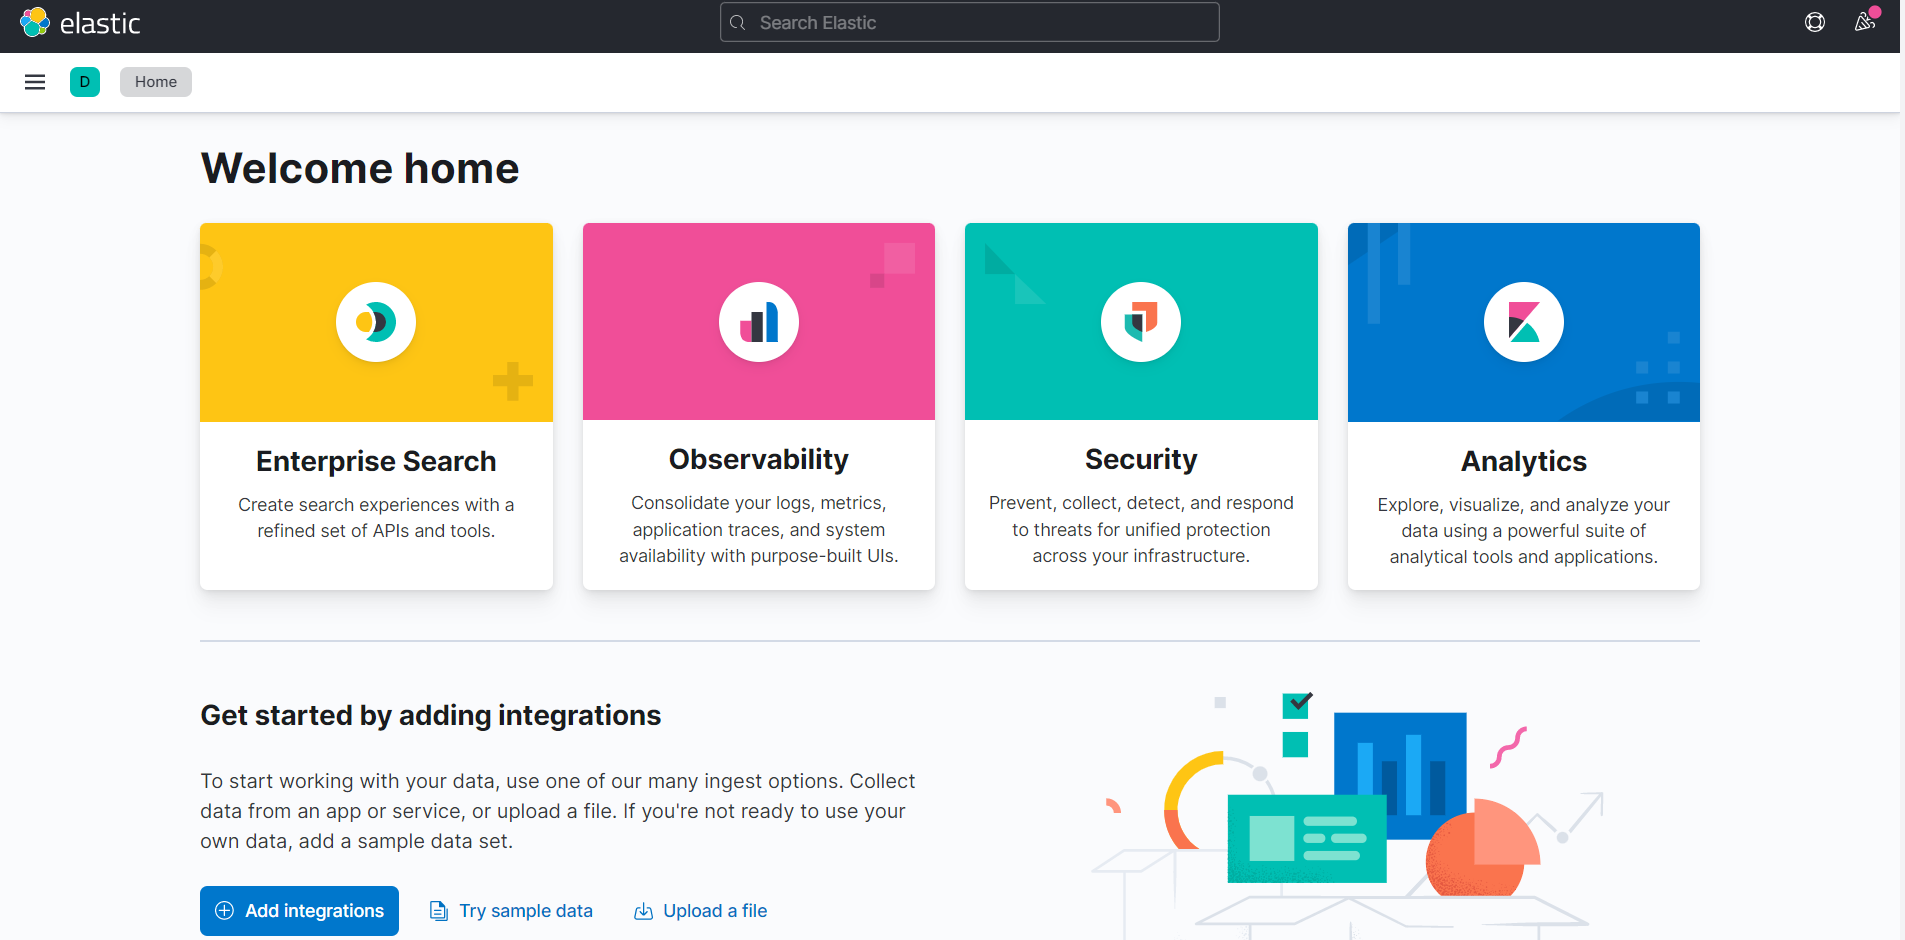
Click on the “Stack Management”
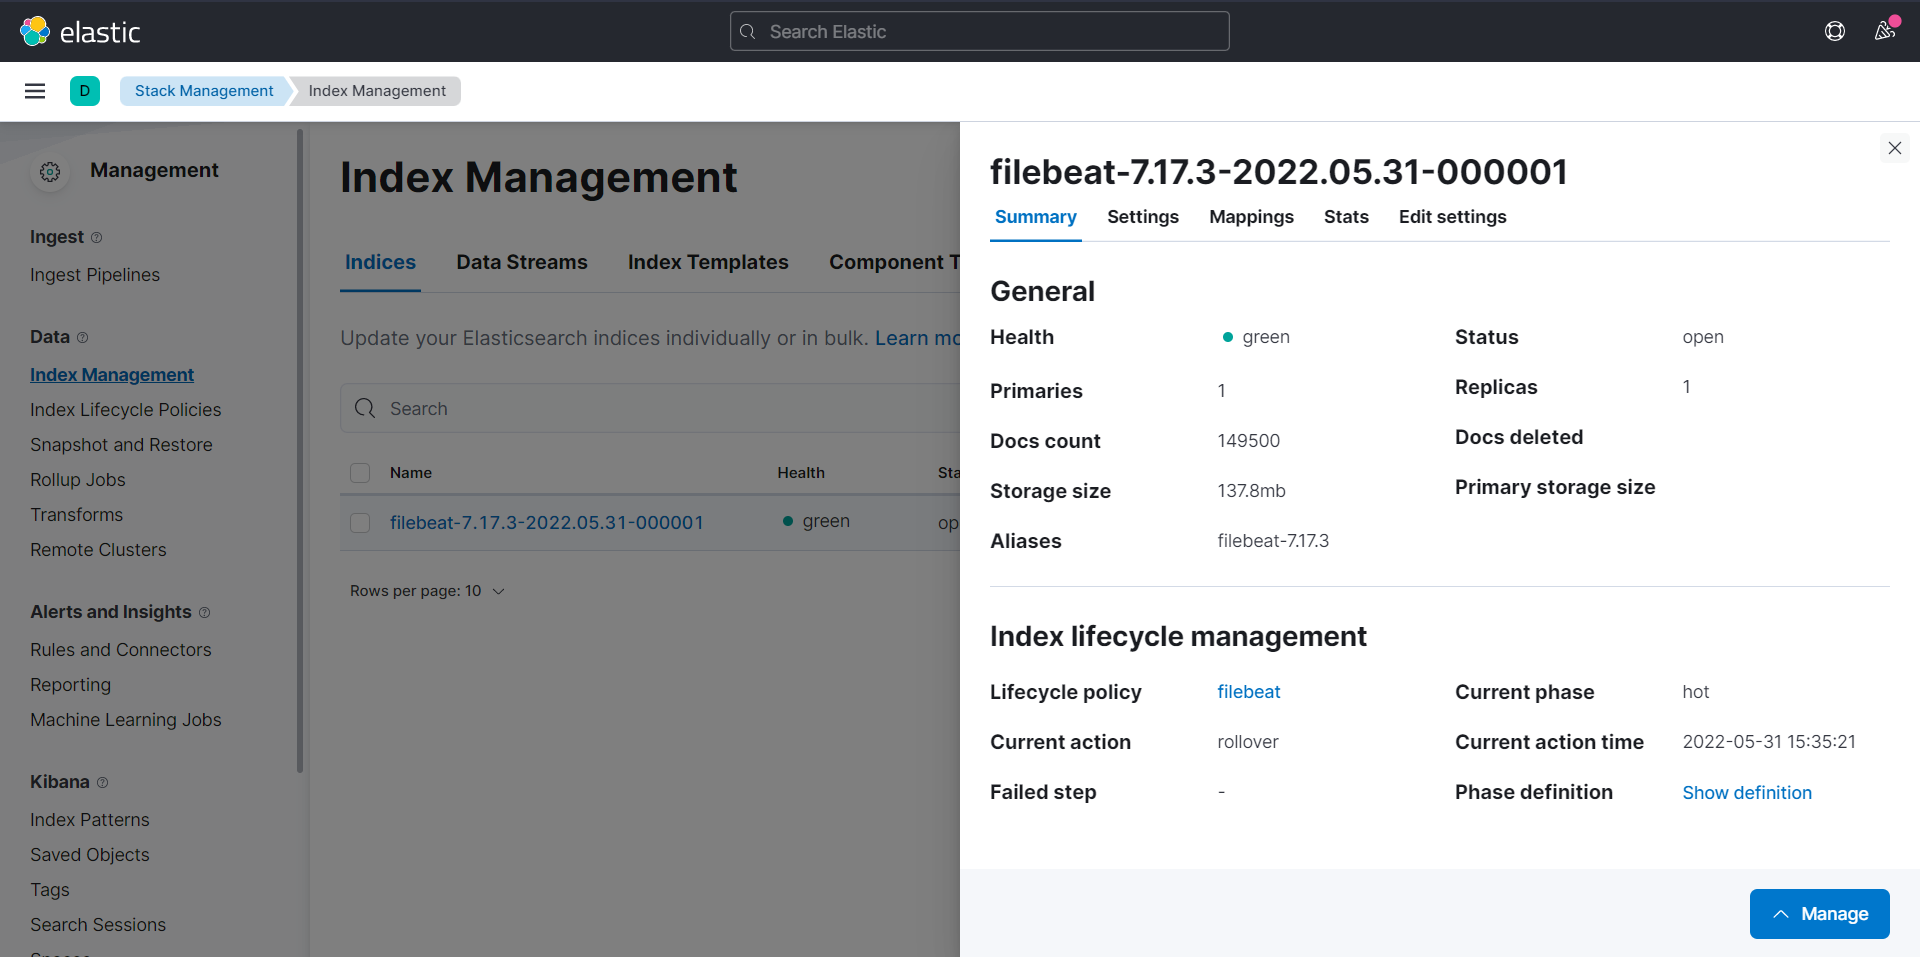
Move to the Kibana section --- > Index Patterns as shown below.
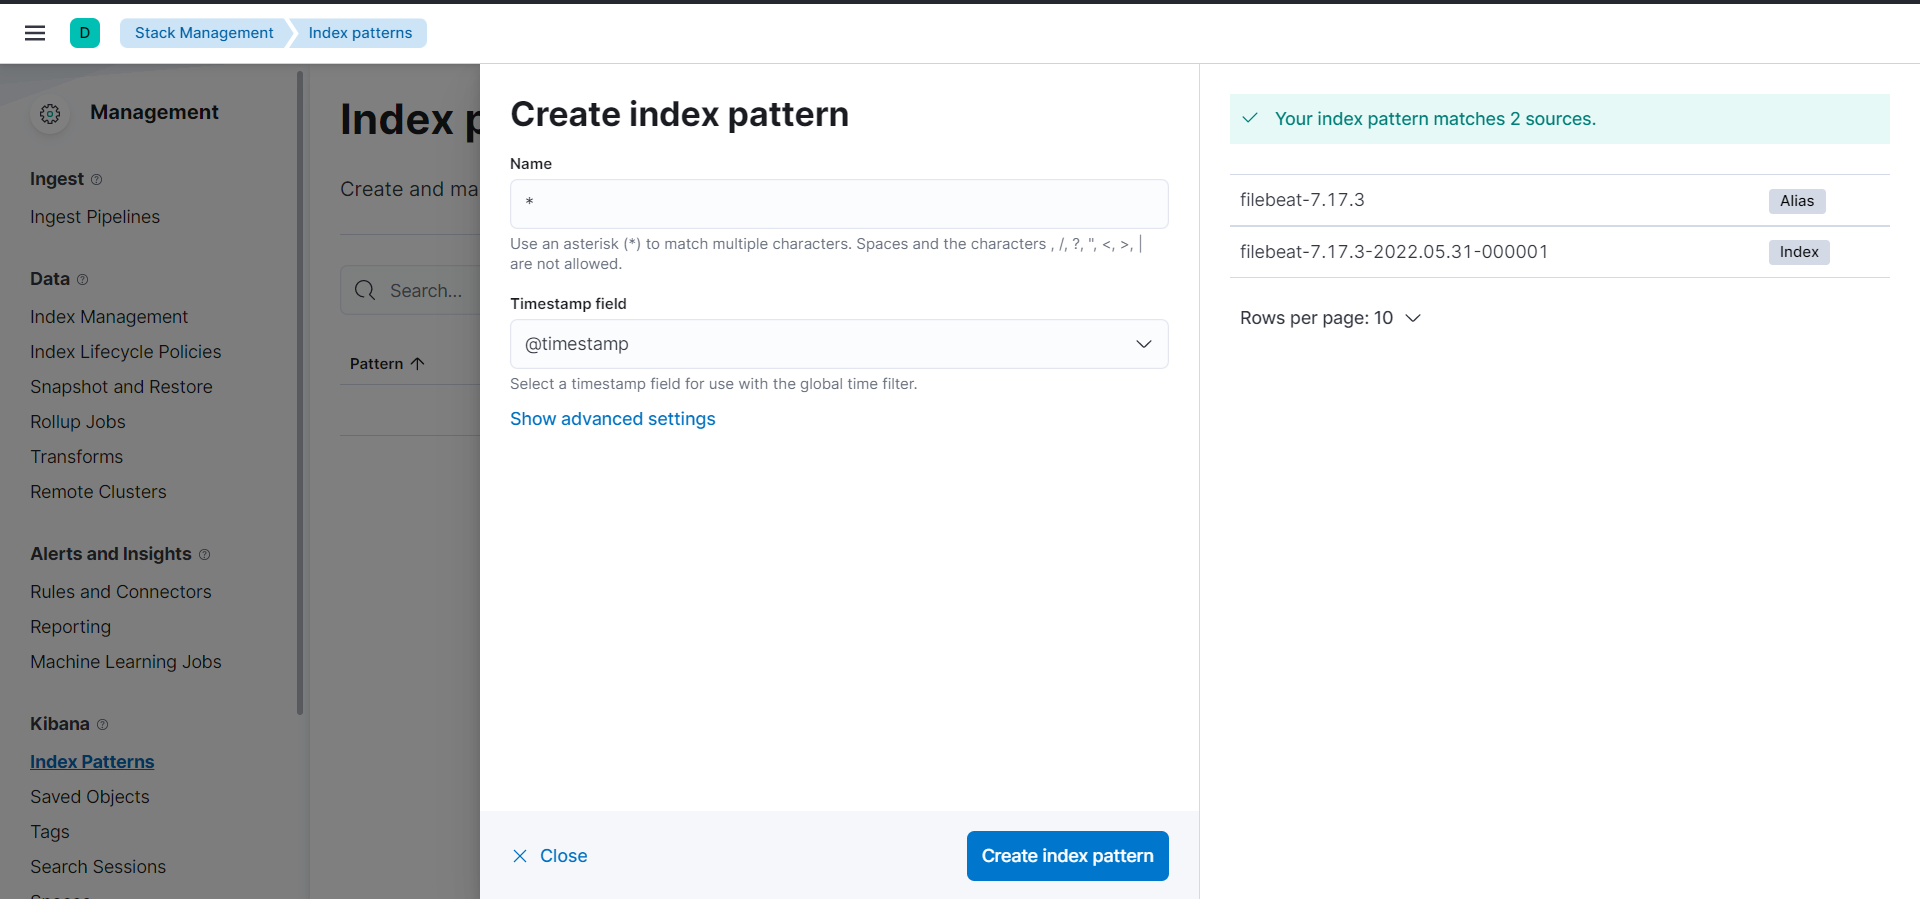
- Name the index pattern and select the timestamp field ( for eg:@timestamp) and click on create.
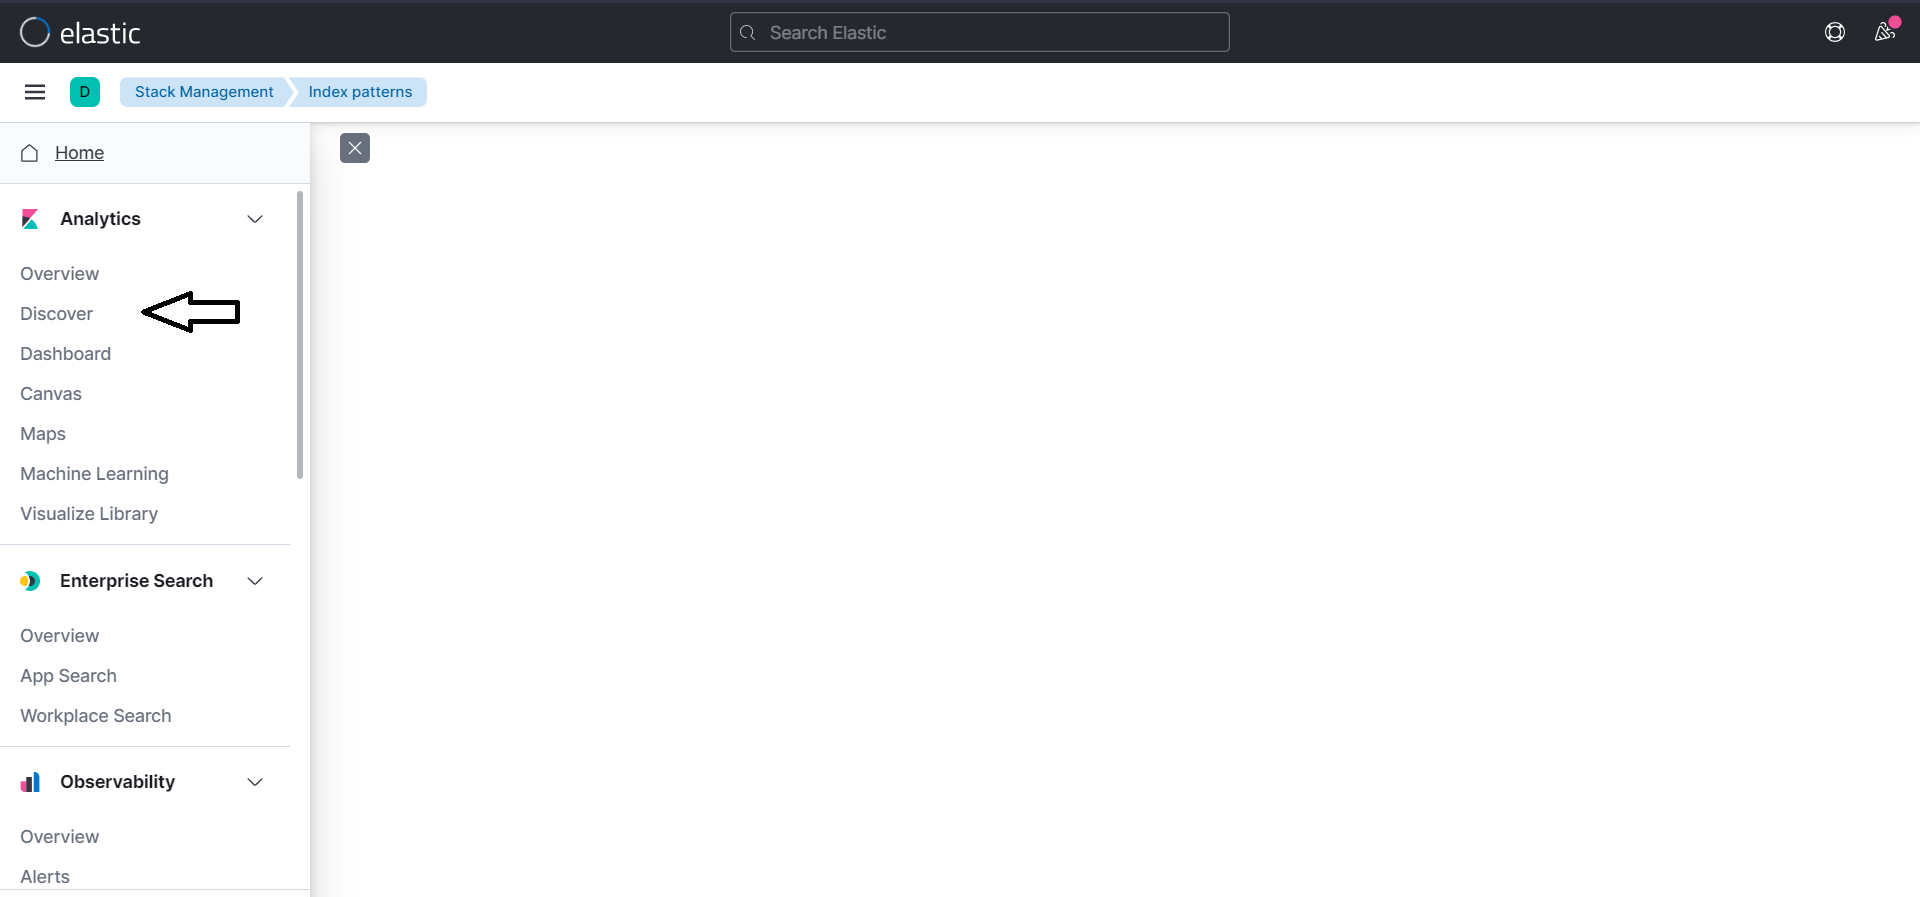
- Move to “discover” option and there you can see all the logs collected by the Filebeat which is now displayed in the Kibana dashboard.
- You can customize the filter according to the resources present in your Kubernetes cluster.