Model Monitoring
Model Monitoring is an operational stage in the machine learning lifecycle that comes after model deployment. It entails monitoring your ML models for changes such as model degradation, data drift, and concept drift, and ensuring that your model is maintaining an acceptable level of performance. Our model monitoring tool is available to automate model evaluation and provide alerts when production models have degraded to the point where an expert should perform a detailed evaluation.
Use Katonic Model Monitoring for -
Built-in Model Monitoring
Automated Retraining
1.1. Navigate to deploy section from sidebar on the platform.
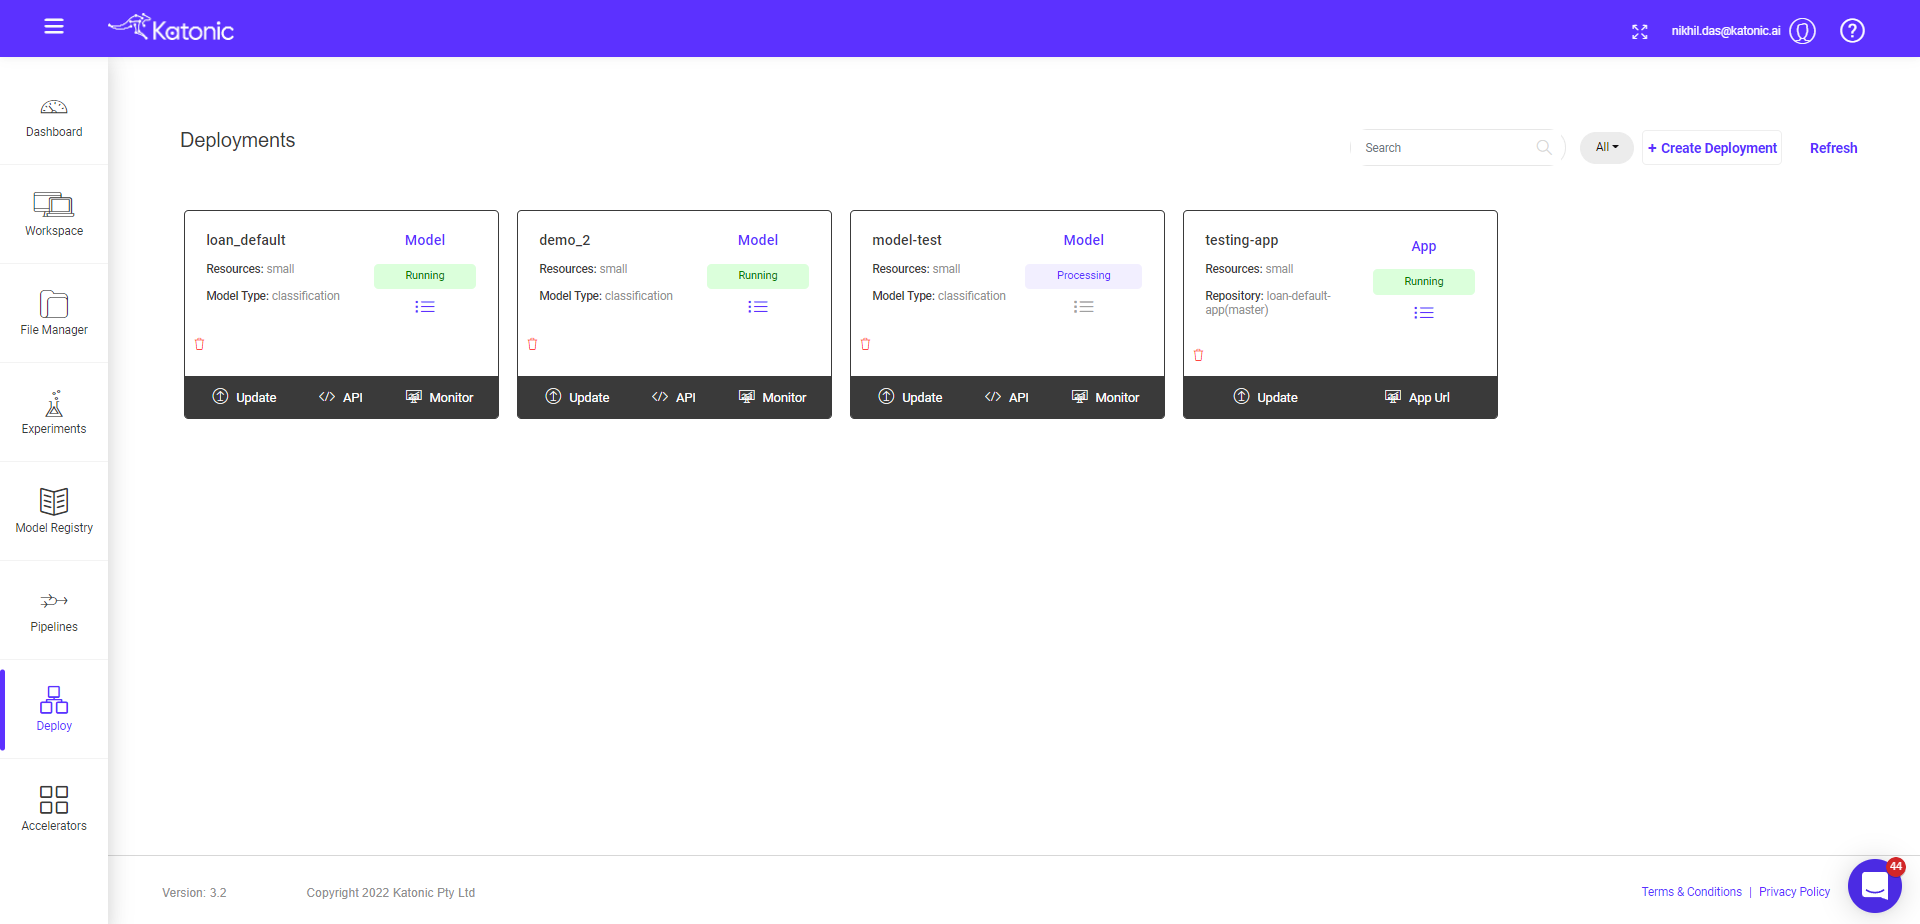
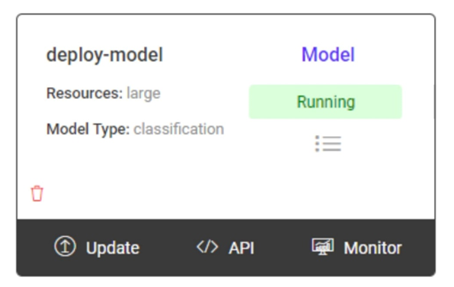
1.2. Click on ‘Monitor’ to monitor the effectiveness and efficiency of your deployed model.
1.3. In Katonic Model Monitoring’ that opens up in a new tab, you can get real-time insights and alerts on model performance and data characteristics. You can also debug anomalies and initiate trigger to execute ML production pipelines to retrain the models with new data, depending on your use case.
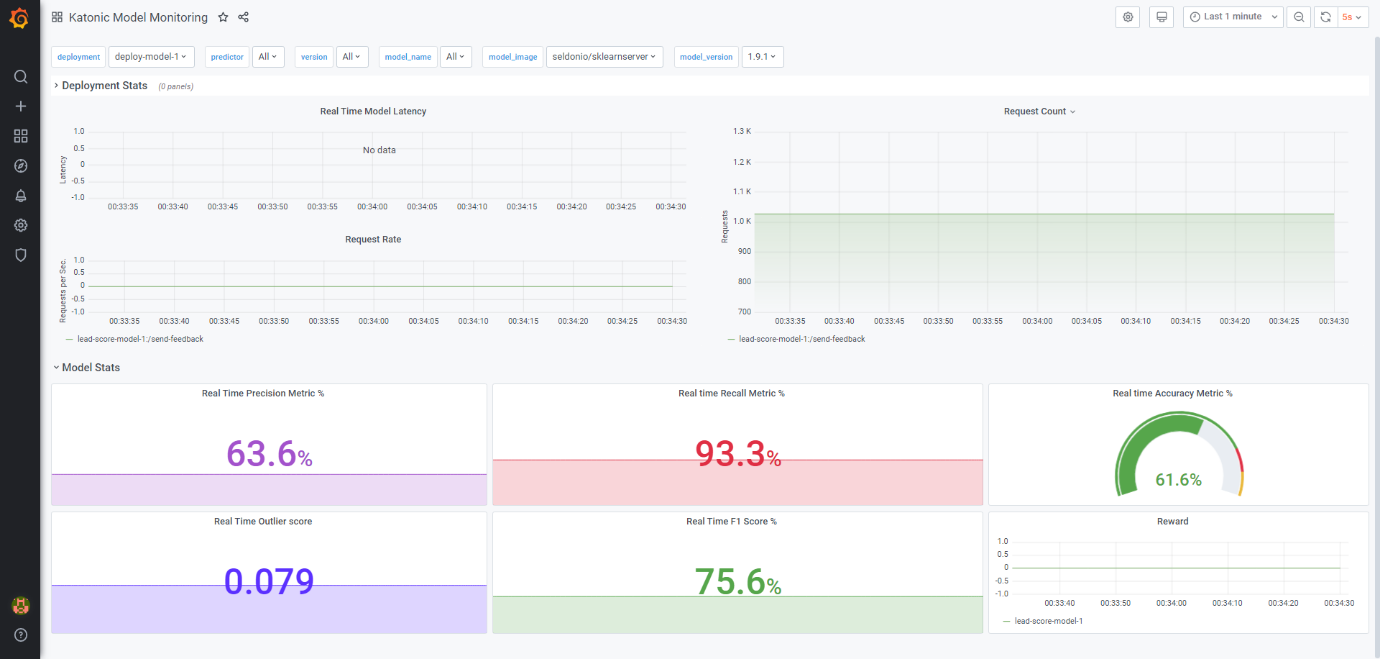
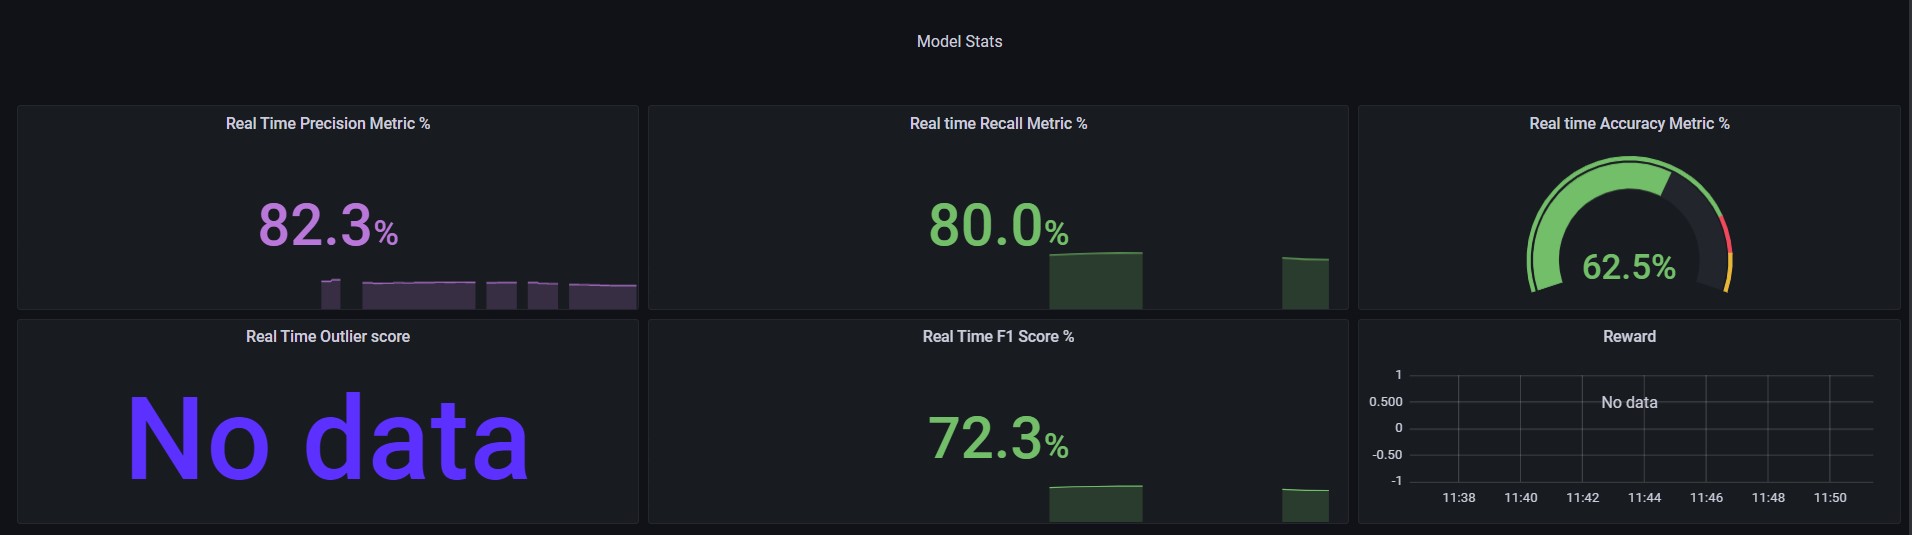
In the Dashboard, we provide total of 7 metrices, 3 operational and 4 model based on real time feedback, these metrices are:
Operational (for classification/Regression):
Real time request latency
Real time request rate
Real time request count
For Classification Dashboard
1. Recall Score
The recall is the ratio tp / (tp + fn) where tp is the number of true positives and fn the number of false negatives. The recall is intuitively the ability of the classifier to find all the positive samples. The best value is 1 and the worst value is 0.
2. Precision Score
The precision is the ratio tp / (tp + fp) where tp is the number of true positives and fp the number of false positives. The precision is intuitively the ability of the classifier not to label as positive a sample that is negative. The best value is 1 and the worst value is 0.
3. F1 Score
The F1-score combines the precision and recall of a classifier into a single metric by taking their harmonic mean. It is primarily used to compare the performance of two classifiers. Suppose that classifier A has a higher recall, and classifier B has higher precision.
4. Accuracy
Accuracy is one metric for evaluating classification models. Informally, accuracy is the fraction of predictions our model got right.
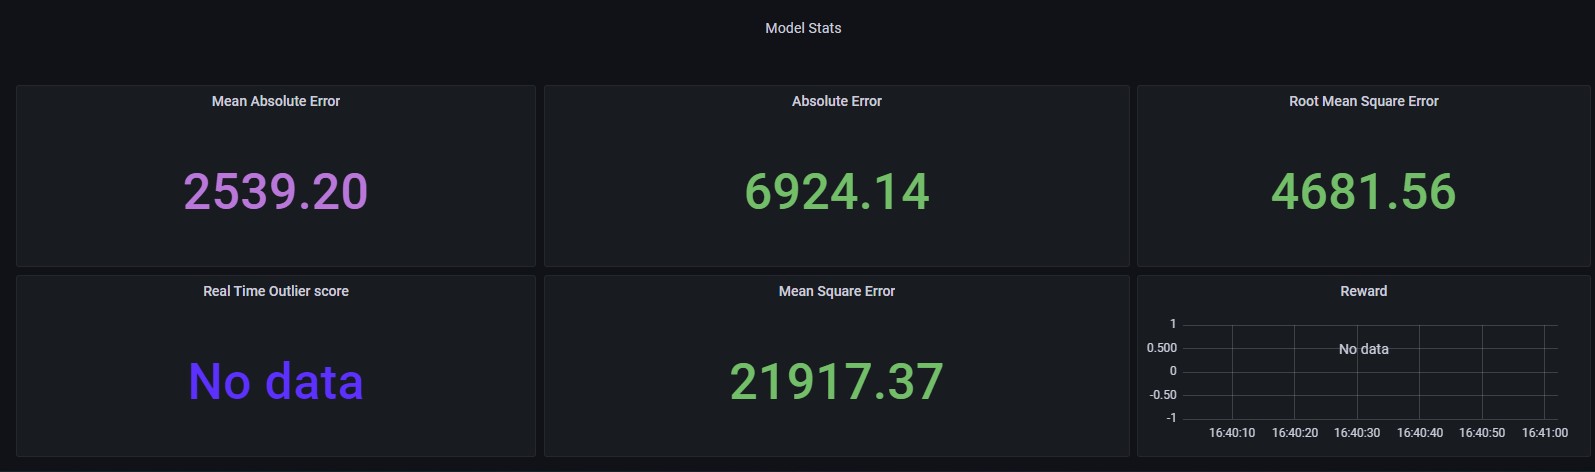
For Regression Dashboard
1. Mean Squared Error
The mean squared error (MSE) tells you how close a regression line is to a set of points. It does this by taking the distances from the points to the regression line (these distances are the “errors”) and squaring them. The squaring is necessary to remove any negative signs.
2. Root Mean Squared Error
Root Mean Square Error (RMSE) is the standard deviation of the residuals (prediction errors). Residuals are a measure of how far from the regression line data points are; RMSE is a measure of how spread out these residuals are. In other words, it tells you how concentrated the data is around the line of best fit.
3. Absolute Error
The absolute value of the difference between an observed value of a quantity and the true value the difference between true length and measured length is called the error of measurement or absolute error.
4. Mean Absolute Error
Mean Absolute Error is a model evaluation metric used with regression models. The mean absolute error of a model with respect to a test set is the mean of the absolute values of the individual prediction errors on over all instances in the test set.