Experiments
Experiments
Katonic Platform provides a central place to organize your ML experimentation. With the Katonic SDK you can log and display metrics, parameters, images and other ML metadata. In the Experiment Interface you can search, group and compare runs with no extra efforts. You can see and debug experiments live as they are running and query experiment metadata programmatically.
Why Experiment Tracking is an important component?
An experiment tracker is a powerful tool for MLOps products, enabling efficient and organized management of experiments. By centralizing experiment data, facilitating metadata tracking, promoting documentation and annotation, enabling visualization and reporting, and integrating with existing workflows, experiment trackers empower organizations to drive reproducibility, collaboration, and continuous improvement in their ML model development process.
Things that can be done in the Experimentation components are:
Creating Experiments
In Katonic, the experiment feature enables users to group their models and associated metrics for better organization. For instance, users can compare models built in TensorFlow and PyTorch and assign a name to the experiment, such as
pytorch_tensorflow. This approach helps organize the workspace by providing a clear understanding of the context behind trained models.Model and metric logging
The Katonic SDK offers the capability to save models in a modularized format while logging all associated metrics throughout the model run. A model run encompasses the complete pipeline of model training, testing, and validation. With the SDK, users can train, evaluate, and validate their models, logging metrics for each step of the process. This logging feature enables efficient comparison of different hyperparameter training experiments, simplifying the analysis of results.
Comparing model metrics
The Katonic Experiment interface provides the capability to compare multiple models and their metrics simultaneously. This feature proves particularly useful when conducting validation and fine-tuning of model hyperparameters.
Running an Experiment using Katonic SDK and Katonic Platform Interface
This is a walkthrough of a simple example to help you get started with Experiments in Katonic platform.
Let's build a simple machine learning project, Diabetes prediction. The objective of the use case is to diagnostically predict whether or not a patient has diabetes based on certain diagnostic measurements included in the dataset.
Load the Dataset
## imports
from katonic.ml.classification import Classifier
import pandas as pd
import numpy as np
from sklearn.model_selection import train_test_split
from sklearn.metrics import accuracy_score, roc_auc_score
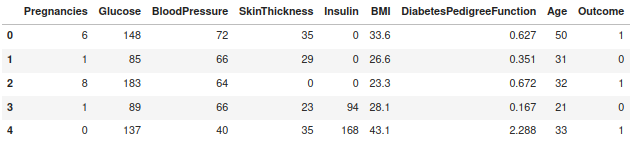
## Load the Data set
df = pd.read_csv('https://raw.githubusercontent.com/plotly/datasets/master/diabetes.csv')
df.head()
Split the Datatset and Perform Experimentation
    x = df.drop(columns=['Outcome'], axis=1)
    y = df['Outcome']

    X_train, X_test, y_train, y_test = train_test_split(x, y, test_size=.20,random_state=98)


    ## let's create experiment.
    exp_name = 'diabetes_prediction_classifier'
    # Initiate the classifier instance

    clf = Classifier(X_train,X_test,y_train,y_test, exp_name)
    exp_id = clf.id
    print("experiment name : ",clf.name)
    print("experiment location : ",clf.location)
    print("experiment id : ",clf.id)
    print("experiment status : ",clf.stage)
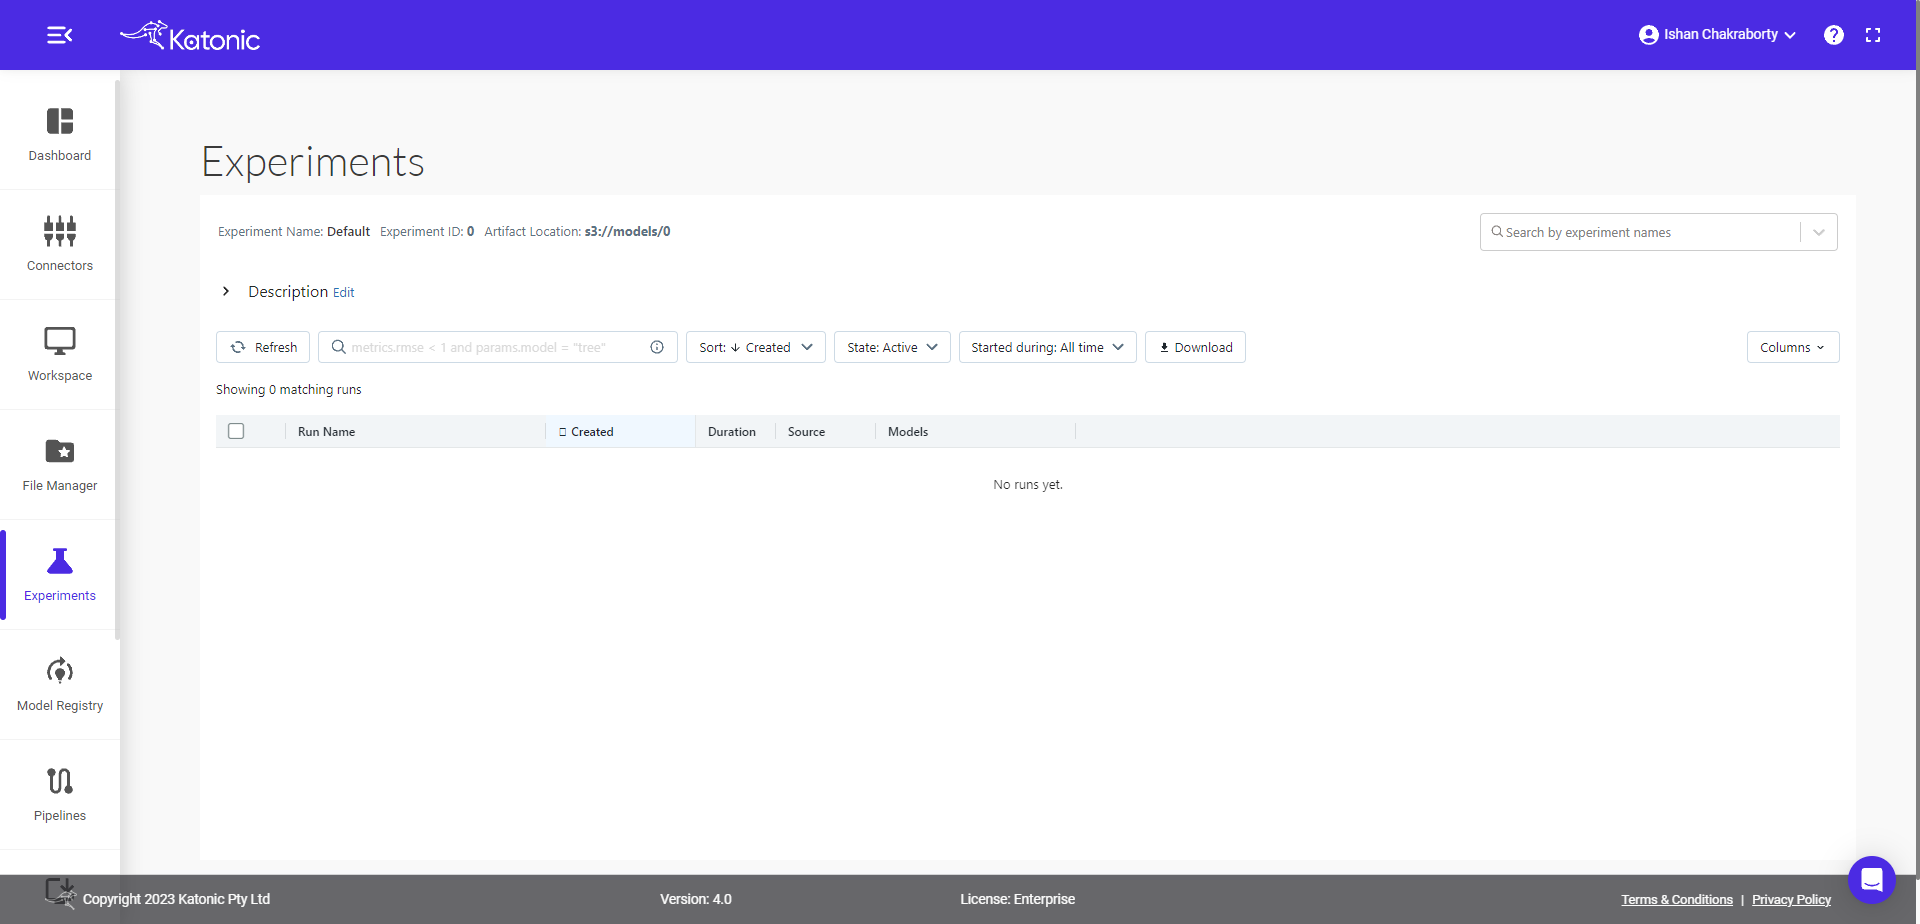
Now you can see an experiment of diabetes_prediction has been created and is been logged under the Experimentation section of the platform.

Note: When you select the experiment, you will notice there are no model runs yet. It is just an empty experiment; we will now start training different models and compare them later.
Let's train and log some models
Model Training
    ##Logistic regression
    clf.LogisticRegression()
    ##Decision TreeClassifier
    clf.DecisionTreeClassifier(max_depth=8, criterion='gini', min_samples_split=3)
Up to this point we have trained two models, all the necessary logs/model metrics will be saved implicitly, you don’t have to worry about writing extra lines of code specifically for this. Here you can see, the two models have been logged with the necessary metrics.
You can further investigate the model run by clicking any of their corresponding start time. Once you click that, you can see the following window,
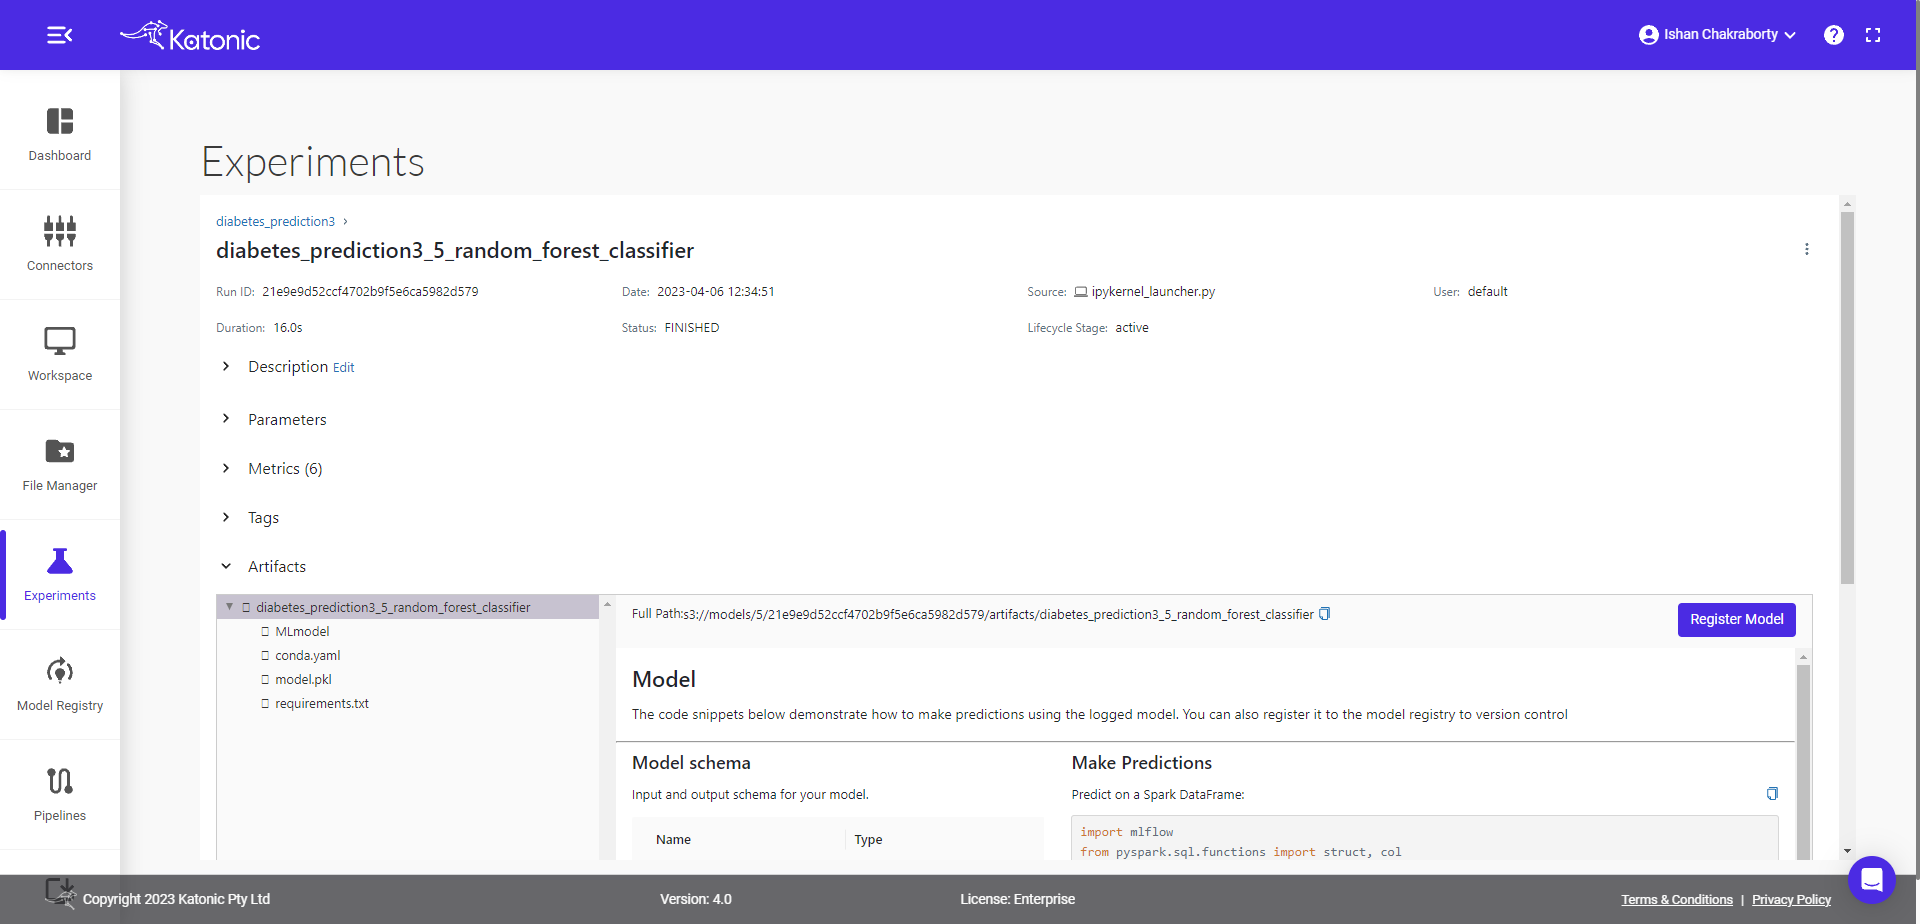
Here you can see the various details corresponding to given model run, the details of parameters used in the models, metrics tracked while training/testing model, associated artifacts and full path for the model registry where the serialized file of model is saved.
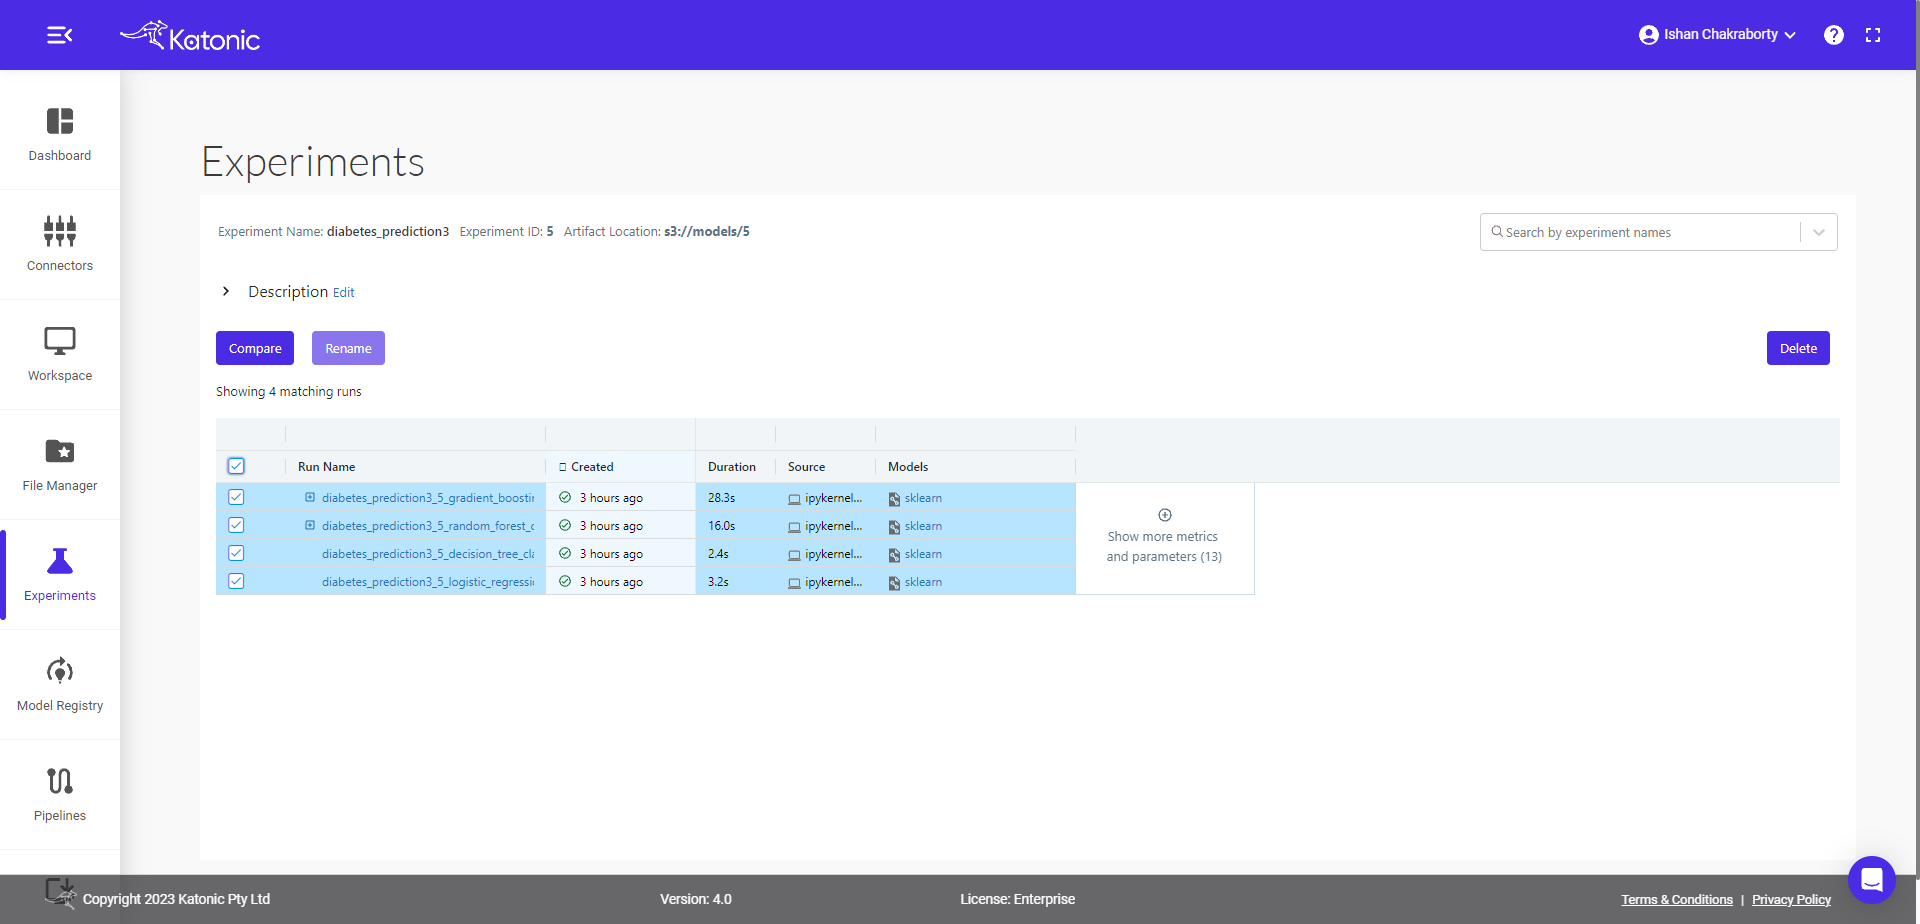
Let's come back to the previous window and compare both runs.
You can compare different model runs in the given experiment window. First select the runs, you want to compare, then click on the compare button.
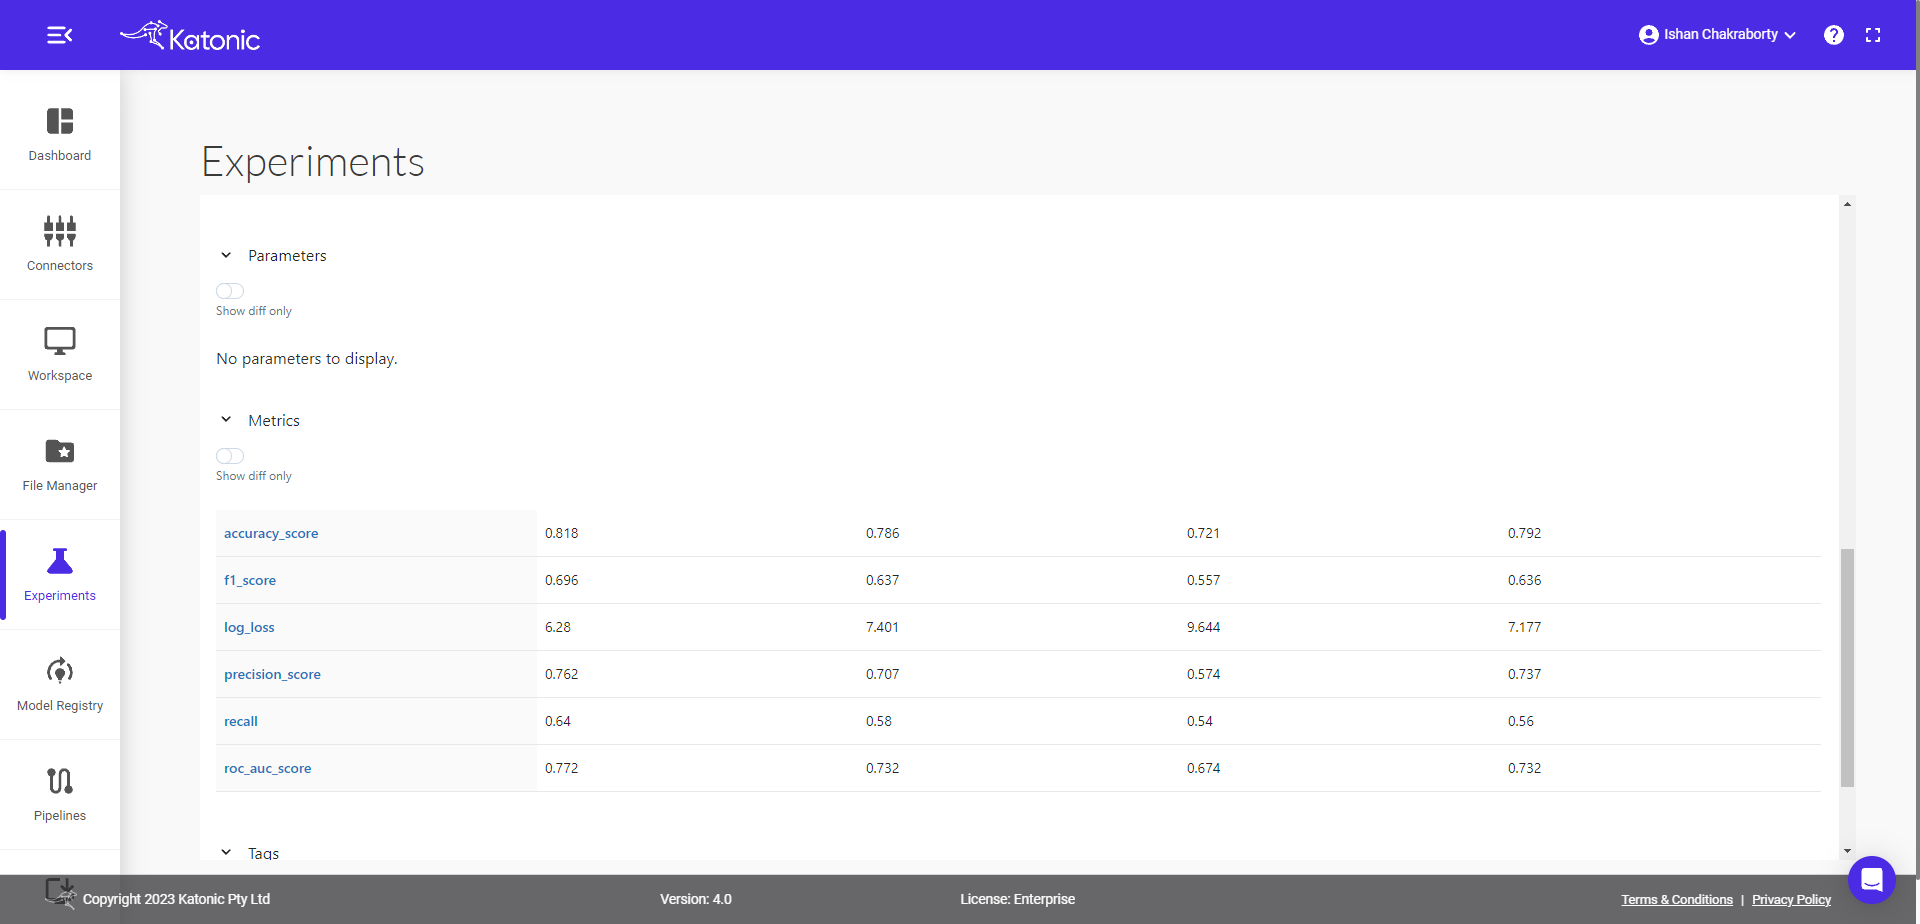
You will be taken to new window, where you will find details about plots, parameters and metrics difference.The given window page contains more details, so you need to scroll down to see further details available in the page, like run, parameter and metric details.
Now let's run a random forest model with hyperparameter tuning, and compare all child runs with parameters selected by tuning algorithm.
Parameters passed for hyperparameter tuning
## define parameters space for searching best parameters
params = {
'n_estimators': {
    'low': 80,
    'high': 120,
    'step': 10,
    'type': 'int'
    },
'criterion':{
    'values': ['gini', 'entropy'],
    'type': 'categorical'
    },
'min_samples_split': {
    'low': 2,
    'high': 5,
    'type': 'int'
    },
'min_samples_leaf':{
    'low': 1,
    'high': 5,
    'type': 'int'
    }
}


## train, tune and log Random Forest model.
clf.RandomForestClassifier(is_tune=True,n_trials=5, params=params)
Now come back to Experiment interface, you will see the + sign in front of one of the start time(corresponds to parent run), once you expand that + option you will see all the child runs.
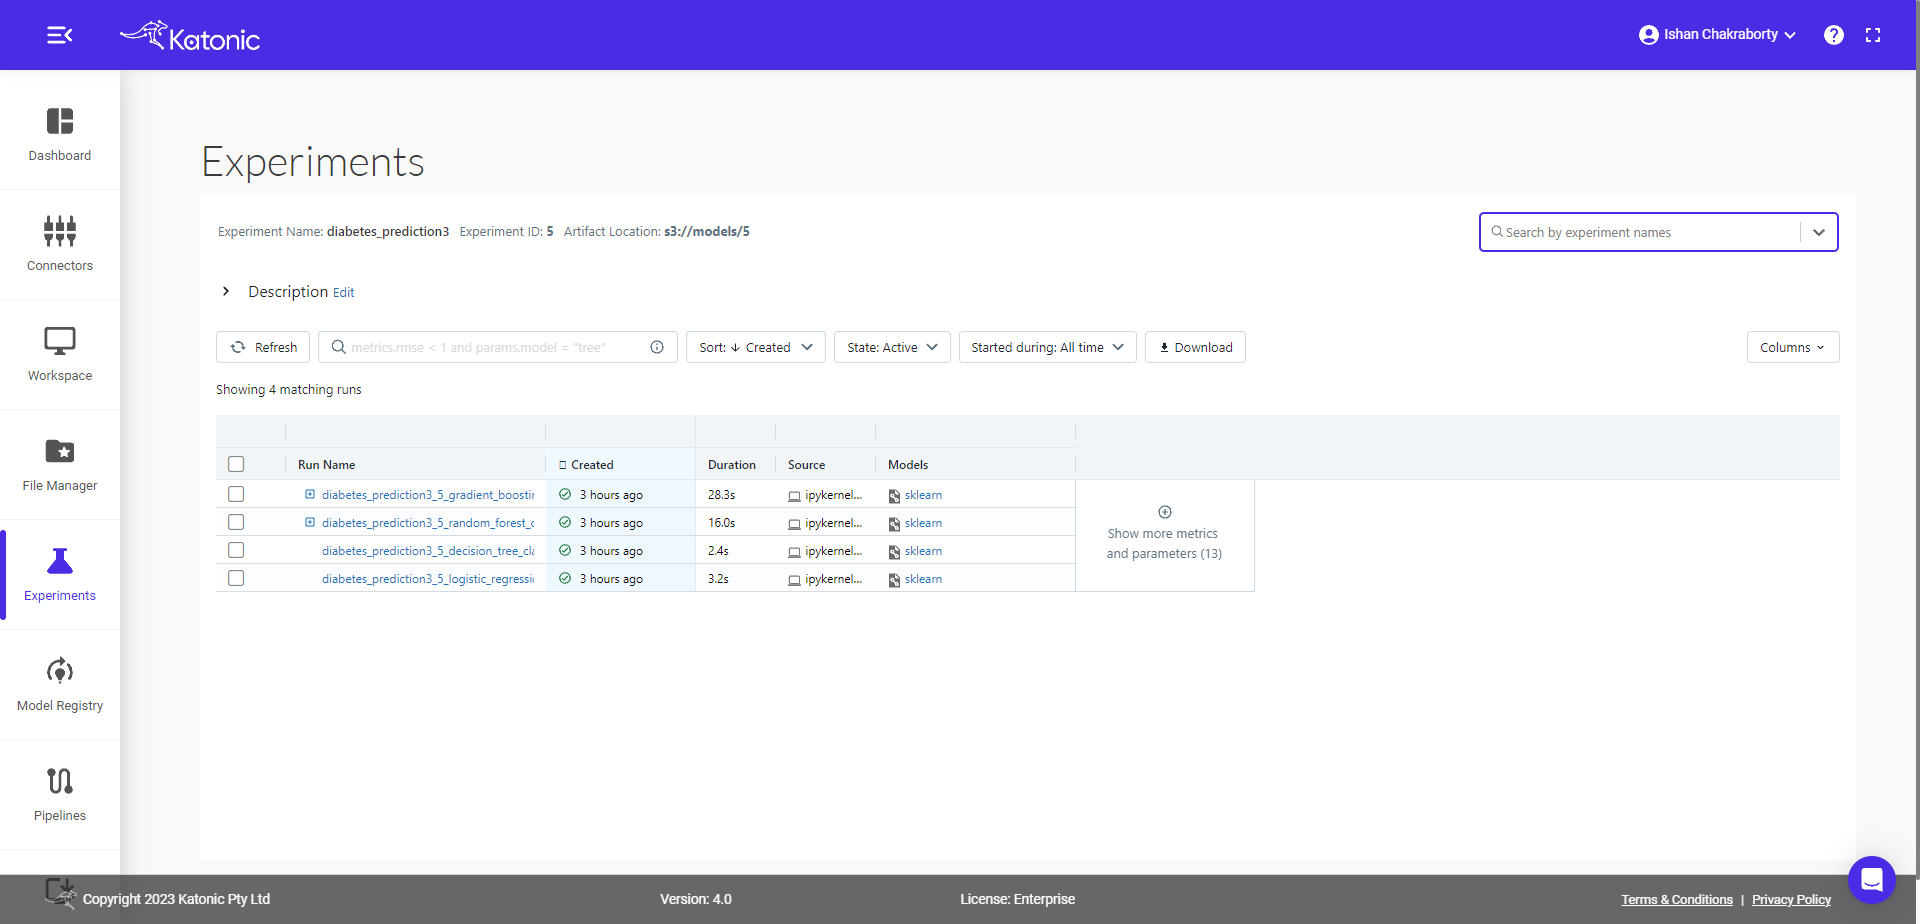
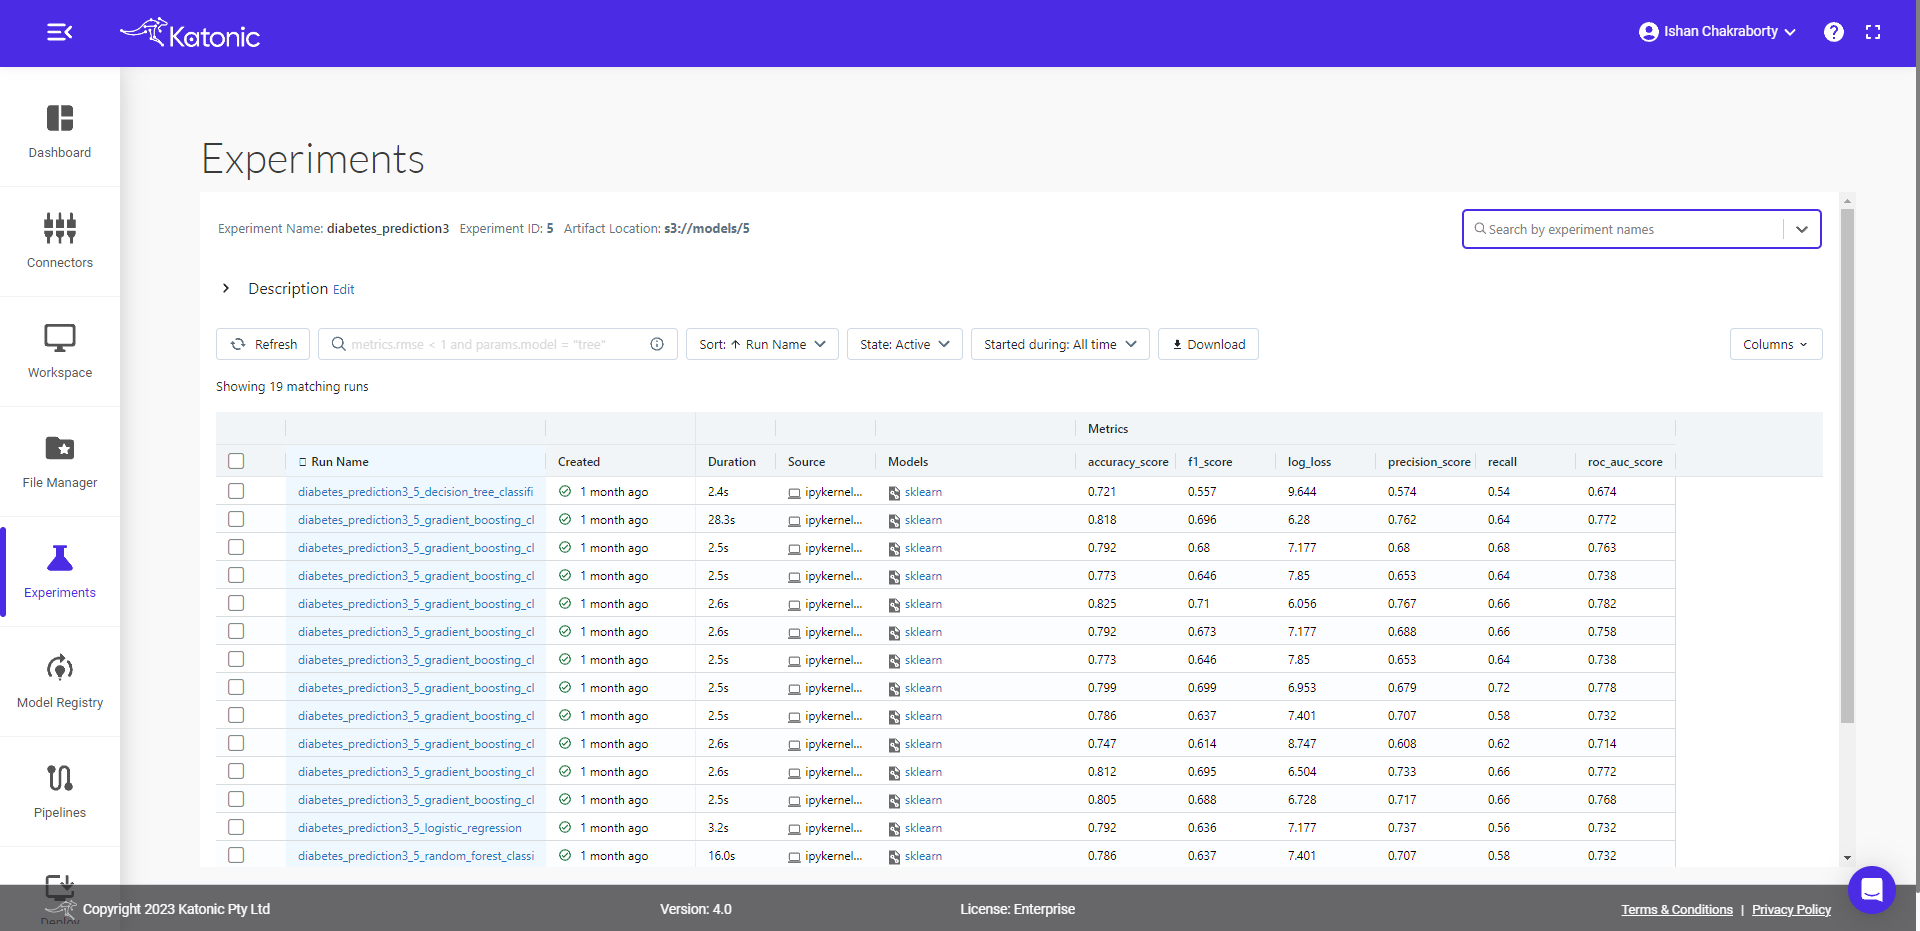
After Models column you can see ⊕ which gives you the flexibility to select more columns like different parameters, metrics, tags etc to visualize in the same table.
Now we will compare the child runs and see the parallel plots on how different parameters are affecting the accuracy metrics (default).
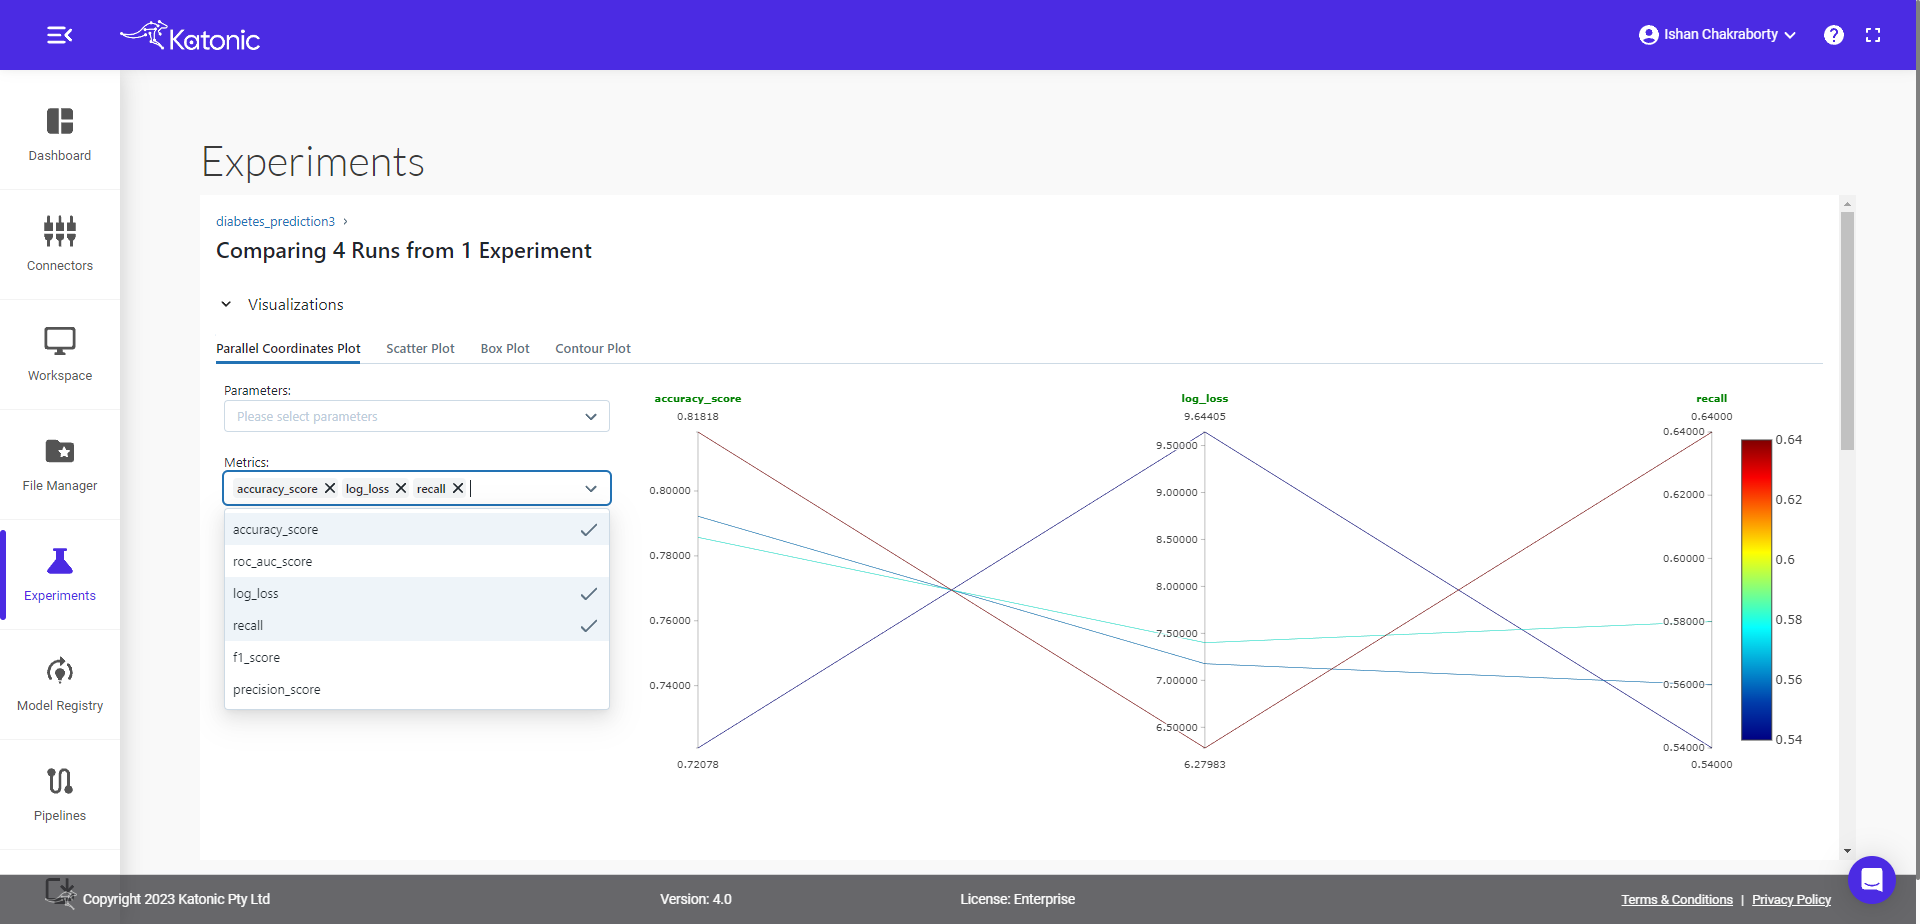
In the metrics tab, you can see, accuracy is default variable, but you can choose other metrics also and visualize the effect of different parameters on the given metric value.
This tutorial covers
● How to create experiments through SDK and interact with user interface.
● How to train and log models.
● How to compare runs of two different models.
● How to visualize and compare runs of hyperparameter tuned model.
Getting curious to know more
● To train and log other models see documentation of Katonic SDK.
● To know how to register model, create new versions and transition model to different stages see our Model Registry Documentation.