Pipelines
Pipelines are components that orchestrates machine learning applications. Orchestration is necessary because a typical machine learning implementation uses a combination of tools to prepare data, train the model, evaluate performance, and deploy. By formalizing the steps and their sequencing in code, pipelines allow users to formally capture all of the data processing steps, ensuring their reproducibility and auditability, and training and deployment steps.
What is a Pipeline?
A pipeline is a description of an ML workflow, including all of the components in the workflow and how they combine in the form of a graph. The pipeline includes the definition of the inputs (parameters) required to run the pipeline and the inputs and outputs of each component.
A pipeline component is a self-contained set of user code, packaged as a Docker image, that performs one step in the pipeline. For example, a component can be responsible for data pre-processing, data transformation, model training, and so on.
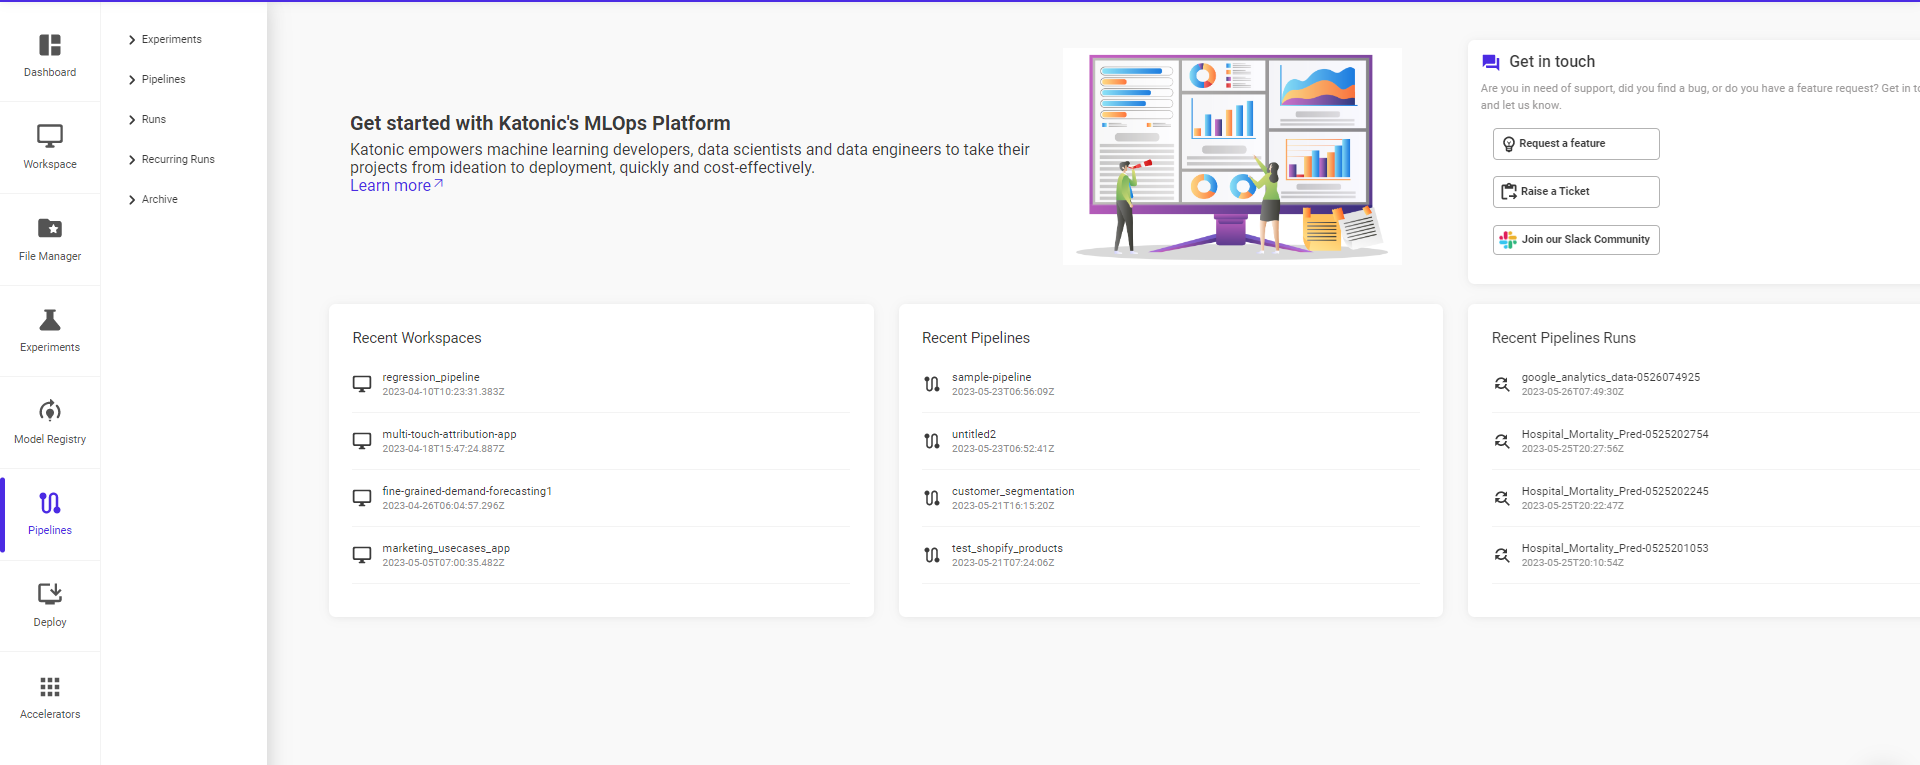
Getting Started with Pipelines
The Pipelines UI consists of:
A UI for managing and tracking pipelines and their execution
An engine for scheduling a pipeline’s execution
An SDK for defining, building, and deploying pipelines in Python
Notebook support for using the SDK and pipeline execution
The runtime execution graph of the pipeline
A graph is a pictorial representation in the Pipelines UI of the runtime execution of a pipeline. The graph shows the steps that a pipeline run has executed or is executing, with arrows indicating the parent/child relationships between the pipeline components represented by each step. The graph is viewable as soon as the run begins. Each node within the graph corresponds to a step within the pipeline and is labelled accordingly.
The screenshot below shows the example pipeline’s runtime execution graph in the Pipelines UI:
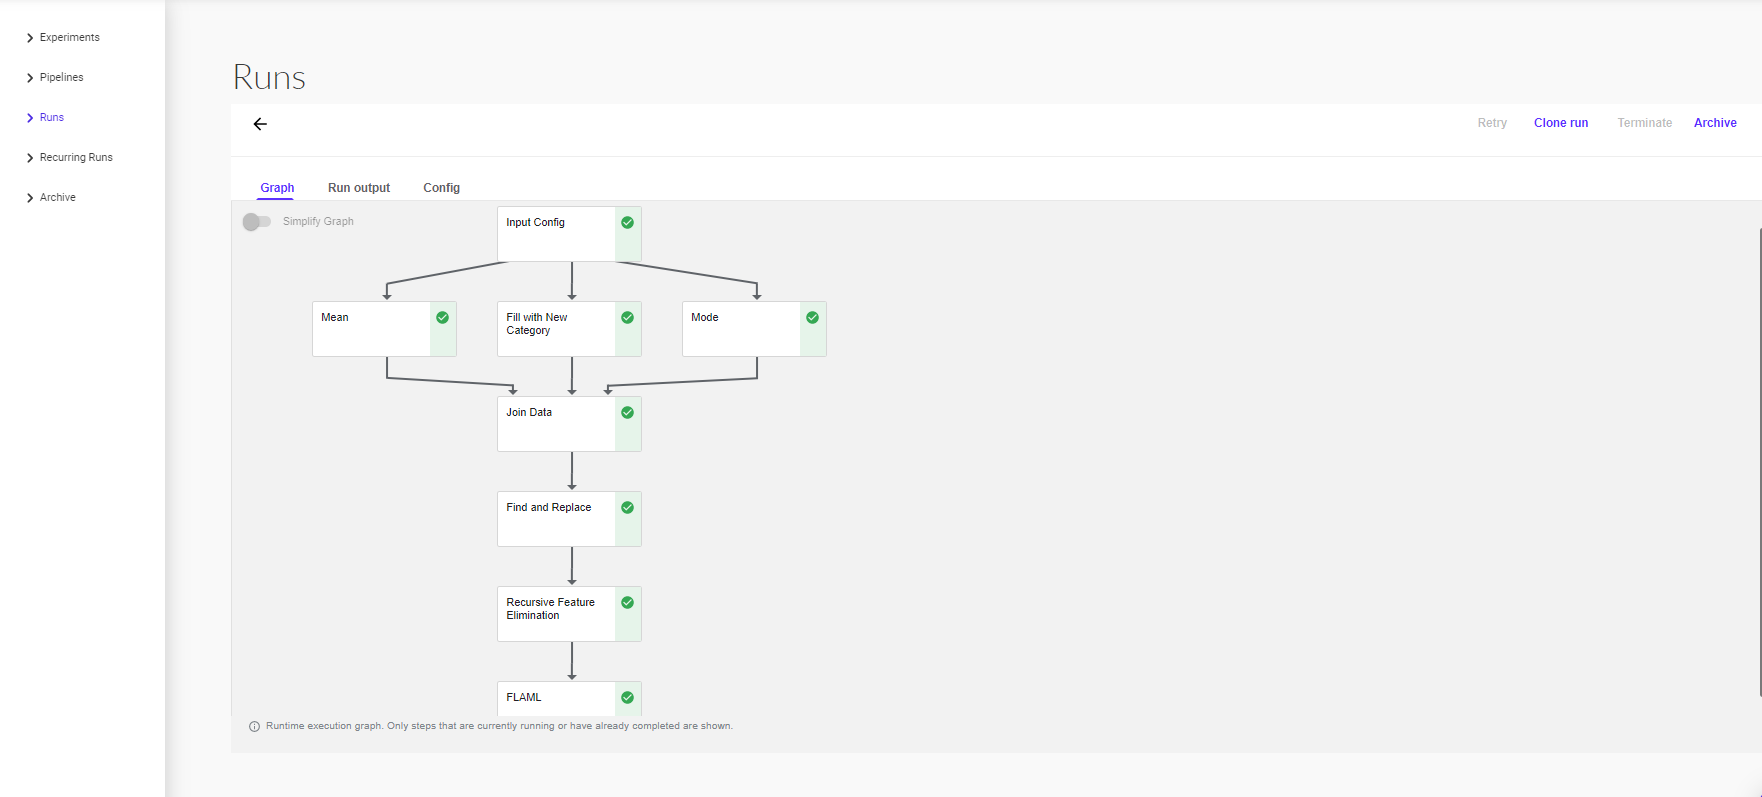
At the top right of each node is an icon indicating its status: running, succeeded, failed, or skipped. (A node can be skipped when its parent contains a conditional clause.)
Pipeline input data on the Pipelines UI
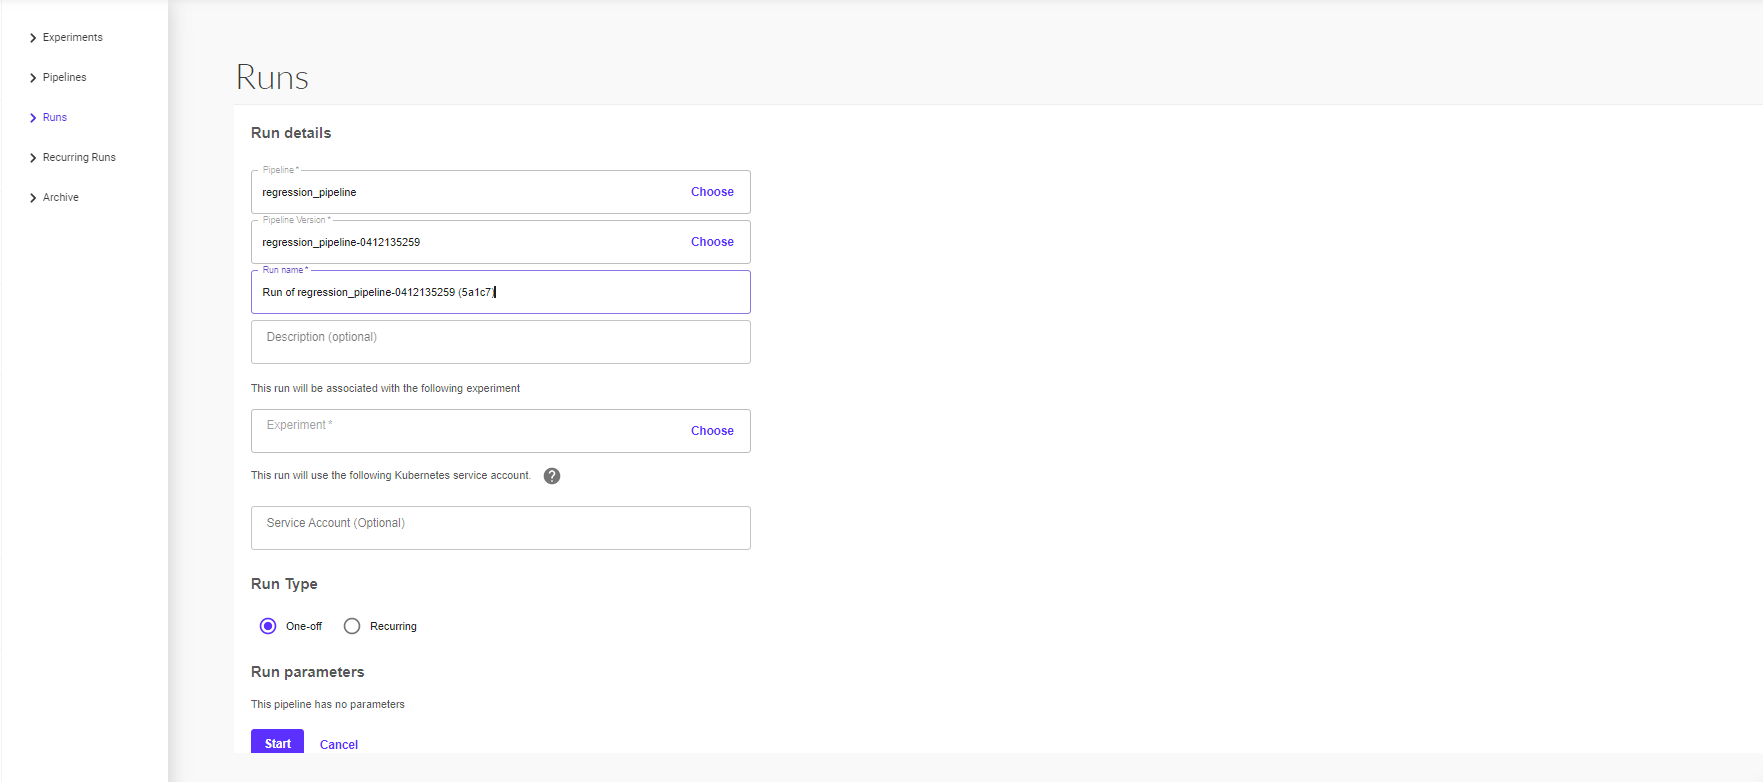
The partial screenshot below shows the Pipelines UI for kicking off a run of the pipeline. The pipeline definition in your code determines which parameters appear in the UI form. The pipeline definition can also set default values for the parameters:
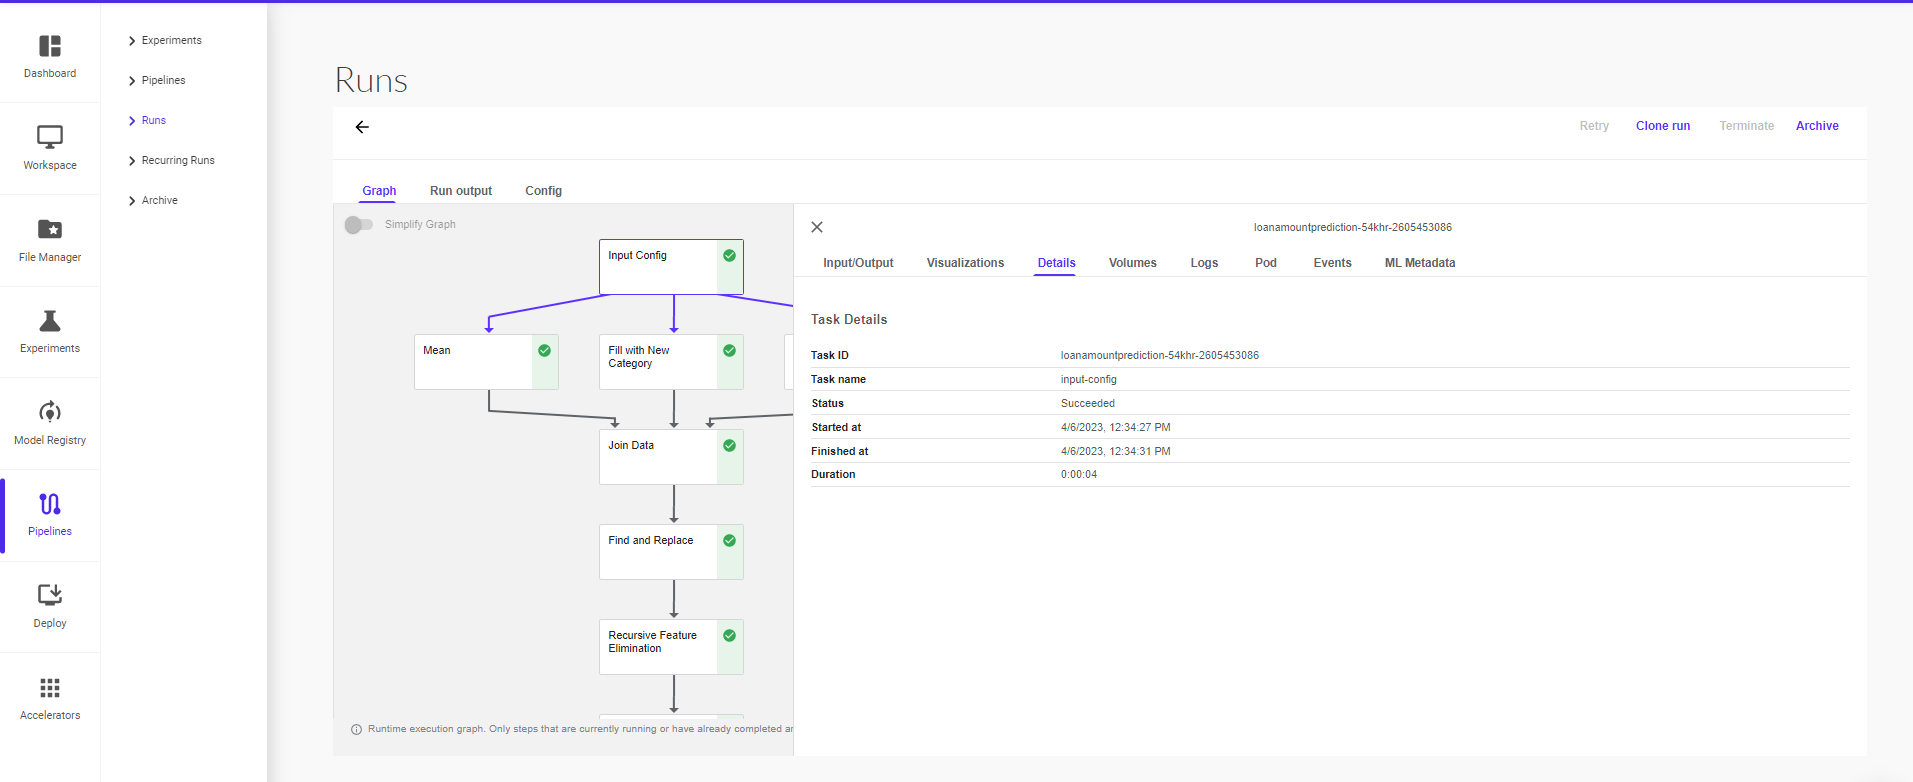
Details about the pipeline
The following screenshot show example of the pipeline Details on the Pipelines UI.
At a high level, the execution of a pipeline proceeds as follows:
Python SDK: You create components or specify a pipeline using the Pipelines domain-specific language (DSL).
DSL compiler: The DSL compiler transforms your pipeline’s Python code into a static configuration (YAML).
Pipeline Service: You call the Pipeline Service to create a pipeline run from the static configuration.
Kubernetes resources: The Pipeline Service calls the Kubernetes API server to create the necessary Kubernetes resources (CRDs) to run the pipeline.
Orchestration controllers: A set of orchestration controllers execute the containers needed to complete the pipeline. The containers execute within Kubernetes Pods on virtual machines. An example controller is the Argo Workflow controller, which orchestrates task-driven workflows.
Artifact storage: The Pods store two kinds of data:
Metadata: Experiments, jobs, pipeline runs, and single scalar metrics. Metric data is aggregated for the purpose of sorting and filtering. Pipelines stores the metadata in a MySQL database.
Artifacts: Pipeline packages, views, and large-scale metrics (time series). Use large-scale metrics to debug a pipeline run or investigate an individual run’s performance. Pipelines stores the artifacts in an artifact store like Minio server or Cloud Storage.
Note : The MySQL database and the Minio server are both backed by the Kubernetes PersistentVolume subsystem.
Persistence agent and ML metadata: The Pipeline Persistence Agent watches the Kubernetes resources created by the Pipeline Service and persists the state of these resources in the ML Metadata Service. The Pipeline Persistence Agent records the set of containers that executed as well as their inputs and outputs. The input/output consists of either container parameters or data artifact URIs.
Pipeline web server: The Pipeline web server gathers data from various services to display relevant views: the list of pipelines currently running, the history of pipeline execution, the list of data artifacts, debugging information about individual pipeline runs, execution status about individual pipeline runs
Pipelines UI
Open pipelines from the sidebar to see the different sections present in it.
The following sections are present under pipelines –
Experiment
An experiment is a workspace where you can try different configurations of your pipelines. You can use experiments to organize your runs into logical groups. Experiments can contain arbitrary runs, including recurring runs
To create an experiment from the Pipelines UI:
Select Pipelines from the pop-up sidebar within the Pipelines section.
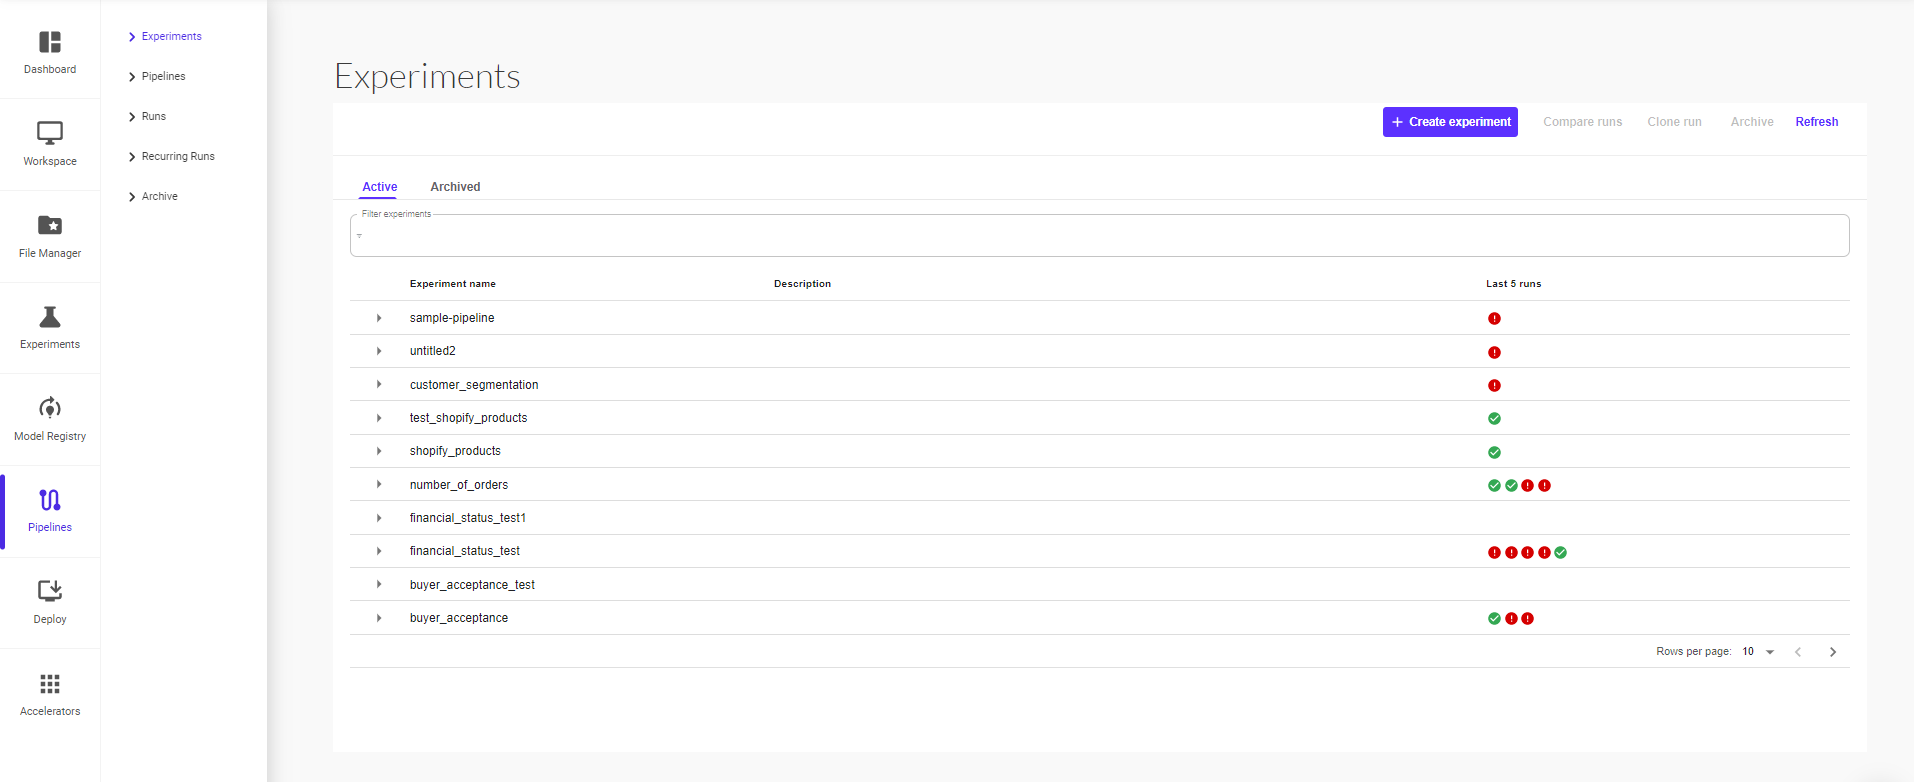
You will see the list of all existing experiments. To create a new experiment, click on ‘Create Experiment’.
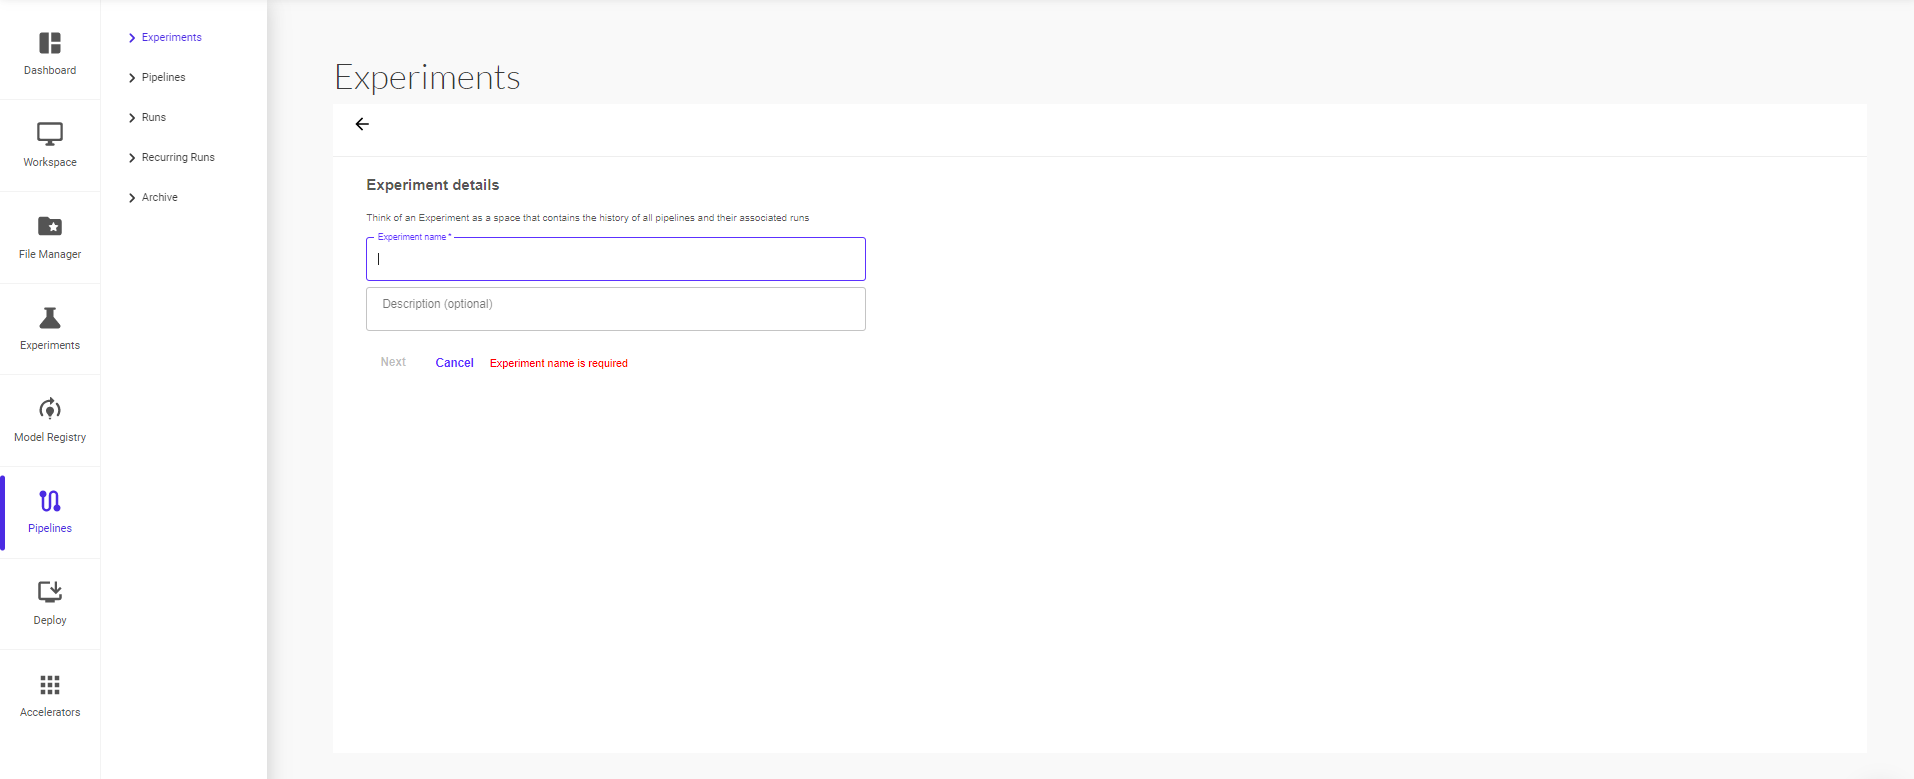
On the ‘Create Experiment’ page, give your experiment a name and short description, and continue to click on next.
On the next page, you can start a pipeline run within the experiment. To start a run, provide the run details (pipeline, pipeline version, run name, run type – one off or recurring)
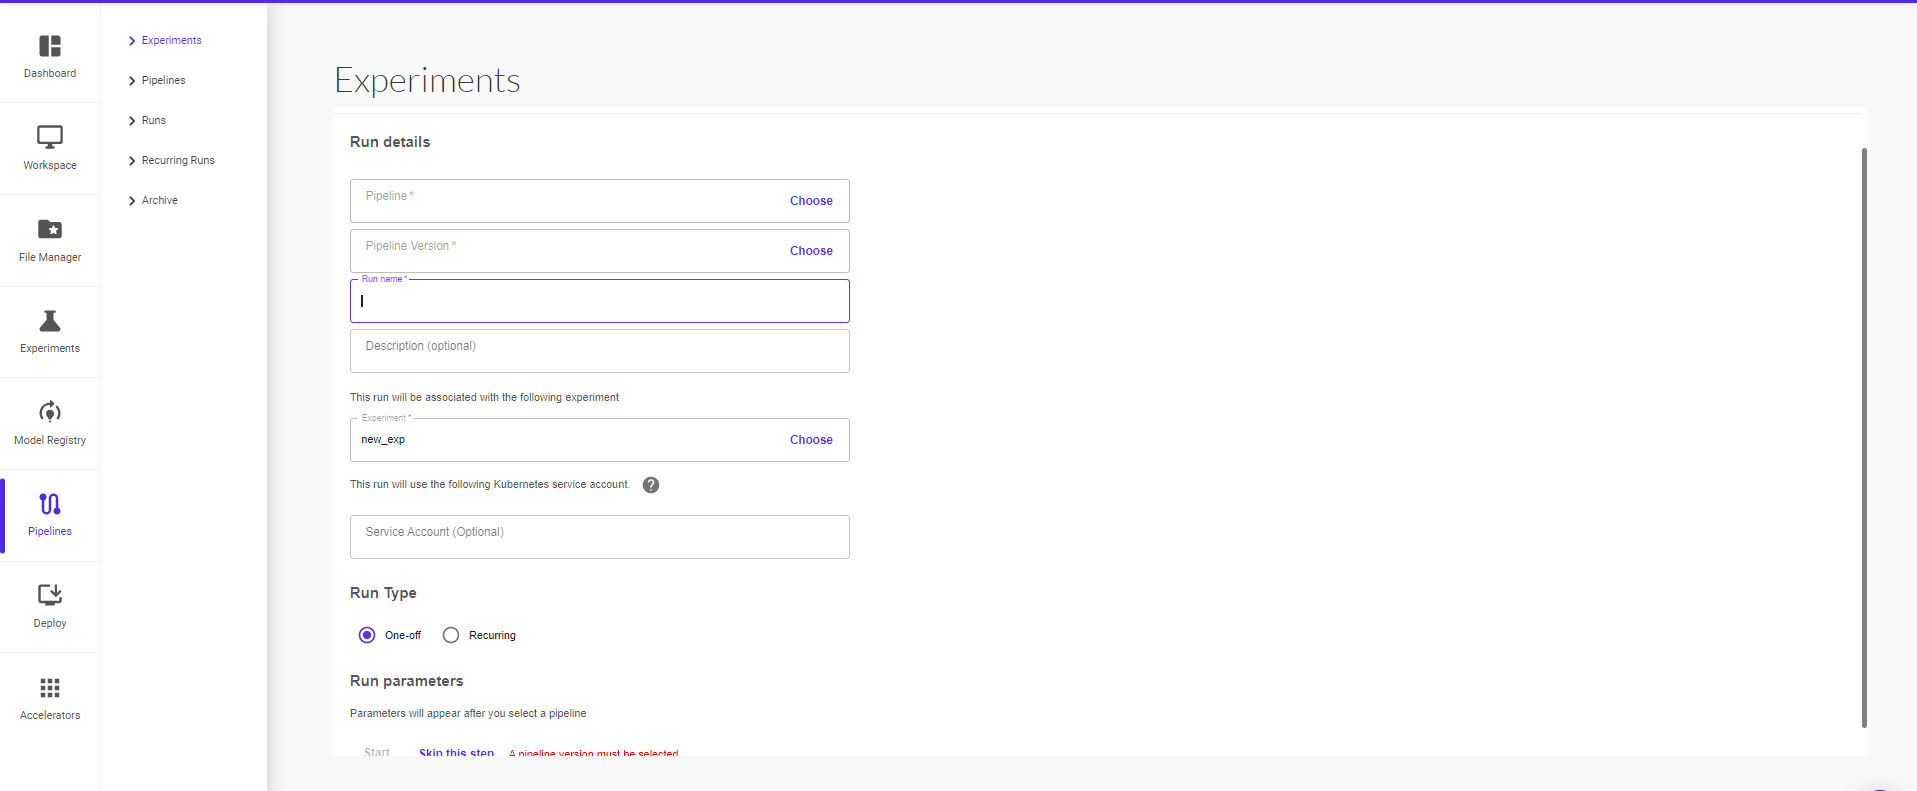
You can optionally click on ‘Skip this step’ to start a run at a later point.
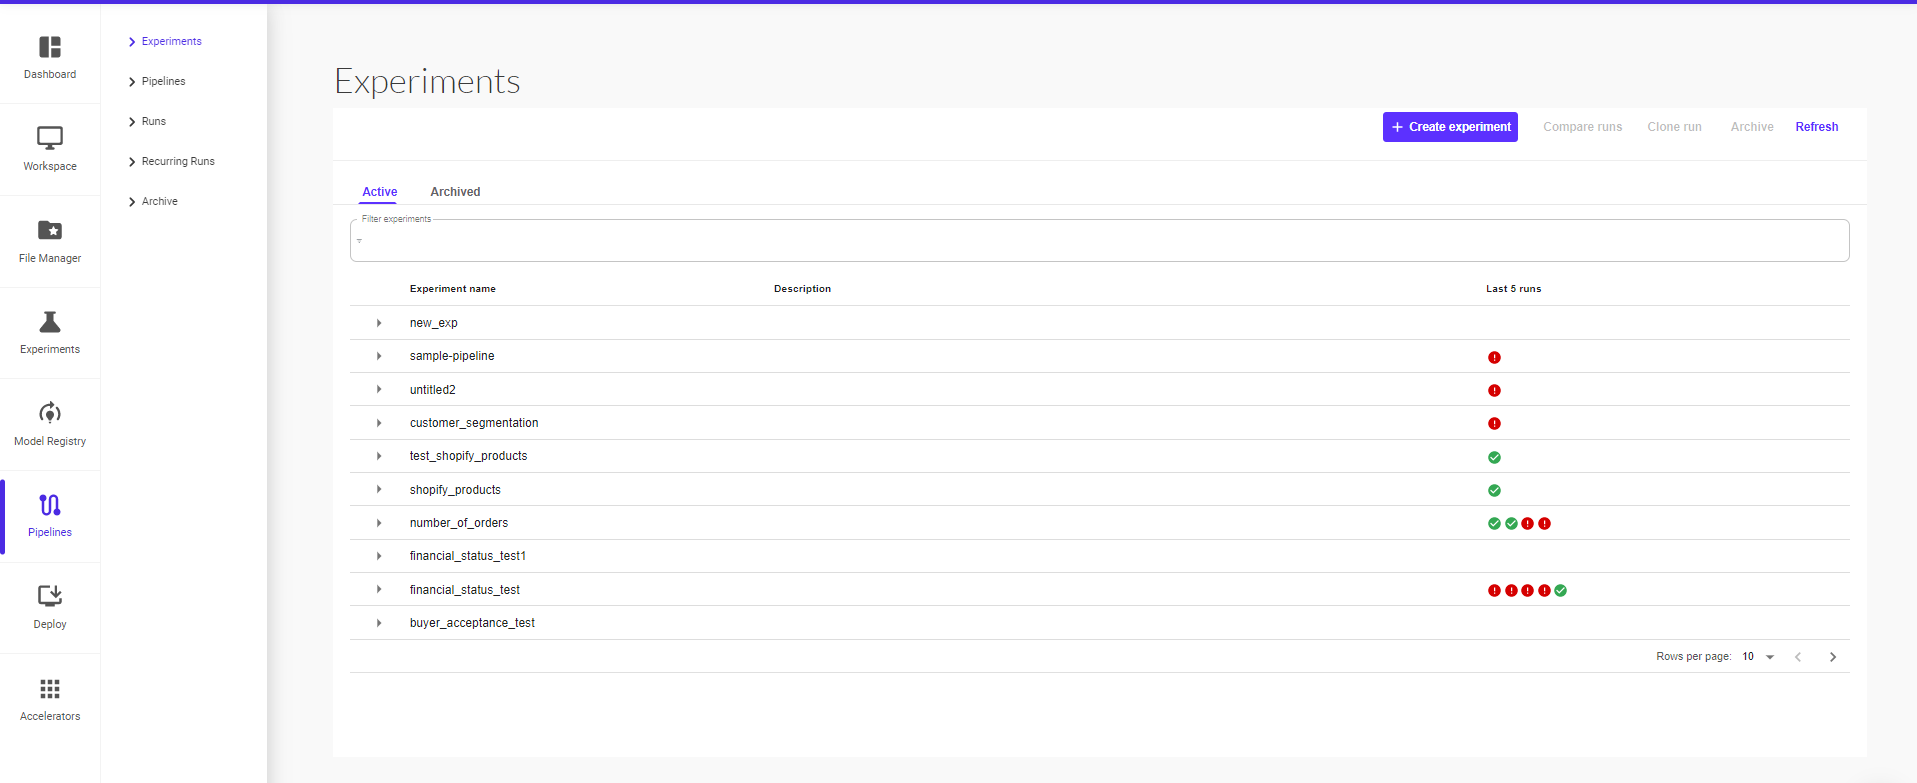
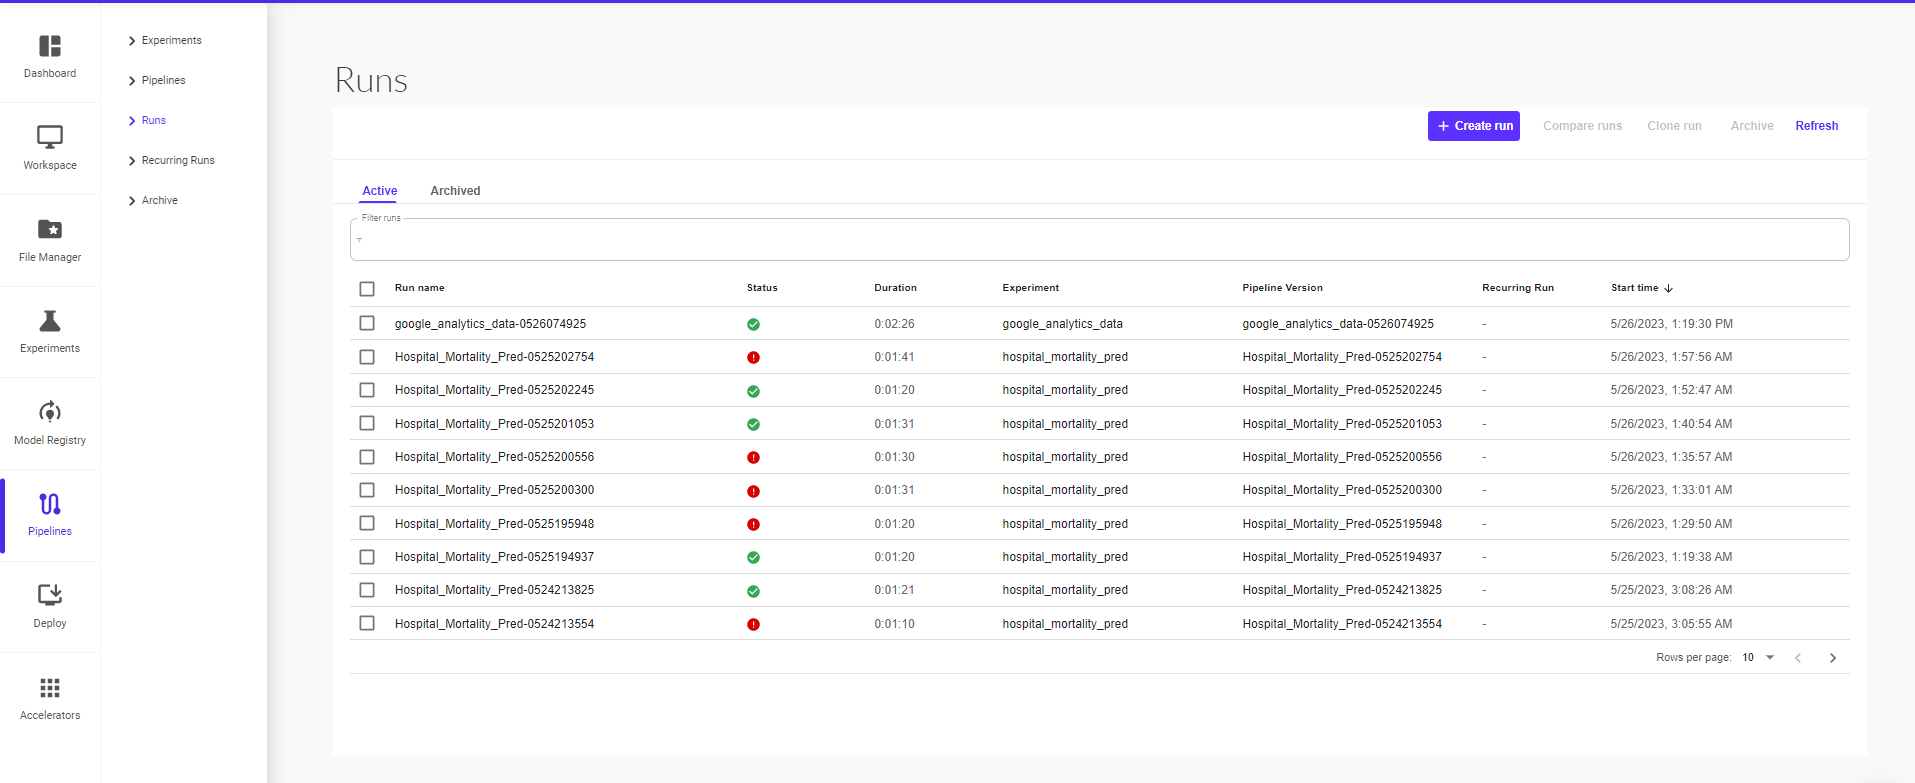
All the pipeline runs within an experiment can be viewed in the Experiment section.
For each run, you can view its current status, duration for which it ran, the pipeline version, start time and whether it’s a recurring run.
Pipelines
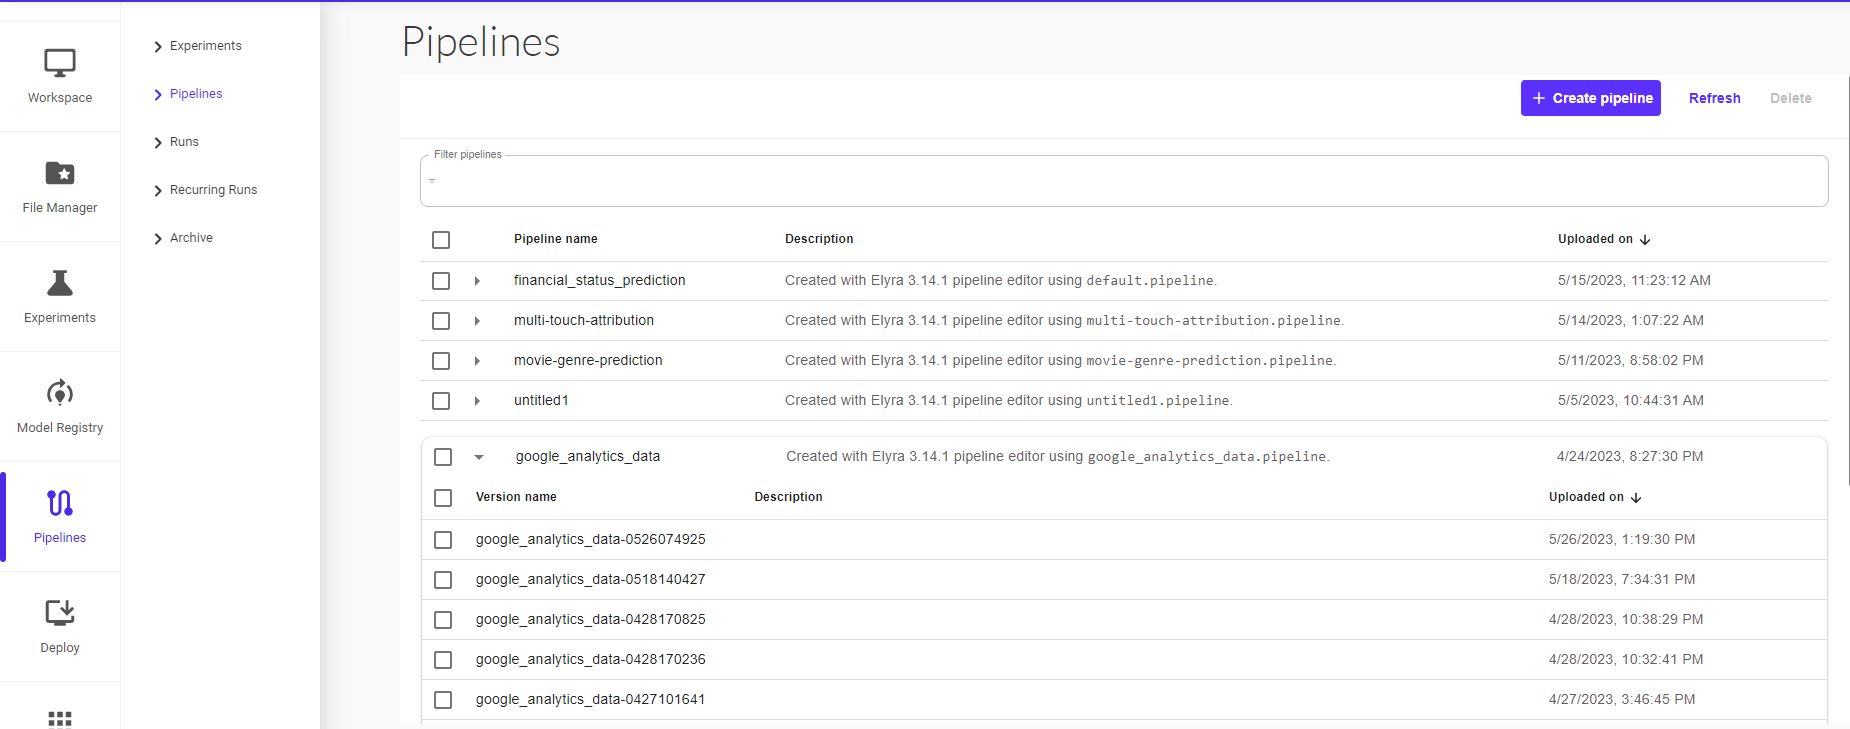
In this section, you can view all your existing pipelines and their different versions available.
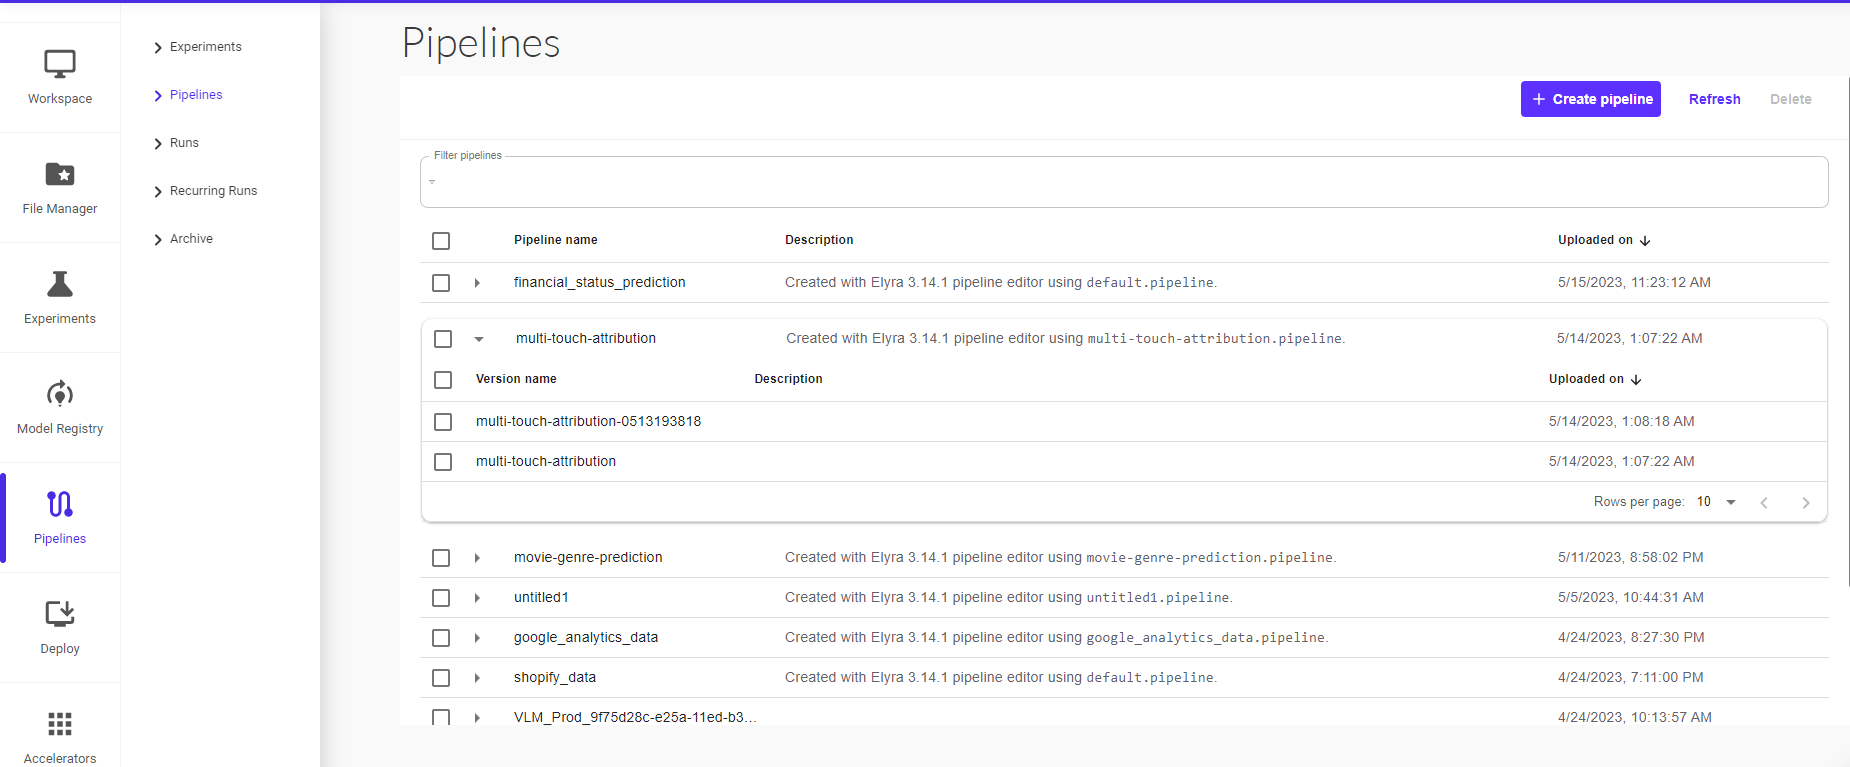
You can also upload a pipeline from the Pipelines UI.
To create a pipeline:
Click on Create Pipeline

On the ‘Upload Pipeline’ page, you can create a new pipeline or create a new pipeline version under an existing pipeline.
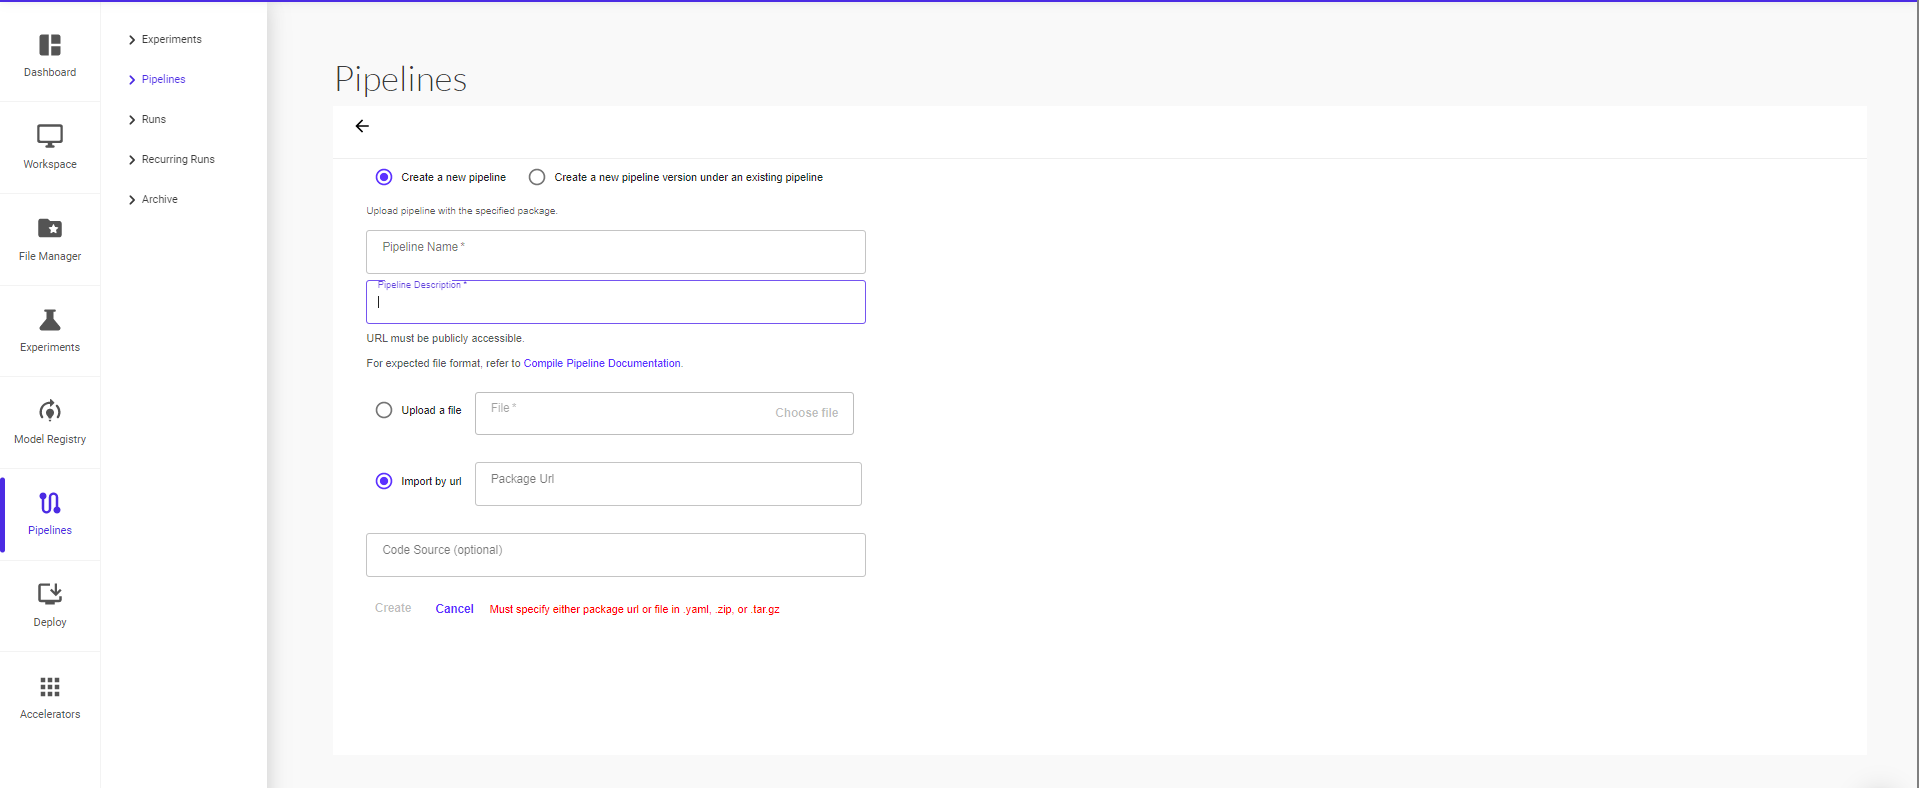
Give your pipeline a name and short description. Proceed to then upload a file or import by URL (package url or file must be in .yaml, .zip, or .tar.gz format), then click on ‘Create’ to finish uploading your pipeline.
Once the pipeline is created, you can view it under pipelines. Click on the pipeline to open the execution graph of the pipeline.
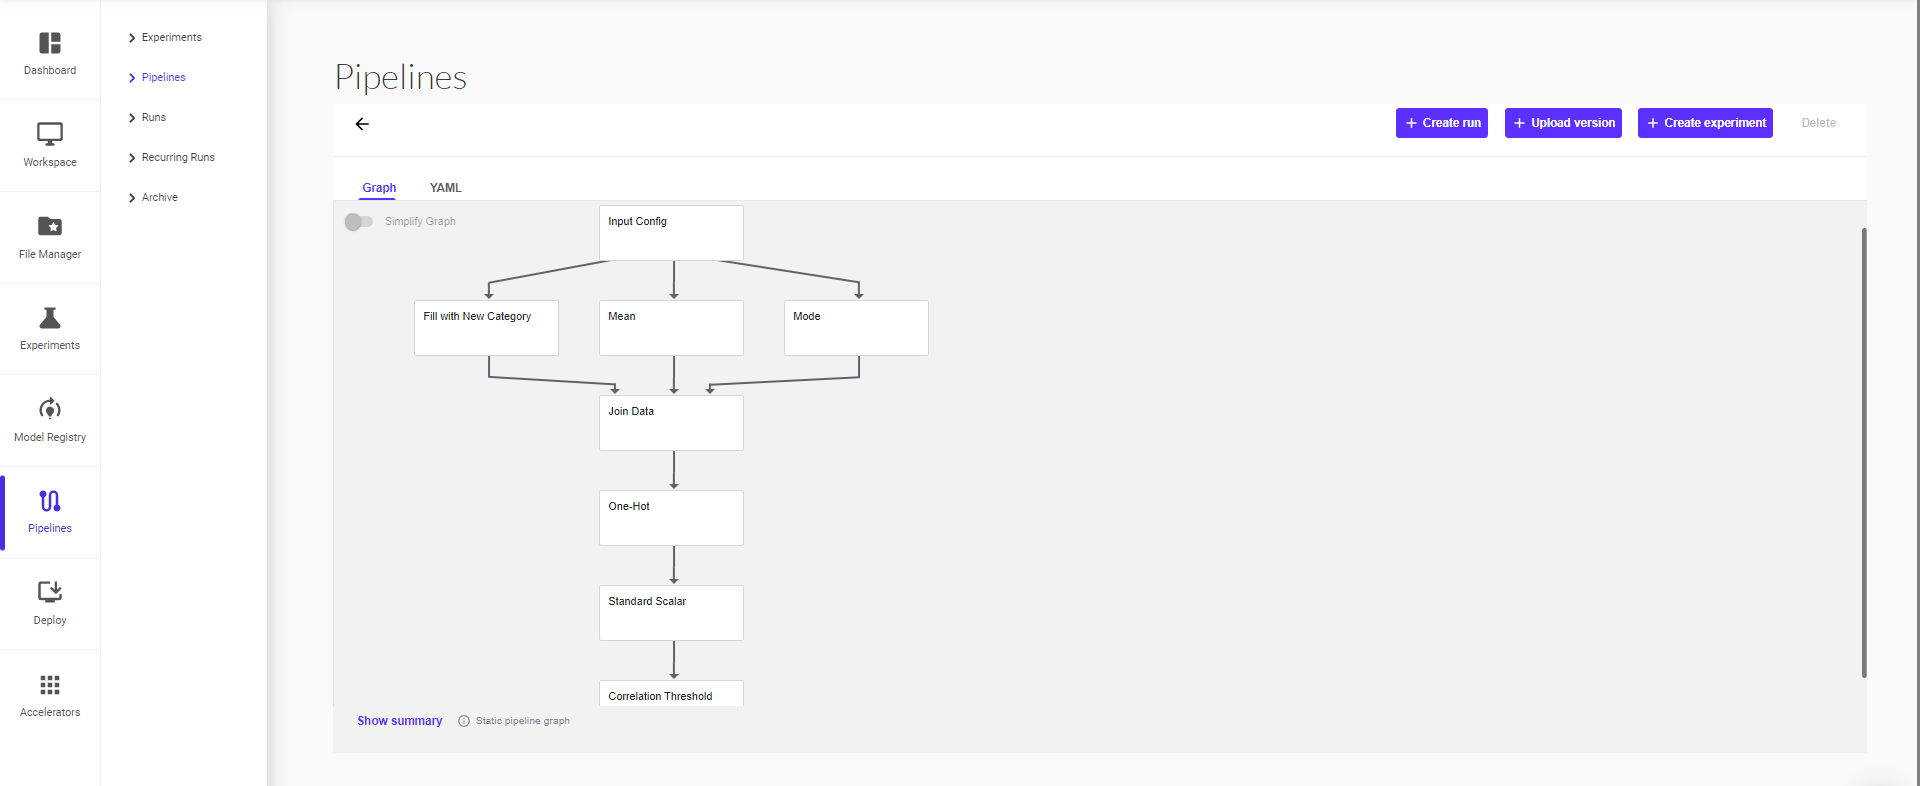
You can simplify the view by clicking on ‘Simplify Graph’ button. This enables a transitive reduction of the pipeline graph, hiding all the redundant edges. This option is just a visualization helper and does not have any permanent effect on the pipeline itself.
You can create an experiment or directly create a pipeline run by selecting ‘Create Experiment’ or ‘Create Run’.
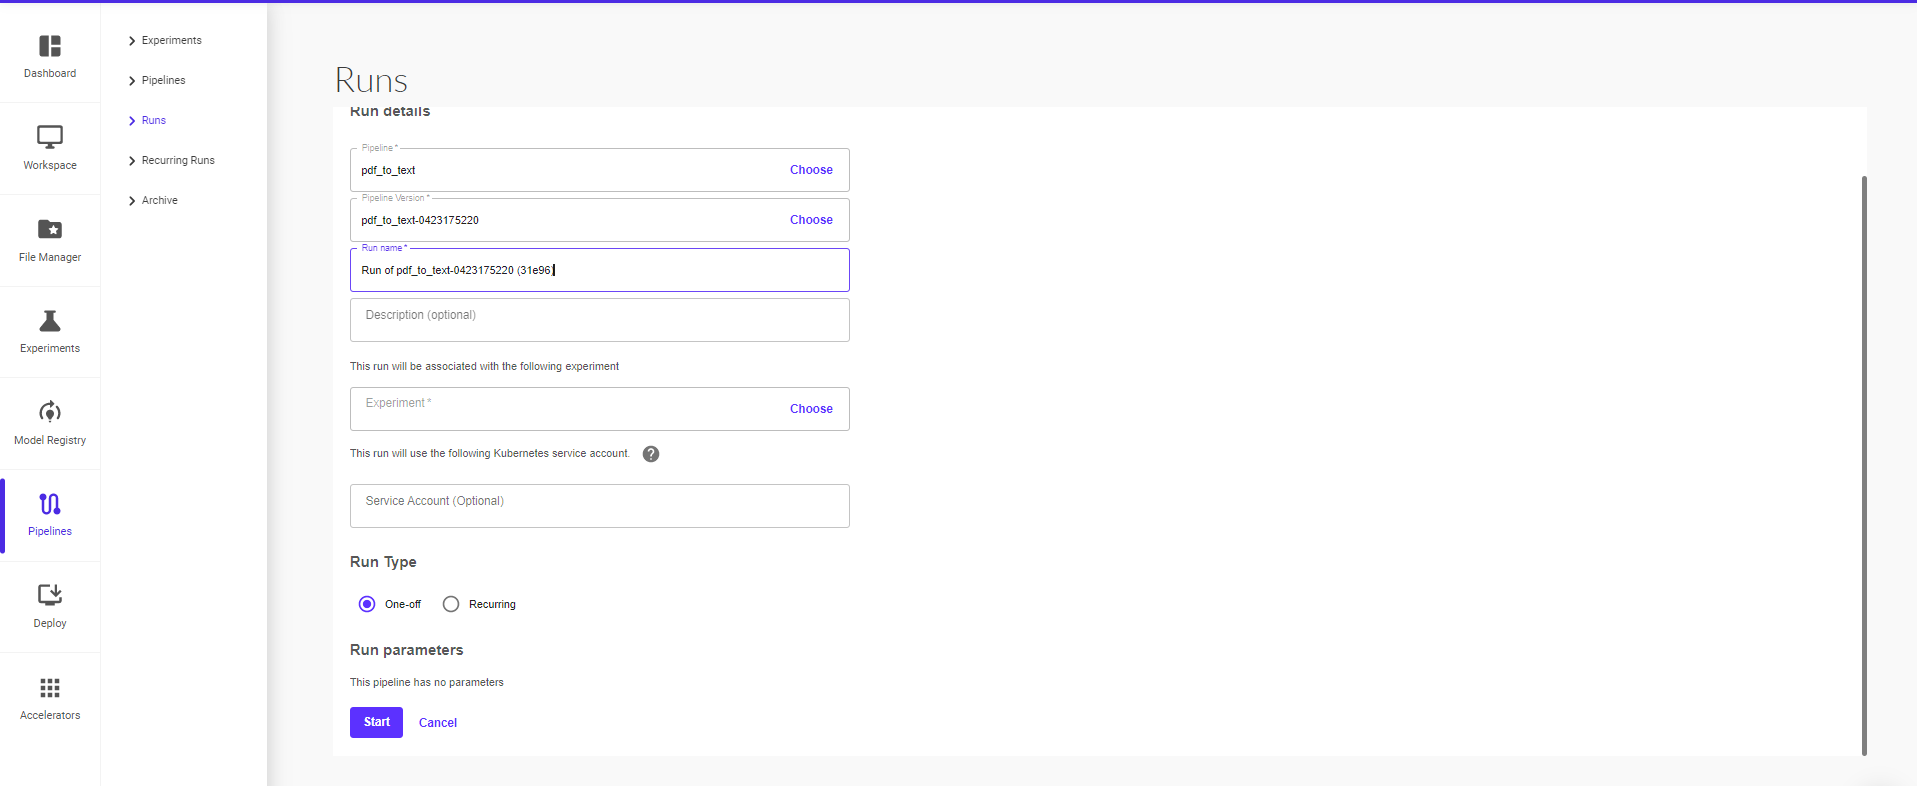
Clicking on ‘Create Run’ will take you to the next page where you can provide the run details (pipeline, pipeline version, run name, run type – one off or recurring) and then click on ‘Start’ to start the run.
Run
A run is a single execution of a pipeline. Runs comprise an immutable log of all experiments that you attempt, and are designed to be self-contained to allow for reproducibility. You can track the progress of a run by looking at its details page on the Pipelines UI, where you can see the runtime graph, output artifacts, and logs for each step in the run.
To create a run:
Navigate to Pipelines from the sidebar in the platform UI and Select Pipelines from the pop-up sidebar within the Pipelines section.
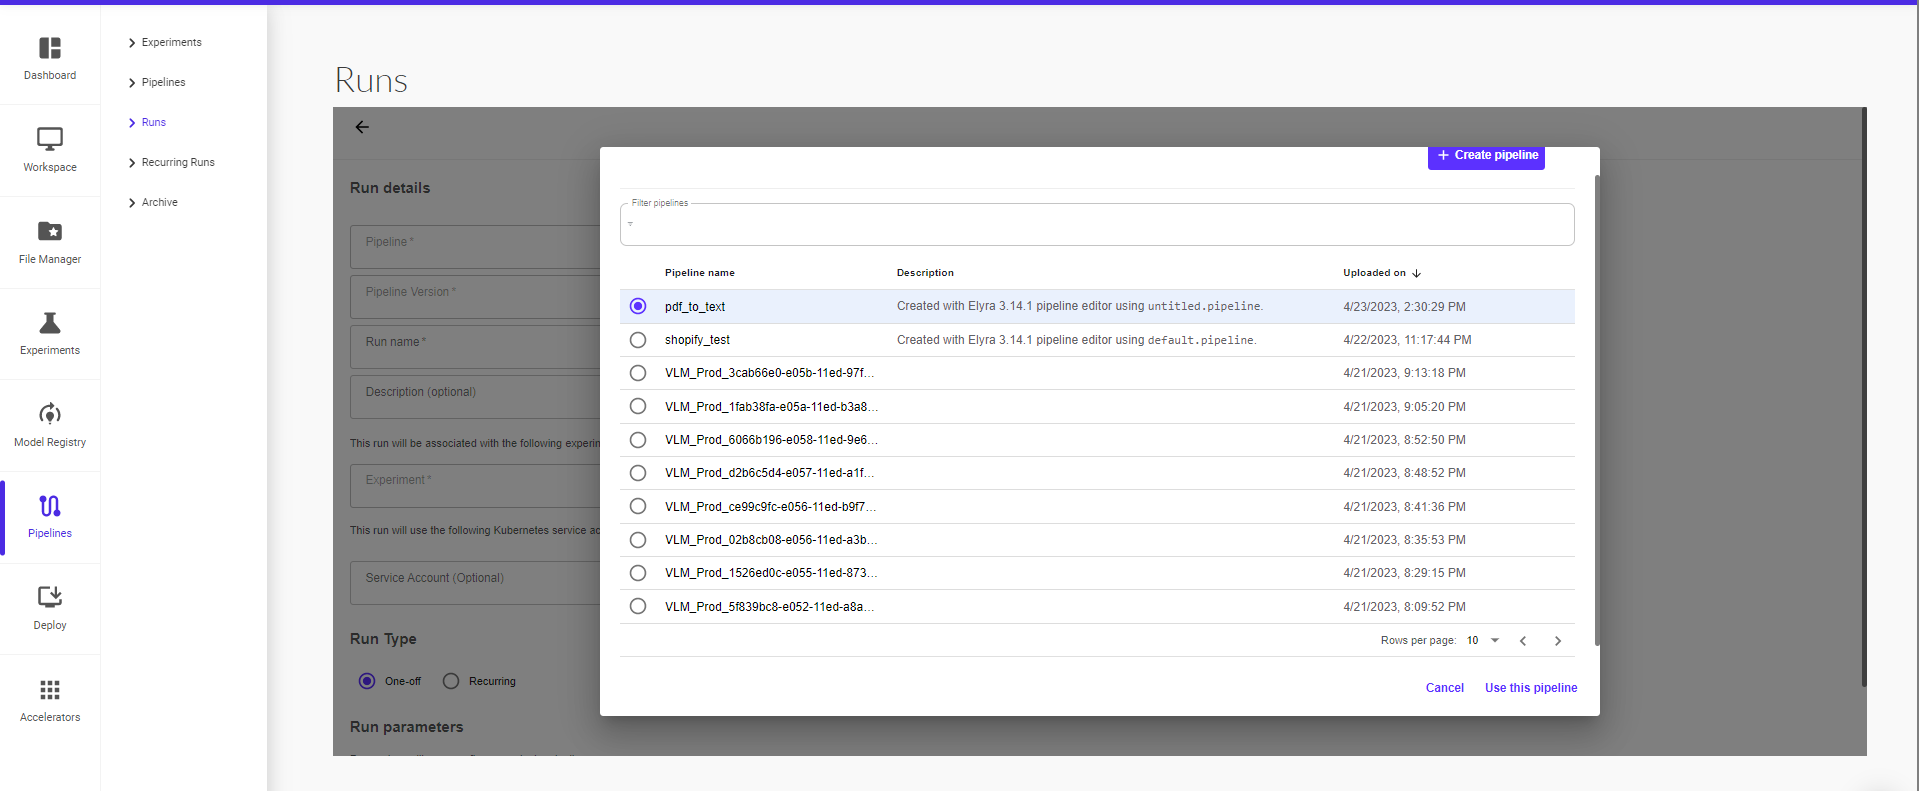
Select the pipeline that you want to run from the list of existing pipelines.
Select the version of the pipeline.
The pipeline graph will populate in the UI. Click on ‘Create Run’ to proceed.
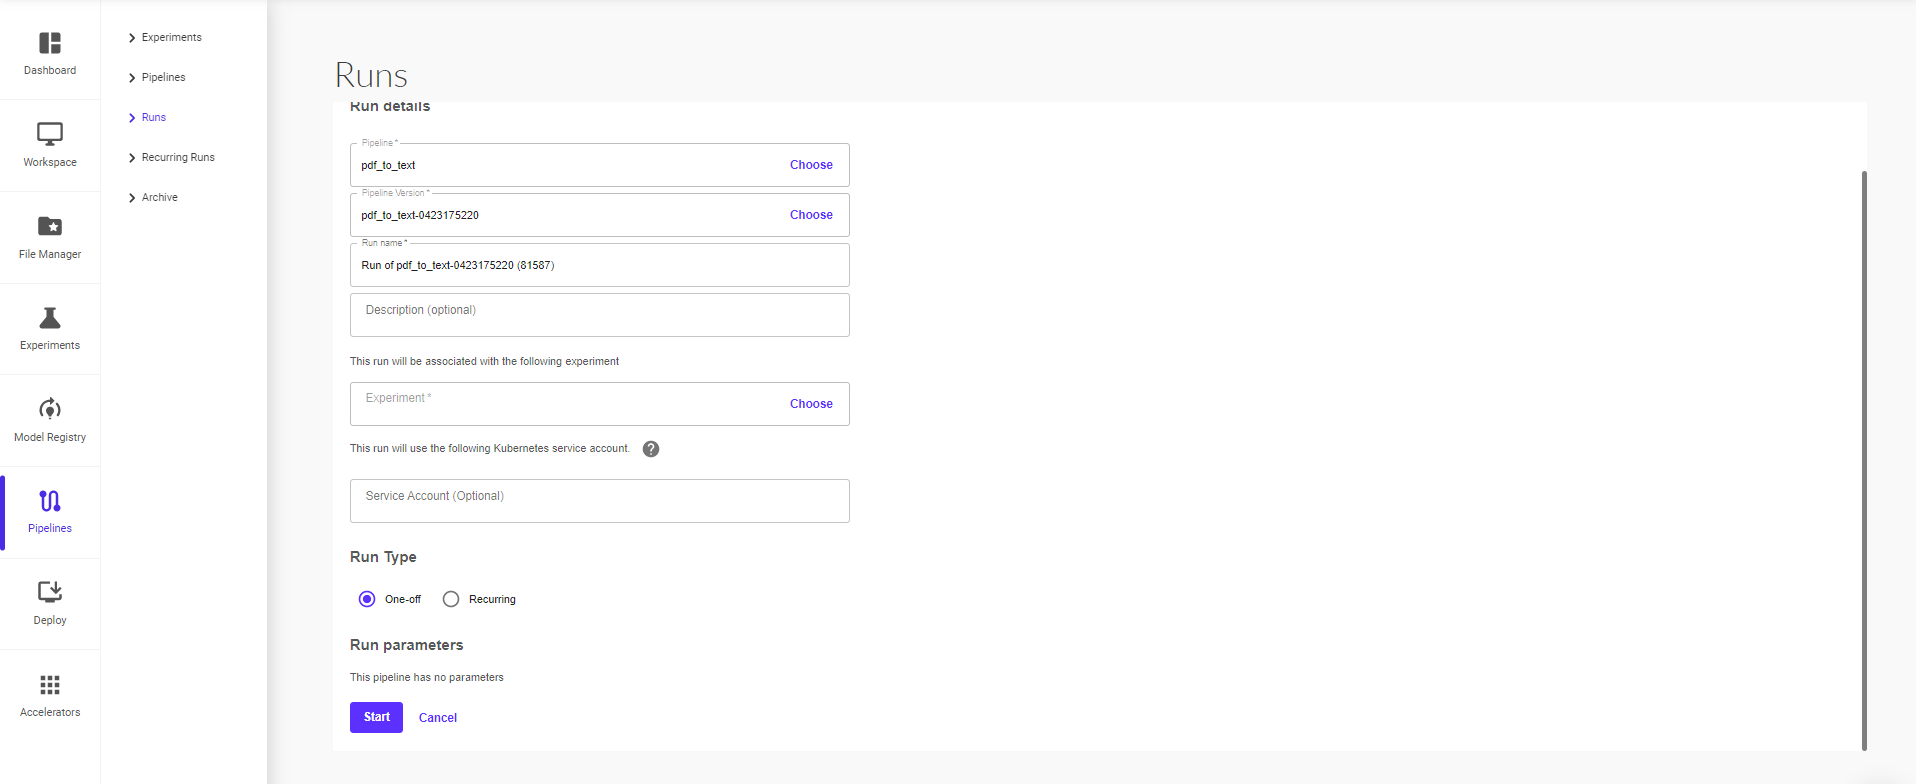
Clicking on ‘Create Run’ will take you to the next page where you can provide the run details (pipeline, pipeline version, run name, run type – one off or recurring) and then click on ‘Start’ to start the run.
You can view the pipeline run progress from the runtime execution graph.
A graph is a pictorial representation in the Pipelines UI of the runtime execution of a pipeline. The graph shows the steps that a pipeline run has executed or is executing, with arrows indicating the parent/child relationships between the pipeline components represented by each step. The graph is viewable as soon as the run begins. Each node within the graph corresponds to a step within the pipeline and is labelled accordingly.
The screenshot below shows the example pipeline’s runtime execution graph in the Pipelines UI:
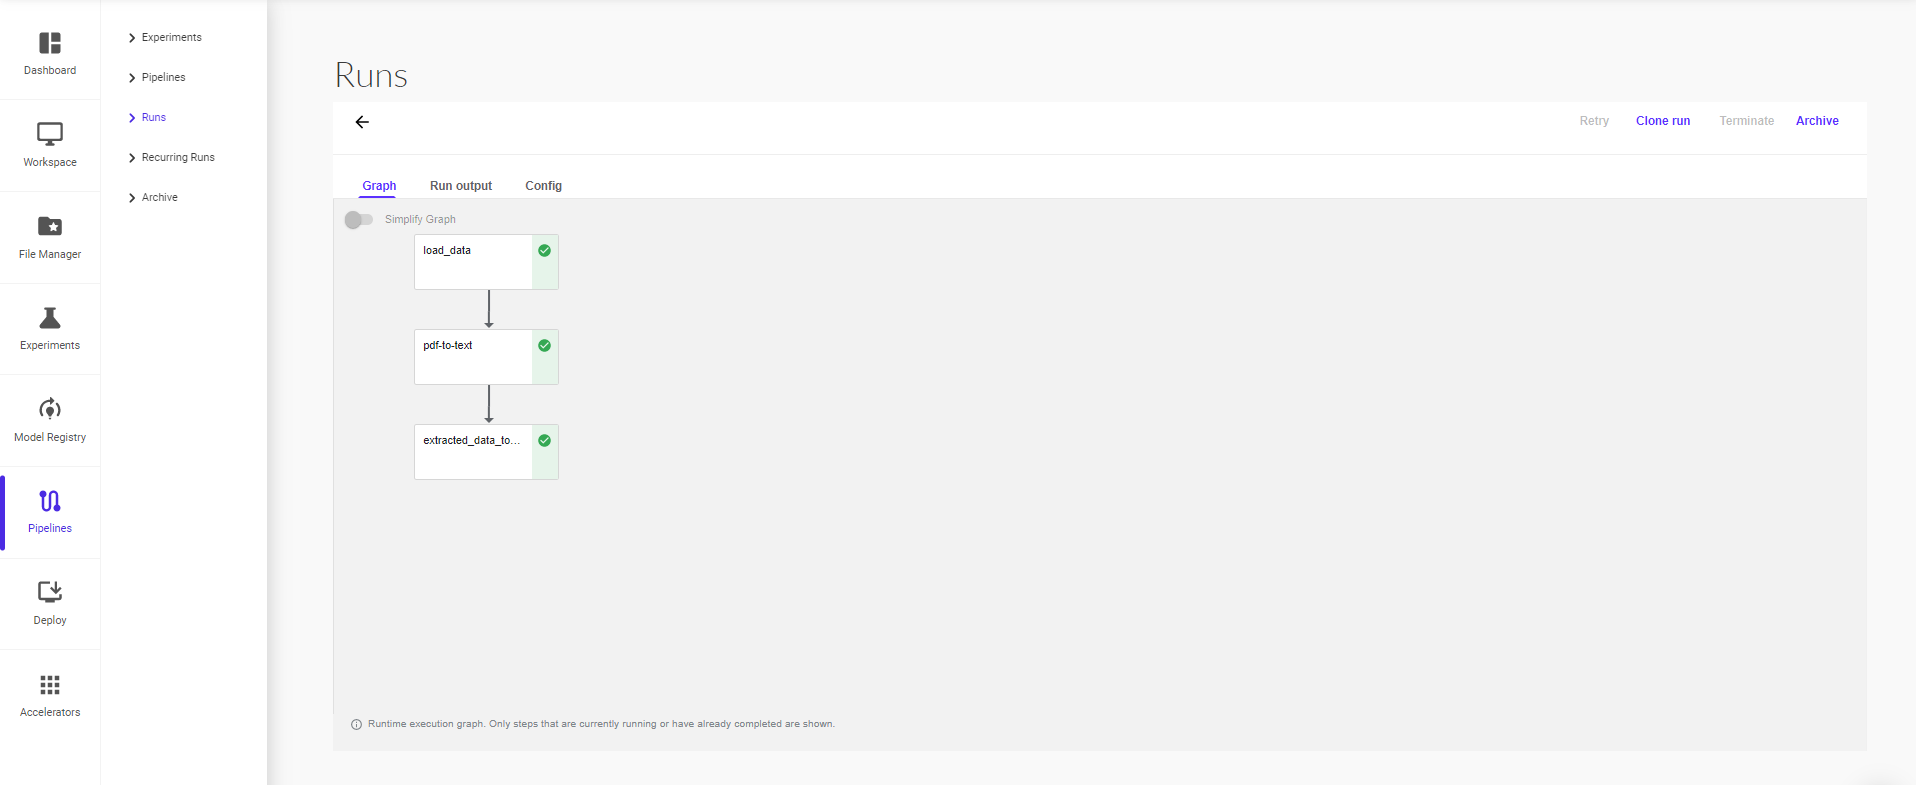
At the top right of each node is an icon indicating its status: running, succeeded, failed, or skipped. (A node can be skipped when its parent contains a conditional clause.)
Recurring Run
A recurring run, or job in the Pipelines backend APIs, is a repeatable run of a pipeline. The configuration for a recurring run includes a copy of a pipeline with all parameter values specified and a run trigger. You can start a recurring run inside any experiment, and it will periodically start a new copy of the run configuration. You can enable/disable the recurring run from the Pipelines UI. You can also specify the maximum number of concurrent runs, to limit the number of runs launched in parallel. This can be helpful if the pipeline is expected to run for a long period of time and is triggered to run frequently.
To create a recurring run:
When creating a run, select run type as ‘Recurring’
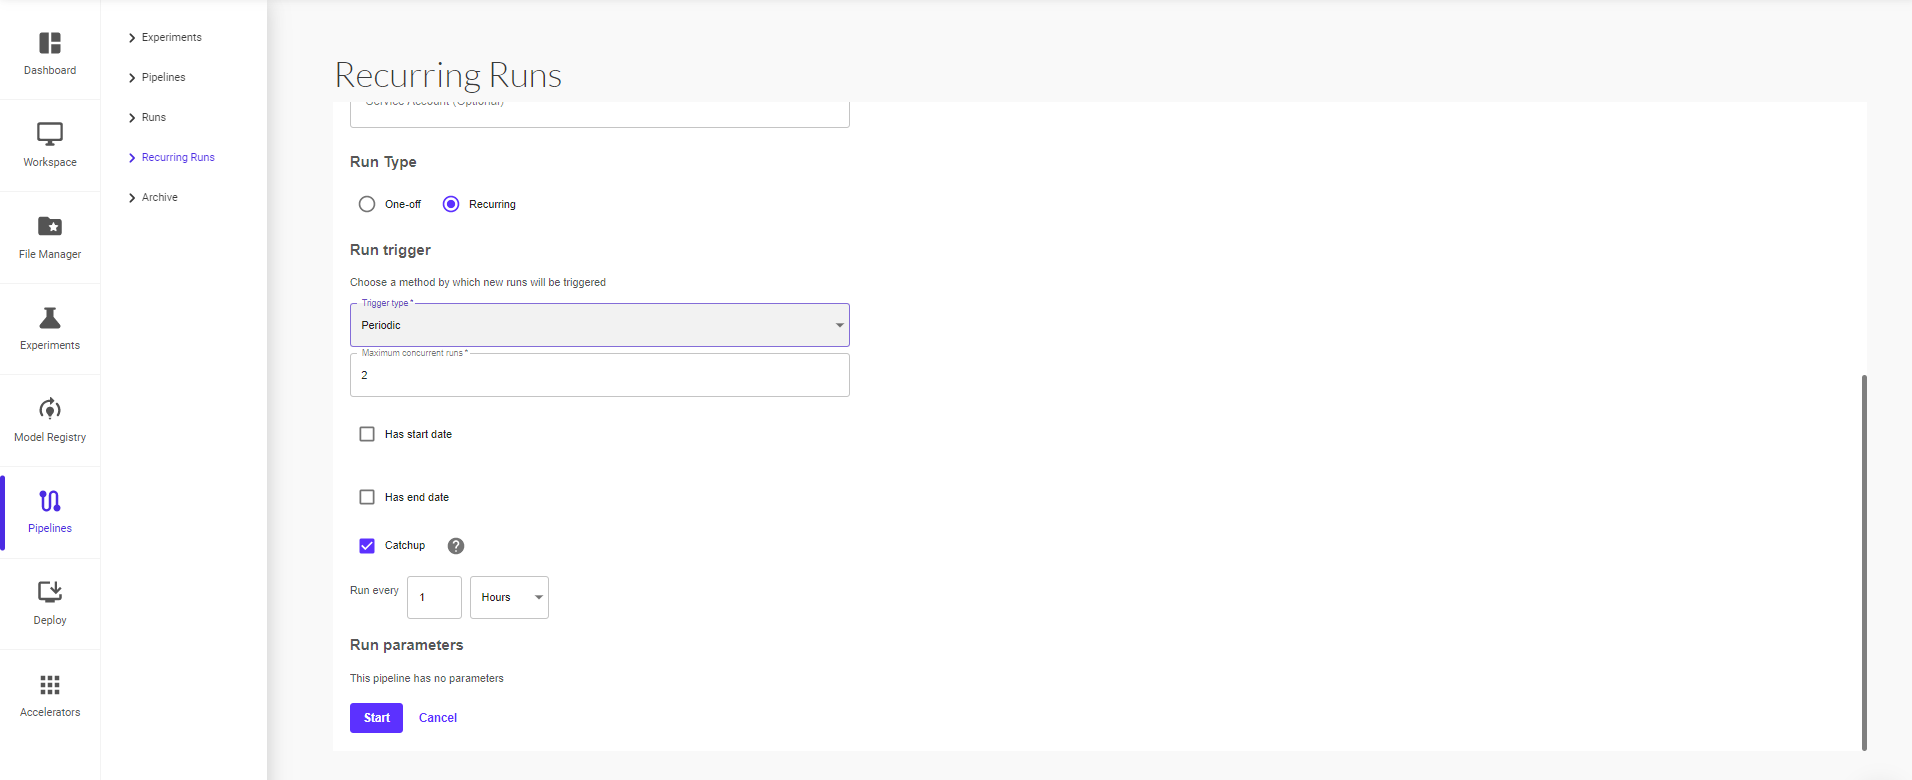
Set the parameters for trigger type – Periodic or Cron, maximum concurrent runs and set the interval for each trigger in minutes, hours, days, weeks or months. You can also set start and end date for the recurring run by checking the ‘Has start date’ and ‘Has end date’ boxes, then setting the dates for each respectively.
Enable the ‘Catchup’ option to ensure whether the recurring run should catch up if behind schedule. Defaults to true. For example, if the recurring run is paused for a while and re-enabled afterwards. If catchup=true, the scheduler will catch up on (backfill) each missed interval. Otherwise, it only schedules the latest interval if more than one interval is ready to be scheduled.
Usually, if your pipeline handles backfill internally, you should turn catchup off to avoid duplicate backfill.
Archive
For runs, users can first archive and then delete archived runs. Note: only archived runs can be deleted from UI to avoid accidental deletion
For experiments, users can archive experiments. We haven't enabled deletion of archived experiments in UI, because the current logic of deleting an experiment only deletes the experiment while leaving the runs inside the experiment intact, which will cause an issue when we render a run without an experiment in Run Details page. Therefore, we don't enable deletion of archived experiments for now.
Moreover, experiments don't take much space in our storage. Runs do. Therefore, deletion of runs can free up a consideration amount of resources.